1
QUA RT E R LY I N F L AT I O N
R E V I E W
JUNE
–
SEPTEMBER 2016
n.19
EXECUTIVE SUM MARY
In September 2016, year-on-year (YoY) inflation in Timor-Leste was -1.3%, this rate is below the 4%-6% target
ra ge set out i the Go er e t’s Strategi De elop e t Pla a d is the eleventh month in a row that Timor-Leste has experienced deflation (YoY). Quarter-on-quarter (QoQ) inflation in September 2016 was 0.0%; this is higher than the rate seen in September 2015 (-0.4%) and the rate witnessed in June 2016 (-0.4%).
This episode of deflation in Timor-Leste can mainly be attributed to international factors such as the appreciation of the US dollar against the majority of Timor-Leste’s tradi g part ers’ currencies and the decrease in the international price of oil and food prices. The sharp fall in the price of food and non-alcoholic beverages is acting as the main driver of deflation as a consequence of the significant weight of this group in the
Timor-Leste’s CPI basket. YoY core inflation, which excludes the prices of these volatile items, was -0.5% in September 2016, down from 2.0% in September 2015. Looking ahead to the coming quarters, there are signs that upward pressure may be put on prices; money supply growth continues to be in double digits, averaging 15.2% over the past year, and international prices have been rising; international food prices increased 4.6% over the last three months.
TREN DS I N I N FL ATION
In September 2016 YoY inflation in Timor-Leste was -1.3%; this means that a basket of goods and services that cost $100.00 in September 2015 will now cost $98.70 in September 2016. YoY inflation is lower than the rate seen in September last year (0.5%). QoQ inflation in September 2016 was 0.0%; this is lower than the rate of -0.4% seen in September 2015 and the rate witnessed in June 2016 (--0.4%).
After a lengthy period of double-digit inflation between March 2011 and September 2013, inflation decreased
dra ati all a d fell elo the Go er e t’s 4%-6% target range in January 2014. Inflation has been negative for the last eleven consecutive months. As seen in Figure Two, Food and non-alcoholic beverages account for
2
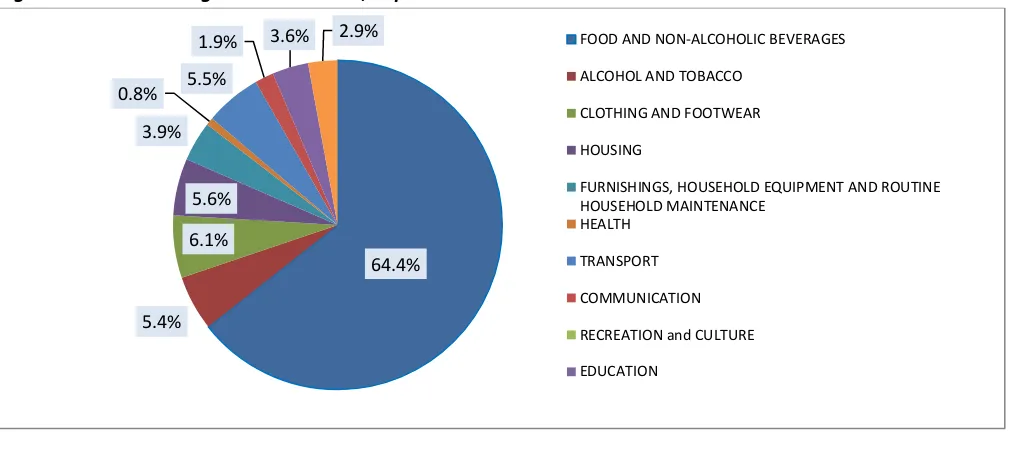
approximately 65% of Timor-Leste’s CPI asket1, as nearly two thirds of Timorese household expenditure is
spent on this group. Thus price movements in this group will have a significant impact on the overall rate of inflation and the purchasing power of the Timorese citizens. YoY food and non-alcoholic beverage inflation in September 2016 was -1.9%, slightly higher than the rate of -2.5% witnessed in June 2016.
Figure One: Year-on-Year Inflation in Timor-Leste
YoY core inflation2, which excludes the prices of particularly volatile items, namely food and non-alcoholic
beverages, was -0.5% in September 2016, down significantly from 2.0% in September 2015, illustrating that it is not only international food prices driving deflation. Core / non-food inflation may provide a more accurate measure of long-term inflationary trends as it is less susceptible to being impacted by temporary food price shocks.
Figure Two: Series weights in CPI Basket, September 2016
1 Timor-Leste’s CPI asket is ade up of the te e pe diture groupi gs see i Figure T o. 2 Calculated by the National Directorate of Economic Policy
-5%
Food and Non Alcholic Beverages Core Inflation Timor-Leste Dili Districts
64.4%
3
Over the past 12 months there have been significant price changes in the following expenditure classes3:
Housing (-2.1%)
Furnishing, household equipment and routine household maintenance (-4.6%)
Transport (-4.9%)
Education (6.0%)
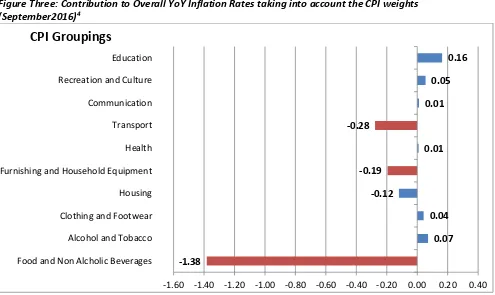
The largest upwards contributions (see Figure Three) to the overall year-on-year inflation rate in September 2016 came from:
Education (0.16 pp (percentage points))
Alcohol and Tobacco (0.07pp)
The largest deflationary contributions (see Figure Three) to the overall year-on-year inflation rate in September 2016 came from:
Food and Non-Alcoholic Beverages (-1.38pp)
Transport (-0.28 pp)
The large decrease in the price of food is largely driven by a fall in the price of Vegetables (-2.3%), Rice (-1.4%), Meat (-3.3%) and Oils and fats (-5.9%). Vegetables hold a 16% weight in the CPI basket.
Figure Three: Contribution to Overall YoY Inflation Rates taking into account the CPI weights (September2016)4
3 Expenditure classes are the sub-categories within an expenditure group in a CPI index 4 See concepts and terminology section for further explanation
-1.38
0.07 0.04 -0.12
-0.19
0.01 -0.28
0.01 0.05
0.16
-1.60 -1.40 -1.20 -1.00 -0.80 -0.60 -0.40 -0.20 0.00 0.20 0.40 Food and Non Alcholic Beverages
Alcohol and Tobacco Clothing and Footwear Housing Furnishing and Household Equipment Health Transport Communication Recreation and Culture Education
4
CAU SES O F I N FL ATION
5International Factors
An appreciation (depreciation) of the US dollar against the currencies of Timor-Leste’s ajor tradi g part ers will put downward (upward) pressure on the price of imports in Timor-Leste. However, the effects of exchange rate and international commodity price movements on prices in Timor-Leste are likely to be felt some time after they occur6, as it takes time for the change in the price of imported goods to feed through to a change in the
price of consumer goods. For this reason exchange rate movement over the June 2015 to June 2016 period is analysed.
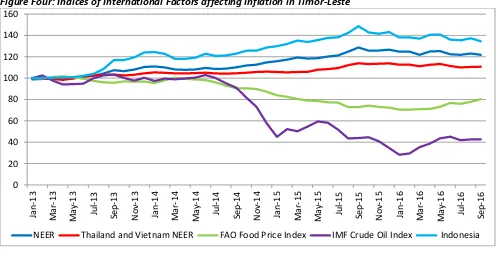
Between June 2015 and June 2016 Timor-Leste’s nominal effective exchange rate (NEER) appreciated by 1.6%; this appears to have been driven by the 8.7%% appreciation of the US dollar against the Chinese Renminbi. Over this period the US dollar also appreciated by 2.6% against a weighted Thai baht and Vietnamese dong basket. This appreciation placed downward pressure on rice prices (as these countries export large quantities of rice to Timor-Leste) and therefore inflation, as rice has a large weight in the CPI index.
International oil prices also fell over the June 2015 to June 2016 period; the IMF’s rude petroleu pri e i de fell7 by -22.4% over the period placing significant downward pressure on prices, especially transport prices.
International food prices also fell over the period with the Food and Agricultural Organizatio ’s FAO food pri e index falling by -1.0%, placing minor downward pressure on imported food prices.
Figure Four: Indices of International Factors affecting Inflation in Timor-Leste
5 Within this section inflation refers to YoY inflation 6 This analysis lags the impact by one quarter
7 The crude oil (petroleum) price index is a simple average of three spot prices; Dated Brent, West Texas Intermediate, and the Dubai Fateh.
5
Domestic Factors
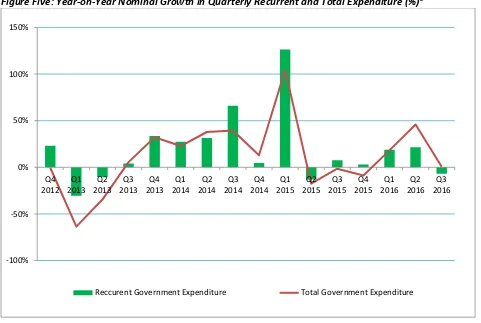
Increases in Government expenditure, particularly recurrent expenditures such as transfers and salaries & wages, can have an inflationary impact on the economy. This is currently not the case in Timor-Leste; however, this is likely the result of a combination of other factors:
The favourable international conditions, as discussed above, may outweigh the domestic inflationary pressure coming from Government expenditure.
Increases in government expenditure often result in an increase in imports which can mediate the inflationary impact.
Downward inflationary pressure may be coming from other domestic factors on both the supply and demand side such as improvements in the supply side of the economy8 and decreased non-Government
aggregate demand.
Figure Five: Year-on-Year Nominal Growth in Quarterly Recurrent and Total Expenditure (%)9
The growth in the money supply of an economy is also likely to have some influence on inflation. Taking the average change in money supply across the year10, a 15.2% increase was witnessed. This may have impacted
upon inflation.
8 The amount of money that can be spent in an economy before inflation begins to increase
9 This measures the year-on-year growth in quarterly nominal expenditure, i.e. the growth rate in Q3 2016 measure the change between nominal expenditure in Q3 2015 and Q3 2016.
10 Taking average money supply for the last 12 months and compare to average money supply in the previous 12 months.
-100%
6
CON SEQ UE NCES OF IN FL ATIO N
Inflation will cause households’ purchasing power to fall, if increases in household income are lower than the increases in inflation. This situation is more likely to occur in a high inflation environment. Inflation which reduces consumers’ purchasing power can reduce living standards and may increase poverty. Thus the recent negative inflation seen in Timor-Leste is o siste t ith the Go er e t’s po ert redu tio strateg . Given the high weight of food in Timor-Leste’s asket of goods, it is u likel that deflatio will lead to delayed-purchasing and is not, therefore, currently a concern for the Government.
IN FL ATIO N OUT L OOK
YoY inflation is likely to remain below the SDP target range (4%-6%) in the near term. The following factors are likely to have an impact on future rates of inflation in Timor-Leste:
International commodity prices
:
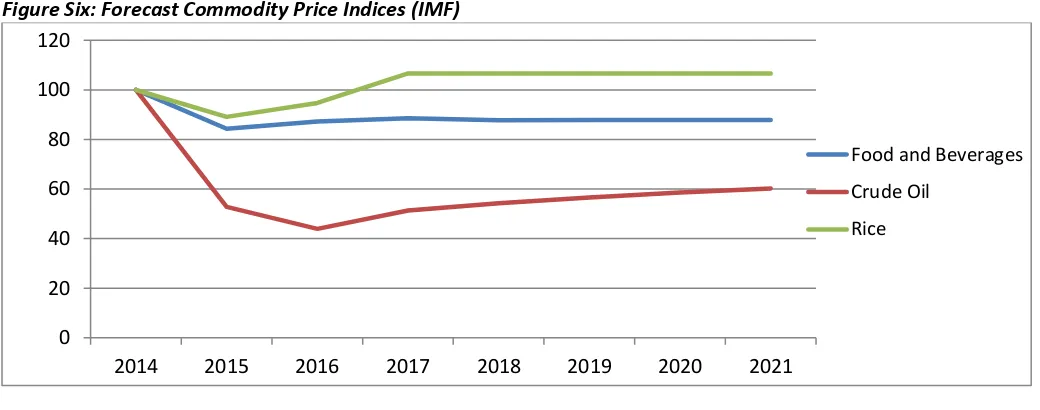
between June 2016 and September 2016, international food prices increased by 4.6% while the price of crude oil fell by -5.5%. As changes in commodity prices have a lagged effect on inflation in Timor-Leste, it is likely that these price changes will impact inflation in Q4 2016. Given the weight of food inTL’s CPI asket, it is likely that the increasing prices of food will have more of a dominant effect. In the medium to long-term, while still low, the IMF have revised their commodity price forecast11 upwards; again, this is
expected to place upward pressure on inflation.
International exchange rates: between June 2016 and September 2016 Timor-Leste’s NEER depreciated by -0.5%. This puts some upward pressure on inflation by increasing the cost of imported goods and services. Government expenditure: the increase in Government expenditure over the last four quarters will result in increased inflationary pressure, the extent to which this will result in higher inflation depends on the impact of other factors and the econom ’s absorptive capacity.
Figure Six: Forecast Commodity Price Indices (IMF)
11 Primary Commodity Prices, IMF (http://www.imf.org/external/np/res/commod/index.aspx) 0
20 40 60 80 100 120
2014 2015 2016 2017 2018 2019 2020 2021
Food and Beverages
Crude Oil
7
ANN EX 1 : CO NCE PTS AN D TERMI N O L OGY
Consumer price inflation the rate at which the prices of goods and services bought by households increase or decrease.
The Consumer Price Index (CPI)12isused to measure consumer price inflation. To understand CPI think of a
large basket containing the goods and services bought by households, the CPI estimates the change to the total cost of the basket on a monthly basis.
Year-on-year (YoY) inflation is the most commonly used measure and is calculated by comparing the price index from a given period with the same month in the previous year. For example, the year-on-year inflation in September 2016 measures the percentage change in prices between September 2015 and September 2016.
Quarter-on-quarter inflation (QoQ) is calculated by comparing the price index from the last month of a given quarter (March, June, September or December) with the last month of the previous quarter13. Thus
quarter-on-quarter inflation in September 2016 measures the percentage change in prices between June 2016 and September 2016.
Month-on-month inflation (MoM) is calculated by comparing the price index from the latest month to the previous month. Thus the month-on-month inflation in September 2016 measures the percentage change in prices between Augustus 2016 and September 2016.
Contribution to inflation rate measures the contribution to the overall rate of inflation of a grouping of goods and services, a groups contribution to the overall rate of inflation is determined by its growth rate and weight within the series14.
Nominal effective exchange rate (NEER) is the eighted a erage alue of a ou tr ’s urre relati e to the
currencies of its major trading partners.
Core inflation is a measure of inflation which excludes certain items that face volatile price movements. Core inflation eliminates products15 that can have temporary price shocks because these shocks can cause a
divergence from the overall trend in inflation giving a false measure of inflation.
Purchasing Power measures the quantity of goods and services which can be purchased with a unit of currency. All else being equal inflation decreases the amount of goods and services a consumer is able to purchase with their monthly salary.
Timor-Leste’s Co su er Pri e I de is pu lished o thl Ge eral Dire torate of Statisti s MoF16. This index
is divided into 10 specific groups representing specific sets of commodities such as food and non-alcoholic beverages, housing and transport. In addition, separate consumer price indices are compiled for both Dili and the districts.
12 The CPI is a weighted index meaning that the i flue e o the CPI i de of a gi e ite is depe de t o the ite ’s share in total household consumption.
13 In this publication
14 The contributions of each grouping will sum to give the overall rate of inflation
15 The core inflation index in Timor-Leste excludes all food and non-alcoholic beverage items
8
ANN EX 2 : NOTE S
This bulletin is produced by the National Directorate for Economic Policy, Ministry of Finance, on a quarterly basis, in both English and Tetum. Please refer any queries to the below contacts:
1. Epifanio Martins, Director of NDEP Email: [email protected]
2. Nelio Francisco B.S. Mesquita, Analyst Email: [email protected]