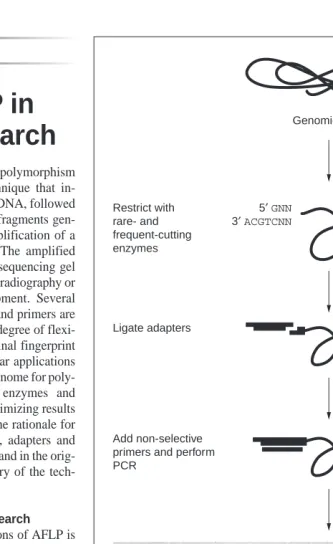
Amplified fragment length polymorphism (AFLP) is a PCR-based technique that in-volves restriction of genomic DNA, followed by ligation of adapters to the fragments gen-erated and selective PCR amplification of a subset of these fragments1,2. The amplified fragments are separated on a sequencing gel and visualized, usually by autoradiography or fluorescent sequencing equipment. Several different restriction enzymes and primers are available, which gives a high degree of flexi-bility, enabling the complex final fingerprint to be manipulated for particular applications and efficient scanning of the genome for poly-morphisms. The choice of enzymes and primer length is crucial for optimizing results in different applications and the rationale for choosing restriction enzymes, adapters and primers is described both here and in the orig-inal publications1,2. A summary of the tech-nique is shown in Fig. 1.
Applications to cereals research One of the principal applications of AFLP is in genetic mapping. In barley, AFLP markers are located on the long and short arms of all seven chromosomes, with a strong cor-relation (r50.91) between the number of markers per chromosome and the length of the chromosome3. In rice, mapping an F2 popu-lation from an Indica 3 Japonica cross revealed that 50 AFLP markers were located on every chromosome except the relatively small chromosome 12 (Ref. 4). These investi-gations illustrate the utility of AFLP in detect-ing polymorphic loci throughout the genome of these species.
Incorporation of 118 AFLP markers into an existing barley map comprising 157 RFLP loci significantly increased the total map length by 71%, the increase being attributed to gap fill-ing, terminal extensions and general expan-sion of relatively well-mapped regions3. By contrast, the addition of 671 AFLP markers to a barley map of an Igri 3 Franka cross comprising over 450 RFLP markers did not increase the total map length5. The AFLP markers were also useful for bridging maps of two further barley crosses. These results indi-cate that extension of linkage maps probably reflects the level of saturation of the initial map, rather than being a general feature of AFLP markers. In addition, small errors in data sets will increase the map length to a greater extent for maps with a relatively high marker density. Generally, AFLP markers,
which are produced by different combinations of restriction enzymes, are distributed through-out the genome4–6, although clustering of markers in centromeric regions has also been reported7. However, there is evidence that
AFLP markers lie outside regions that are heavily populated with RFLPs (Refs 3,5).
A comparison of parent pairs revealed that the level of polymorphism detected in barley by AFLP can range from 12.2% (between
76
trends in plant science
update
February 1999, Vol. 4, No. 2 1360 - 1385/99/$ – see front matter © 1999 Elsevier Science. All rights reserved. PII: S1360-1385(98)01363-6
Use of AFLP in
cereals research
Fig. 1. Overview of the AFLP technique. In this example, PstI is the rare-cutting enzyme (left)
and MseI is the frequent-cutting enzyme (right). After non-selective PCR an aliquot of the pre-amplification reaction shows a smear of fragment sizes on an agarose gel from 100 bp to over 1000 bp (left, 100 bp ladder). Selective PstI and MseI primers are typically prepared with 11, 12 or 13 selective nucleotides at the 39 end. The sequencing gel shows two poly-morphisms among isolates of the barley mildew pathogen Erysiphe graminis when ampli-fied by 12 PstI and MseI primers.
Genomic DNA
Restrict with rare- and frequent-cutting enzymes
Ligate adapters
Add non-selective primers and perform PCR
Selective PCR and visualization 5′GNN
3′ACGTCNN
NNT 3′
Procter 3Nudinka) to 29.0% (between L94 3 Vada)8. In general, the level of polymorphism detected by AFLP is lower than with other mapping techniques such as RFLPs and micro-satellites. However, the ability to analyse a large number of polymorphic loci simulta-neously, ‘effective multiplex ratio’, with a single primer combination on a single gel con-firms the highly informative value of the tech-nique compared with other mapping methods.
A comparison of AFLP with other molecular marker techniques is shown in Table 1.
Because large numbers of polymorphisms can be screened by AFLP analysis, it is possible to saturate particular regions of the genome, a necessary pre-requisite for map-based cloning of target genes. Analysis of bulked segregants by AFLP identified several markers closely linked to the barley Mlo resistance gene, which allowed this locus to be delimited to 30 kb (Ref. 9).
AFLP has also been used in phylogenetic studies and for discriminating between vari-eties. In a study of barley, accessions could be grouped according to their salt tolerance and area of origin by genotyping with AFLP (Ref. 10). Other molecular techniques, such as RFLP, have been reliably used for phylo-genetic studies, but AFLP affords a new level of precision in this type of investigation. It is now possible to determine the ancestral ori-gin of Einkhorn wheat using AFLP analysis11, which had previously not been possible using other molecular techniques owing to the low genetic diversity of races. Using AFLP to compare 31 barley varieties enabled the iden-tification of a single line with a single primer pair, indicating the value of the technique for cultivar identification12. The discriminating power and reliability of AFLP will be useful for plant variety registration, assisting in the EU requirement for testing distinctness, uni-formity and stability13.
Practical considerations
DNA can be prepared using a variety of stand-ard procedures. About 500 ng is required for AFLP analysis, which can be obtained from just a half grain of most Triticeae species, enabling non-destructive sampling of ungerminated seeds if required. A stock of the template DNA,
77
trends in plant science
update
February 1999, Vol. 4, No. 2
Box 1. Other marker techniques commonly used in cereals research
RAPD (Randomly amplified polymorphic DNA)
A PCR-based technique relying on the use of single, short (usually 10 bp) arbitrary oligo-mers used as prioligo-mers for PCR-mediated amplification of genomic DNA between closely spaced inverted sequences.
RFLP (Restriction fragment length polymorphism)
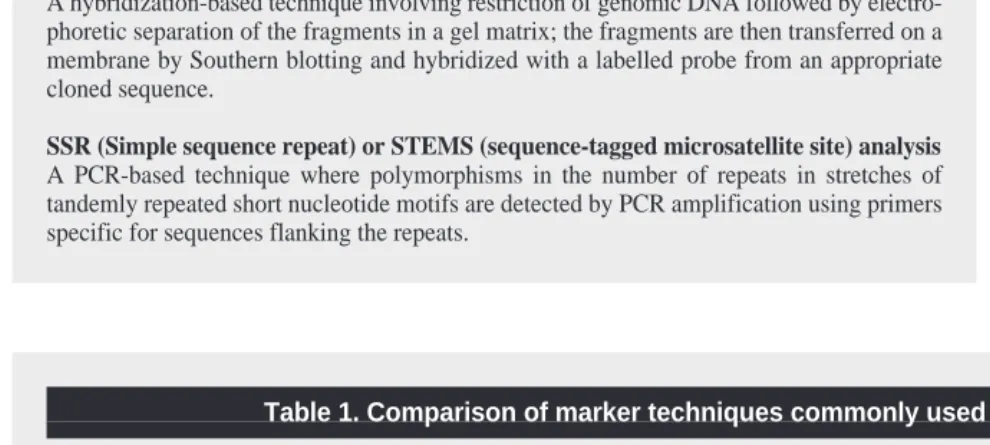
A hybridization-based technique involving restriction of genomic DNA followed by electro-phoretic separation of the fragments in a gel matrix; the fragments are then transferred on a membrane by Southern blotting and hybridized with a labelled probe from an appropriate cloned sequence.
SSR (Simple sequence repeat) or STEMS (sequence-tagged microsatellite site) analysis
A PCR-based technique where polymorphisms in the number of repeats in stretches of tandemly repeated short nucleotide motifs are detected by PCR amplification using primers specific for sequences flanking the repeats.
Table 1. Comparison of marker techniques commonly used in cereals research
Feature Marker system Refs
AFLP RFLP RAPD SSR
DNA required (mg) 0.5–1.0 10 0.02 0.05–0.10 24,25
PCR-based Yes No Yes Yesa
Level of polymorphism (Havb
) 0.11 0.28 N/Ac
N/A 3
0.29–0.64 N/A 0.33–0.34 0.47–0.76 4
0.32 0.41 0.31 0.6 22
Medium High Medium Very high 24
Effective multiplex ratiod
50–100 N/A 20–50 1.0 24
19.2 0.25 1.56 1.0 22
24.7 3.0 N/A N/A 26
Marker index (MIe
) 6.14 0.1 0.48 0.6 22
Reproducibility Very high Very high Fairf
Very high 3,14,25
Cost N/A N/A 2xAFLP N/A 4
$105g
$178 N/A N/A 26
Medium N/A Low Highh
22
Ease of use Difficult initiallyi
Labour intensive Easy Easyj
3,14,22
a
Sequence information required.
b
Hav, average heterozygosity. An average for the probability that two alleles taken at random can be distinguished.
c
N/A, data not available in the reference cited.
d
Effective multiplex ratio is the number of polymorphic loci analysed per experiment in the germplasm tested.
e
Marker index is the product of the average expected heterozygosity and the effective multiplex ratio.
f
Between laboratories, influenced by Taq polymerase and thermocycler.
g
Also savings of time compared to RFLP.
h
Cost of initial sequencing high.
i
Became easier with practise.
j
which is suitable for many analyses, is obtained by diluting the PCR product of an initial non-selective pre-amplification, that is obtained using primers with no selective nucleotides. The stock is stable for up to six months at 48C (Ref. 2) and can be replenished by further re-amplification if required. The procedures following DNA extraction are re-liable, providing highly reproducible results from various laboratories14.
The banding pattern of wheat DNA ex-tracted from different organs of the same plant was found to be affected by the DNA source15. This variation was thought to be due to ferential methylation of the DNA in the dif-ferent organs, which affected the restriction by methylation-sensitive enzymes, such as SseI. The banding pattern was not affected, however, when plant DNA extracts were contaminated by fungal DNA at concentrations less than 1:100 for fungal and plant DNA, respectively.
Choice of restriction enzyme and primers Typically, 100–150 bands can be separated on a standard length sequencing gel (40–50 cm) or by fluorescent sequencing equipment. In cereals with relatively small genomes, such as rice (4 3 108base pairs), six-base rare-cutting enzymes, such as EcoRI or PstI, are typically used with MseI as the frequent-cutting enzyme. This combination, with 12 selective nucleotide extensions on the primer, produces the required number of bands. For analysis of large cereal genomes such as wheat (~1.5 31010bp per haploid genome) or barley (~ 5 3109bp per haploid genome), eight-base cutting enzymes, such as SseI or its isoschizomer SdaI, can be used with 12 or 13 selective nucleotides. The restriction sites generated by SseI are compat-ible with PstI adapters and primers. Other suc-cessful enzyme combinations are described in the original publications1,2.
With smaller genomes the number of am-plification products can be reduced by increas-ing the number of selective nucleotides2: an extra nucleotide on one primer reduces the number of bands by a factor of about four. For larger genomes, however, this rule for reducing complexity does not hold. In an analysis of bar-ley, between 90 and 150 bands per primer com-bination were produced with EcoRI and MseI restricted DNA using 13 selective nucleotides for each primer8. In hexaploid wheat, use of 12 selective nucleotides for both SseI and MseI primers produced between 100 and 200 bands depending on the primer combination13. Fol-lowing a simple comparison based on genome size, choice of restriction enzymes and number of selective bases2, the expected number of am-plified fragments for these large-genome species should be much higher. It appears, therefore, that a threshold is reached, with a maximum of 100–150 amplicons being detected, and the number of visible bands being limited by the
concentration of the various components of the PCR reaction. Optimization should there-fore be done empirically with a variety of primer combinations or restriction enzymes.
Different restriction enzymes can affect the number of polymorphisms detected. In barley, for example, more polymorphisms are detected by the PstI/MseI combination than with the EcoRI/MseI combination16, and chi-squared tests revealed that the distribution of markers generated by the two types of enzyme combi-nation was different. In addition, some primer combinations generated more polymorphisms than others and this can be used to optimize the number of bands visualized. Because most plant genomes are AT-rich, use of AT-poor primers can be used to reduce the band complexity in plants with large genomes such as barley8.
Amplification and visualization
Bulk template and PCR mixes can be made in a 96-well format and stored at 2208C until required, at which point a freshly prepared mix of Taq polymerase and primers is added. We have found that restriction and ligation reactions can be carried out at the same time. Visualization is typically achieved by incor-porating 33P or a fluorescent label into the primer corresponding to the rare-cutter prim-ing site (we have found that usprim-ing only half the amount of radioactive label compared to that de-scribed in the original protocol2is sufficient). Research kits for radioactive and fluorescent labelling of AFLP primers are now manufac-tured under license from Keygene n.v. and are available from several companies including Life Technologies (Gaithersburg, MD, USA) and Perkin Elmer (Applied Biosystems Division, Foster City, CA, USA). As an alter-native to radioactive or fluorescent labelling, silver staining can be used to visualize the bands17. In this case17it is possible that MseI/ MseI fragments could be detected. However, we have performed experiments in which the MseI primer is labelled instead of SseI or EcoRI primer, and detected no difference in the banding pattern. These results indicate that MseI/MseI amplicons are relatively rare or that they are amplified to such a low intensity that they are not detected. Good resolution of bands in the range of 50–1000 bp can be achieved through use of Sequagel™ (National Diagnostics, Atlanta, GA, USA).
Special applications and future developments
Bands of interest can be excised from gels that have been dried onto 3MM filter paper (Whatman) or from dried silver stained gels17, and re-hydrated overnight at 48C. The DNA can then be re-amplified with the original primers and used as a probe, for direct se-quencing or for cloning. Also, the AFLP tech-nique can be modified so that one primer is
obtained from a known sequence to detect sequence-specific amplification polymor-phisms (S-SAP). This approach has been used successfully to map Bare-1 transposable el-ements throughout the barley genome18.
Increasingly, AFLP is being used for sev-eral specialist applications to assist the rapid isolation and characterization of interesting genes. AFLP-based mRNA fingerprinting has been used to isolate sequences mapping to deleted chromosome segments in cereals or other species19and cDNA-AFLP has been used to monitor the expression of genes20. AFLP is also being used to screen superpools of plas-mid DNA from 384 clones of bacterial artifi-cial chomosomes (BACs; C. Goldstein and M. Dixon, unpublished), enabling the alignment of contigs and the rapid isolation of genes tightly linked to markers identified through high density mapping. The discriminating power of AFLP has also revealed the cryptic genome changes that could occur in transgenic rice plants generated by particle bombardment or intact cell electroporation21. Analysis of com-plex traits has so far been limited by mapping techniques with a low marker index (MI)22. With AFLP the MI is more suitable, and AFLP has recently been applied to the analy-sis of quantitative traits in barley22and rice23. One of the major limitations of AFLP is the objective difficulty in identifying allelic vari-ants at a specific locus, which has resulted in the technique being used almost exclusively for dominant markers. Recently, however, new software for image analysis of fluorescent PCR products has been developed by several companies including Keygene and Perkin Elmer. This will probably be developed for use with AFLP, which would enable AFLP to be used for scoring semi-dominant markers.
As more maps of a given species are produced by various research groups, methods to integrate the different maps are clearly necessary to ensure that the same marker can be investigated. In a limited comparison within a single laboratory, accurately sized bands were found to be suffi-cient to identify homologous products between six different barley crosses5. The reliability of this approach might be enhanced if more selec-tive nucleotides were included to improve the discrimination of the polymorphic band. Further ambiguity could be eliminated by obtaining the sequence of the band.
In conclusion, AFLP is a robust and reliable technique that has already proved its value in mapping and phylogenetic studies with a range of cereals. Increasingly, the technique is prov-ing invaluable for the analysis of complex traits, for variety identification and for the rapid isolation of important genes. AFLP is rapidly becoming the preferred molecular technique for many types of investigation and will undoubtedly continue to find new appli-cations in many areas of cereals research.
78
trends in plant science
update
Note: The AFLP technique is covered by patents and/or patent applications pending owned by Keygene n.v. Use of the technique for purposes other than research requires a license from Keygene n.v.
References
1 Zabeau, M. and Vos, P. (1993) Selective
restriction fragment amplification: a general method for DNA fingerprinting, European Patent
Application number: 92402629.7, Publication
number 0 534 858 A1
2 Vos, P. et al. (1995) AFLP: a new technique for
DNA fingerprinting, Nucleic Acids Res. 23, 4407–4414
3 Becker, J. et al. (1995) Combined mapping of
AFLP and RFLP markers in barley, Mol. Gen.
Genet. 249, 65–73
4 Mackill, D.J. et al. (1996) Level of
polymorphism and genetic mapping of AFLP markers in rice, Genome 39, 969–977
5 Waugh, R. et al. (1997) Homology of AFLP
products in three mapping populations of barley,
Mol. Gen. Genet. 255, 311–321
6 Zhu, J. et al. (1998) AFLP markers for the study
of rice biodiversity, Theor. Appl. Genet. 96, 602–611
7 Qi, X., Stam, P. and Lindhout, P. (1998) Use of
locus-specific markers to construct a high density map in barley, Theor. Appl. Genet. 96, 376–384
8 Qi, X. and Lindhout, P. (1997) Development of
AFLP markers in barley, Mol. Gen. Genet. 254, 330–336
9 Simons, G. et al. (1997) AFLP-based fine
mapping of the Mlo gene to a 30-kb DNA segment of the barley genome, Genomics 44, 61–70
10 Pakniyat, H. (1997) AFLP variation in wild
barley (Hordeum spontaneum C. Koch) with reference to salt tolerance and associated ecogeography, Genome 40, 332–341
11 Heun, M. et al. (1997) Site of Einkorn wheat
domestication identified by DNA fingerprinting,
Science 278, 1312–1314
12 Schut, J.W., Qi, X. and Stam, P. (1997) Association
between relationship measures based on AFLP markers, pedigree data and morphological traits in barley, Theor. Appl. Genet. 95, 1161–1168
13 Law, J.R. et al. (1998) DNA profiling and
plant variety registration III: the statistical assessment of distinctness in wheat using amplified fragment length polymorphisms,
Euphytica 102, 335–342
14 Jones, C.J. et al. (1997) Reproducibility testing of
RAPD, AFLP and SSR markers in plants by a network of European laboratories, Mol. Breed. 3, 381–390
15 Donini, P. et al. (1997) AFLP fingerprinting
reveals pattern differences between template DNA extracted from different plant organs,
Genome 40, 521–526
16 Powell, W. et al. (1996) Analysis of quantitative
traits in barley by the use of amplified fragment length polymorphisms, Heredity 79, 48–59
17 Cho, Y.G. et al. (1996) Cloning and mapping of
variety-specific rice genomic DNA sequences: amplified fragment length polymorphisms (AFLP) from silver stained polyacrylamide gels,
Genome 39, 373–378
18 Waugh, R. et al. (1997) Genetic distribution of
Bare-1-like retrotransposable elements in the barley genome revealed by sequence-specific amplification polymorphisms (S-SAP), Mol. Gen.
Genet. 253, 687–694
19 Money, T. et al. (1996) AFLP-based mRNA
fingerprinting, Nucleic Acids Res. 24, 2616–2617
20 Bachem, C.W.B. et al. (1996) Visualization of
differential gene expression using a novel method of RNA fingerprinting based on AFLP: Analysis of gene expression during potato tuber expression, Plant J. 9, 745–753
21 Arencibia, A. et al. (1998) Molecular analysis of
the genome of transgenic rice (Oryza sativa L.). Plants produced via particle bombardment or intact cell electroporation, Mol. Breed. 4, 99–109
22 Powell, W. et al. (1996) The comparison of
RFLP, RAPD, AFLP and SSR (microsatellite) markers for germplasm analysis, Mol. Breed. 2, 225–238
23 Nandi, S. et al. (1997) Mapping QTLs for
submergence tolerance in rice by AFLP analysis and selective genotyping, Mol. Gen. Genet. 255, 1–8
24 Breyne, P. et al. (1997) Applications of AFLPTM
in plant breeding, molecular biology and genetics, Belg. J. Bot. 129, 107–117
25 Karp, A., Seberg, O. and Buiatti, M. (1996)
Molecular techniques in the assessment of botanical diversity, Ann. Bot. 78, 143–149
26 Ma, Z.Q. and Lapitan, N.L.V. (1998) A
comparison of amplified and restriction fragment length polymorphism in wheat, Cereal Res.
Commun. 26, 7–13
79
trends in plant science
update
February 1999, Vol. 4, No. 2
Christopher J. Ridout*
Dept of Cereals Research, John Innes Centre, Norwich Research Park, Colney, Norwich, UK NR4 7UH
Paolo Donini
Molecular Biology and Diagnostics Section, National Institute of Agricultural Botany, Huntingdon Road, Cambridge, UK CB3 0LE
*Author for correspondence (e-mail [email protected])
Book reviews in
Trends in Plant Science
Recently published books and CD-ROMs featured in Trends in Plant Science are assessed by experts in the field, providing an open peer-review service to potential purchasers. Authors are encouraged to give background information about the topic being discussed, and to assess the quality of the publication in this context. We also encourage our authors to express their personal viewpoint – as illustrated by the following examples:
‘I found myself continually making notes ...’
‘... conveys a brilliant, up-to-date vision.’
‘... an especially timely book ...’
‘... the book contains glaring scientific and editorial errors.’