A SMALL SCALE MACROECONOMIC MODEL OF
INDONESIA
ENRICO TANUWIDJAJA
NATIONAL UNIVERSITY OF SINGAPORE
A SMALL SCALE MACROECONOMIC MODEL OF
INDONESIA
ENRICO TANUWIDJAJA
(
B.Soc.Sci.(Hons), NUS
)
A THESIS SUBMITTED
FOR THE DEGREE OF MASTER OF SOCIAL SCIENCES
DEPARTMENT OF ECONOMICS
NATIONAL UNIVERSITY OF SINGAPORE
Acknowledgements
“…God’s Grace is sufficient for me, for His power is made perfect in my weakness…and I can do all things through Christ who strengthen me” (2 Corinthians 12:9 and Philippians 4:13)
G
lory be to God, that we know in Jesus Christ, for all the strengths and passions He has bestowed upon me to complete this study. He comforts me in every step of the way for the past two years as I struggle to complete my master’s course and provides me not only with sufficient wisdom, but also with great people to support me. Let this thesis be my humble offering for Him who deserves all the glory.R
ecognition and respect are due to my outstanding supervisors Dr. Choy Keen Meng and Associate Professor Jose Tongzon for lending their expertise to help me in writing this thesis. I am truly blessed to have Dr. Choy to supervise me in the quantitative, modeling, and econometrics-related part of my thesis. He is an excellent macroeconometrician with superb econometric skills and his in-depth analysis has helped me tremendously to improve the quality of my thesis. For all of these, I am truly honoured to be working with him and my utmost gratitude for all the time he spent in advising me and reading through my drafts numerous times. I am also indebted to A/P Jose Tongzon for his kind attention and his valuable feedbacks in the qualitative part of my thesis. Things might not be as complete as of now without his enthusiasm in helping me to understand the economic development in ASEAN and Indonesia, in particular. I will always cherish the time that I have spent with my supervisors, especially all the insightful discussions I had with them. Once again, thank you Dr. Choy and A/P Tongzon!A
ppreciation and my deepest gratefulness are for my family and friends who have given their supports and prayers without fail. To my parents in Jakarta, I want to thank you for the encouragement throughout these years. Your prayers and supports have sustained me and I hope that what I have achieved can bring the confirmation of what a wonderful parents you have been to us. To my angels, Juanita and Maureen, I want to thank the two of you for helping me and comforting me when things were not going smooth, as most of the time they aren’t. In times when the workload seems to be an uphill task and I daunted about my study, you are always there to lend ears and hands. Thank you angels!C
onference participants and organizers for the Xth Spring Meeting of Young Economists, Geneva, Switzerland, are people who I would like to thank as well. I want to express my sincere thank, especially, to Magnus Saxegaard (Nuffield College), Michele Lenza (European Central Bank), Sudip Ranjan Basu (HEI, Geneva) for valuable discussions during the conference. This opportunity has helped me to sharpen the analysis of my thesis and broaden my perspective about economic research as well.Table of Contents
Acknowledgements i
Table of Contents
ii
Summary
vi
List of Tables
vii
List
of
Figures
viii
Chapter 1: Introduction
1
1.1 Motivation for the Study 1
1.2 Organization of Chapters 6
Chapter 2: Macroeconomic Developments of Indonesian
Economy
9
2.1 Overview of the Indonesian Economy: Trends and Developments 9
2.2 The Asian Financial Crisis 21
2.3 Indonesian Macroeconomic Conditions and Developments Post Asian
Financial Crisis 35
2.4 Fiscal Policy in Indonesia 39
2.5 The Conduct of Monetary Policy in Indonesia 42 2.5.1 Monetary Policy Before and During the Financial Crisis 44
2.5.2 The Recent Conduct of Monetary Policy 48
2.6 Summary and Conclusion 59
Chapter 3: Theoretical Foundations of Small Scale Macroeconomic
Models
62
3.1 Overview 63
3.2 Why Small Scale Macroeconomic Model? 67
3.3 The Variants of SSMM 71
3.3.1 Batini-Haldane Model (BH) 72
3.3.2 Small Model of the Australian Macroeconomy 77
3.3.3 Simple Model of the Brazilian Economy 84
3.4 Policy Rules in SSMMs 89
3.4.1 Simple Taylor Rules 90
3.4.2 Forward-Looking Rules 93
Chapter 4: A Small Scale Macroeconomic Model of the Indonesian
Economy
96
4.1 The Bank Indonesia Small Quarterly Macromodel (BI-SQM) 97
4.2 The SSMM for the Indonesian Economy 100
4.3 The Determinants of Inflation in the Indonesian SSMM 108
4.4 Policy Rules for the Indonesian SSMM 111
Chapter 5: Empirical Analysis and Simulation Results
116
5.2 Estimation Methods 119 5.2.1 Single Equation versus System Methods 119 5.2.2 Estimation Methods for Indonesian SSMM 122
5.3 SSMM Estimates 124
5.4 Simulation Methods and Results 132
5.4.1 Deterministic versus Stochastic Simulations 133
5.4.2 Model-Consistent Expectations 134
5.4.3 Solution Algorithms 137
5.4.4 Baseline Simulation Results 139
5.5 Scenario Analysis 144
5.5.1 A Positive Shock in Foreign Income 144
5.5.2 The Role of Credibility in Inflation Targeting 149 5.5.3 Headline or Core Inflation: Which Measure Should Be Used? 152
5.6 Alternative Monetary Policy Rules 158
5.6.1 The Settings of Stochastic Simulations 158
5.6.2 A Quest for Best Monetary Policy Response 159
5.6.3 The Policy Frontier 164
Chapter 6: Summary of Findings and Policy Implications
171
6.1 Summary of the Main Findings 172
6.2 Policy Implications 174
Bibliography 184
Appendix
1
196
Summary
This thesis aims to capture the fundamental structure of the Indonesian economy through the construction and simulation of a small scale macroeconomic model (SSMM). An SSMM is an aggregated model with considerable theoretical content that contains far fewer equations than large-scale macroeconomic models and provides direct analytical solutions. Recently, SSMM has been adopted by countries that target inflation directly, such as New Zealand, Canada, Brazil, the United Kingdom, Sweden, Finland, Australia, and Spain. Thus it is rather timely to devise an SSMM for Indonesia as it is currently moving towards an inflation targeting regime amidst the structural changes that had taken place since the Asian financial crisis.
Chapter 1 will state the motivation behind our thesis and it will be followed by an outline of the thesis. We discuss recent developments in the Indonesian economy, most notably before and after the financial crisis that struck Indonesia in 1997 before we move on with the construction of Indonesian SSMM in Chapter 2. This chapter contains an exposition of the macroeconomic developments in Indonesia with special attention devoted to certain economic variables that play key roles in promoting macroeconomic stability. This chapter is meant to be a narrative analysis of stylized facts. Moreover, this chapter is a building block for modelling the Indonesian economy using an SSMM and provides a background for the simulations in the later part of the thesis. Chapter 3 deals with the review of theoretical foundations for small scale macroeconomic models. Specifically, we will take a closer look at three different small scale models, namely: The Batini-Haldane model for the United Kingdom, the Reserve Bank of Australia model, and Brazilian model. In addition, we will also discuss several types of policy rules that are commonly used to close an SSMM.
List of Tables
Table 2.1 Selected Key Macroeconomic Indicators of Indonesia, 1963-1980 (%) 16 Table 2.2 Selected Key Macroeconomic Indicators of Indonesia, 1981-1986 (%) 19 Table 2.3 Selected Key Macroeconomic Indicators of Indonesia, 1987-1996 (%) 21 Table 2.4 International Claims Held by Indonesian Banks–Distribution by Sectors
and Maturity (in Billions of US Dollars)
25
Table 2.5 Indonesia's Gross Domestic Product Share by Industrial Origin (%) 27 Table 2.6 Current Accounts of Four Southeast Asian Countries (% of GDP) 28 Table 2.7 Government Fiscal Balances of Four Southeast Asian Countries
(% of GDP)
28
Table 2.8 Share of Indonesian Exports to Selected Countries, 1991-1997 (%) 29 Table 2.9 International Claims Held by Indonesian and Thailand
Banks-Distribution by Country of Origin (Billions of US Dollars)
30
Table 2.10 Key Macroeconomic Variables of the Indonesian Economy: Crisis and Post-Crisis Periods, 1997-2001 (%)
36
Table 5.1 Estimation Results of the IS Equation 124
Table 5.2 Estimation Results of the Oil Equation 125
Table 5.3 Estimation Results of the LM Equation 125
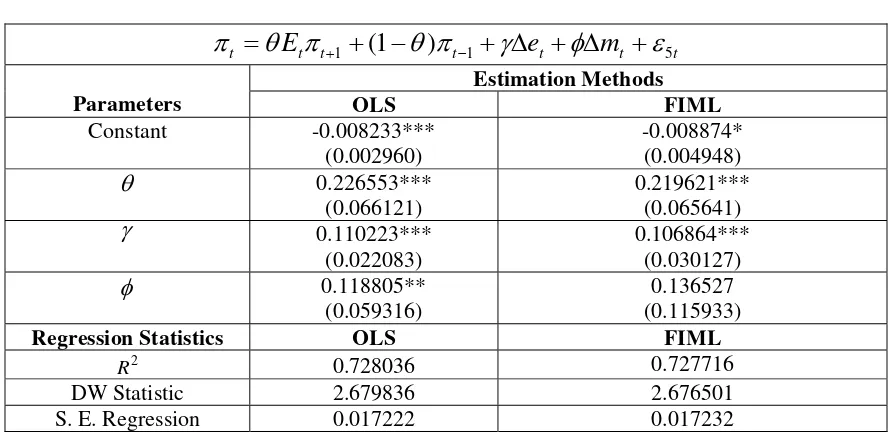
Table 5.4 Estimation Results of the Inflation Equation 126
Table 5.5 Estimation Results of the Taylor Rule 126
Table 5.6 Components of CPI and Volatilities 153
Table 5.7 Output Gap and Inflation Volatilities 163
Table DA.1 Variable Description 200
Table DA.2 Augmented Dickey-Fuller Unit-Root Tests 200
List of Figures
Figure 4.1 Flowchart of the Determinants of Inflation in Indonesian SSMM 110
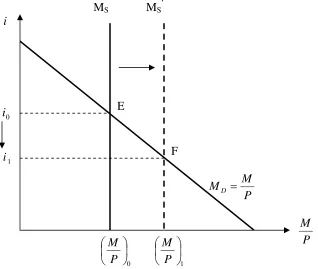
Figure 4.2 Relationship between Nominal Interest Rate and Money Supply 113
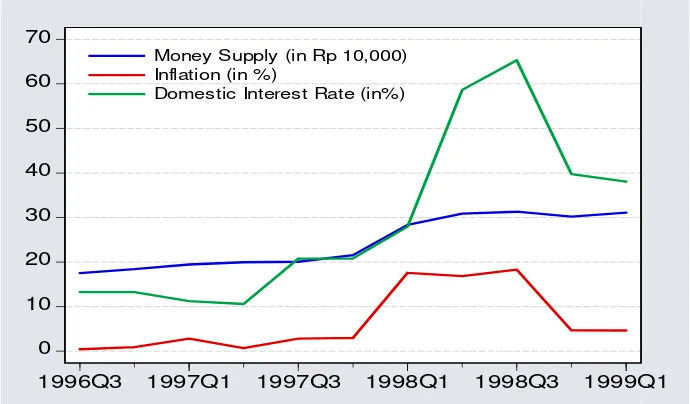
Figure 5.1 Relationships between Money Supply, Inflation and the Interest Rate 130
Figure 5.2 Baseline Simulation Results (Endogenous Variable: Total Output) 140
Figure 5.3 Baseline Simulation Results (Endogenous Variable: Non Oil Output) 141
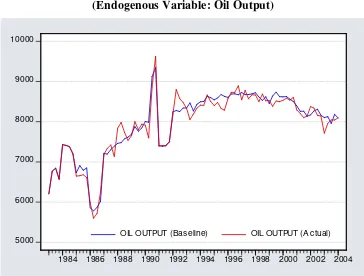
Figure 5.4 Baseline Simulation Results (Endogenous Variable: Oil Output) 141
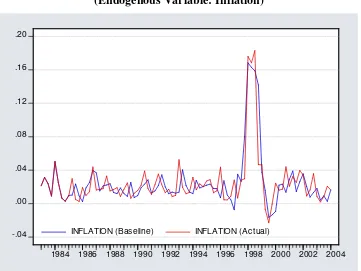
Figure 5.5 Baseline Simulation Results (Endogenous Variable: Inflation) 142
Figure 5.6 Baseline Simulation Results (Endogenous Variable: Money Supply) 142
Figure 5.7 Baseline Simulation Results (Endogenous Variable: Exchange Rate) 143
Figure 5.8 Baseline Simulation Results (Endogenous Variable: Domestic Interest Rate) 143
Figure 5.9 Effect from a 10% Increase in Foreign Income on Total Output 145
Figure 5.10 Effect from a 10% Increase in Foreign Income on Money Supply 146
Figure 5.11 Effect from a 10% Increase in Foreign Income on Interest Rate 146
Figure 5.12 Effect from a 10% Increase in Foreign Income on Exchange Rate 147
Figure 5.13 Effect from a 10% Increase in Foreign Income on Inflation 147
Figure 5.14 Effects of Central Bank Credibility in Achieving Inflation Target 150
Figure 5.16 Effect from a 10% Temporary Increase in Domestic Price on Interest Rate 157
Figure 5.17 Effect from a 10% Temporary Increase in Domestic Price on Output Gap 157
Figure 5.18 Comparison of Monetary Policy Rules 162
Figure 5.19 Policy Frontiers for the Taylor Rule (Without Exchange Rate) 166
Figure 5.20 Policy Frontiers for the Taylor Rule (With Exchange Rate) 166
Figure DA.1 Interpolation of Oil Output 199
Chapter 1
Introduction
A vessel of 1,919,440 sq km in size began sailing in the year 1945 with an inspiring hope to reach the
dream land called “Prosperity”. It went through some good and bad experiences along the way until it
faced a very heavy storm fifty two years later. The storm had struck the vessel and caused heavy damage to it. The vessel’s experts argued that it was because of the vessel’s weak and frail fundamental structure such that it was unable to withstand the heavy storm, while some other specialists argued that the storm was too heavy for the vessel to held back, since other vessels nearby experienced the same thunderstorm and collapsed, though a few did not. Years after, some repairs have been made and the vessel continues to sail to reach the dreamland. It has been eight years now but still the fears and doubts of whether the structure of the vessel has regained its strength remain. All the experienced experts of the vessel still argue intensely about this matter, until somebody from the vessel asks: “Where are we now? What reasonable speed should we take to reach our destination?”... He then paused a while before asking: “where is the dreamland and how to get there?”... The vessel is called … Indonesia.
1.1
Motivation for the Study
After the inception of the so-called “new order” regime under the leadership of Soeharto in 1967, Indonesia began to experience a period of sustained economic growth and expansion in several sectors of the economy. Not long after, this “sweet dream” of marvelous economic growth for around three decades was followed by a sudden economic crisis that was sparked off by the Asian financial crisis of 1997. This significant incident has created major structural changes for the Indonesian economy, leading the country to undergo several major policies changes in the areas of the exchange rate system, debt restructuring, tighter bank regulation, and inflation targeting mechanisms and policies, inter alia.
The anecdote at the beginning of the chapter might be just a glimpse about the situation that is currently faced by Indonesia. Hill (1999) depicts this situation in his own words: “… Indonesia is in deep crisis. A country that achieved decades of rapid growth, stability, and poverty reduction, is now near economic collapse … no country in recent
history, let alone one the size of Indonesia, has ever suffered such a dramatic reversal of
discussions were focused on the causes of this crisis in Asian countries. We will not pursue further the causes of the financial crisis in this thesis—although quite a detailed summary will be provided in chapter 2—since there has been a large literature discussing this matter thoroughly (see for example: Hill 1999; Mann 1998; Sadli 1999; McLeod 1997a; Radelet and Sachs 1998a,b; Iriana and Sjoholm 2001).
the transmission of policy actions to key variables such as output and inflation while policy exercises using an SSMM can function as a cross-check on the results of simulations from larger and more sophisticated macroeconometric models developed by the central bank and other researchers (for example, Fukuchi 1968; Wang 1983; Kobayashi et al 1985; Simatupang 1986; Kuribayashi 1987; Azis 1988, 1990; Bautista et al 2001) or vector autoregression (VAR) models (for example, Siregar and Ward 2002). To sum up, an SSMM is often small enough to allow its key properties to be investigated analytically and thus it provides powerful insights with a relatively less complicated structure.
Concerning the economic literature that deals with the Indonesian economy, there are some macroeconomic models that focus on the dynamic simulation of the economy given external shocks, with special attention being devoted to trade sector analysis (Azis and Ekawati 1990). However, some of the research on large-scale macroeconomic models has been rendered outdated by time and data limitations.1 Other researchers have dwelled on analyzing the behavior of the Indonesian macroeconomy by studying the importance of aggregate demand versus aggregate supply shocks (Siregar and Ward 2002) and the importance of exchange rate mechanisms and inflation targeting in Indonesia (Siregar 1999).
The specific objectives of this thesis are to estimate an SSMM for Indonesia and to discuss its empirical findings; to understand some important macroeconomic factors affecting the Indonesian economy; and to identify key policy vehicles that can play a
central role in sustaining non-inflationary economic growth. The focus will be on the formulation and implementation of monetary policy by the central bank—Bank Indonesia (BI). Examples of the ultimate objectives of such policy are exchange rate targeting, inflation-targeting, output-targeting, or combinations of these targets, to be achieved through interest rate or money supply instruments. Towards this end, several dynamic simulations of the economy will be conducted to investigate the effects of external shocks on the Indonesian economy, such as a positive shock in external demand. We will also examine the role of credibility in central bank policymaking and also in its choice of inflation target. Different policy rules will be analyzed with the aim of obtaining the best policy responses. The outcomes based on both deterministic and stochastic simulations will be assessed in order to fully understand the macroeconomic dynamic of the Indonesian economy and recommend ways to achieve non-inflationary economic growth and macroeconomic stabilization.
1.2 Organization of Chapters
We will begin this thesis by providing a comprehensive summary of the major macroeconomic features of Indonesia along with recent developments in Chapter 2. Specifically, this chapter will discuss three major milestones affecting the Indonesian economy, namely, the primary oil boom from 1963 to 1980, the economic slowdown period in conjunction with global recession from 1981 to 1986, and the secondary boom due to economic recovery that was boosted by the surge in non-oil manufacturing exports that resulted from the FDI boom during 1987 to 1996. In addition to that, we will also discuss the impact on and significance of the Asian financial crisis in 1997 and 1998 to Indonesia. We will point out several major events since the occurrence of Asian financial crisis that has led Indonesia to experience policies reform.
This discussion is necessary since it provides crucial background for the rest of the study. In essence, we will argue that it was weak macroeconomic fundamentals that were responsible for the economic turmoil during the Asian financial crisis as opposed to the alternative view that argued for contagion effects across ASEAN economies. Our view leads us naturally to the construction and simulation of an SSMM so as to capture the inter-relationships between key macroeconomic variables and, based on that, to suggest measures to bring about improvements through appropriate policy responses.
respective merits and suitability for modeling the Indonesian economy. We will pay particular attention to the Batini-Haldane (1999) model that has been developed at the Bank of England and used recently in several countries such as Brazil and Venezuela. The model embodies forward-looking expectations of rational agents in the economy, which is preferable because they are solved using model-consistent rational expectations and hence immune to the Lucas critique. We will then supplement the discussion of the Batini-Haldane (1999) model with alternative monetary policy rules such as the Taylor (1993) and McCallum (1988) rules.
Modelling the Indonesian economy using the small scale macroeconomic model will be the main focus of Chapter 4. In particular, this chapter will deal with the modification of the theoretical model (i.e. the Batini-Haldane model) to suit Indonesia’s macroeconomic structure and circumstances. We will also review Bank Indonesia’s small macroeconomic model, the BI-SQM, in this chapter. Furthermore, we have a subsection that deals with the inflation transmission mechanism in Indonesia in view of the emergence of an inflation-targeting regime in Indonesia recently. This is followed by a detailed discussion of Indonesian monetary policy before and after the Asian financial crisis that serves as a prelude to the specification of monetary policy rules in the Indonesian SSMM.
the data in the Data Appendix. The main purpose of Chapter 5 is to analyze and interpret the estimation and simulation results from the Indonesian SSMM. After estimating the model, we construct a baseline scenario for the Indonesian macroeconomy prior to conducting economic scenario analysis and policy simulations. We then study the monetary policy transmission mechanism through the simulation exercises with an aim to understand better how to achieve sustained non-inflationary economic growth in Indonesia with prudent and effective macroeconomic stabilization policies. Our investigations will use the baseline scenario as a benchmark against which the simulated scenarios will be compared.
Chapter 2
Macroeconomic Developments of Indonesian Economy
This chapter contains an exposition of the macroeconomic developments of Indonesia with special attention devoted to certain economic variables that play key roles in promoting macroeconomic stability. This chapter is meant to be a narrative analysis of stylized facts. Moreover, this chapter is a building block for modelling the Indonesian economy using an SSMM and provides a background for the simulations in the later part of the thesis. It will begin by giving a brief overview of the Indonesian economy, and continues with a concise, but detailed, discussion of stylized facts regarding the Asian financial crisis and its impact on Indonesia. The discussion has shown that the frail macroeconomic fundamental of the Indonesian economy is the one responsible for the collapse of the economy vis-à-vis the Asian financial crisis as opposed to the alternative view of the “contagion” effect. Consequently, this result will support further our analysis by providing an understanding about the key macroeconomic variables that are prone to similar shocks in the future. Finally we will conclude by outlining a brief analysis and insights regarding key macroeconomic variables in relation with the recent conduct of monetary and fiscal policy.
2.1
Overview of the Indonesian Economy: Trends and Developments
economic progress achieved by Indonesia during the 1970s and 1980s (see, for example, Booth 1981, 1986; Gillis 1984, 1988, Sundrum 1980; Warr 1986). This process of development has been studied thoroughly and intensely by economists and policy-makers in the international forum, which recognized Indonesia as one of the High Performing Asian Economies (HPAE) as coined by the World Bank. Tongzon (2002), in the second edition of his book, gives a number of important insights regarding the economies of ASEAN countries, their developments, and future challenges. In particular, we would like to draw on some crucial points and to tap into the insights in his book regarding the Indonesian economy in the following exposition.
Indonesia is basically a market-based economy, just like most of the ASEAN1 economies, with prominent state intervention in several major sectors (e.g. provision of public roads, highways, public schools and state-funded universities, electricity services, etc). Secondly, Indonesia’s trade performance is worthy of emphasis since it is highly comparable to the rest of the Asian Tigers in terms of export-led performance.2 In the 1960s up to 1980s Indonesia experienced an average export growth of 7.6680%. Subsequently, the export growth rate surge up to an average of 9% from the middle of 1980s to the middle of 1990s. Her export-oriented economy has provided strong evidence for the proposition of export-led growth as shown by the high volume of trade and especially the high degree of export-import dependence3. Jung and Marshall (1985) and
1
ASEAN currently consists of Singapore, Indonesia, Malaysia, Thailand, The Philippines, Vietnam, Brunei Darussalam, Cambodia, Laos, and Myanmar.
2
Asian Tigers refer to the Asian countries that have achieved a remarkable economic growth and performance over this last decade or so, such as Singapore, Malaysia, Hong Kong, South Korea, and Taiwan.
3
Bahmani-Oskooee et al (1991) found supporting evidence for the export-led growth hypothesis in Indonesia. The former found that only Indonesia, Egypt, Costa Rica, and Ecuador pass the Granger causality test from export growth to output growth, suggesting evidence in favour of export promotion in Indonesia. However, we note that Jung and Marshall (1985) did not include East Asian NICs that include countries with notable export promotion strategy such as Hong Kong and Singapore, thus in that regard Indonesia’s export performance was not able to be compared side by side with them. Nevertheless, we know that the Indonesian economy, especially with respect to trade, is not as open as Hong Kong or Singapore. Bahmani-Oskooee et al (1991) uses improved methodology of Granger’s causality test with Akaike’s Final Prediction Error (FPE) criterion to overcome shortcomings found in Jung and Marshall (1985) and they also found evidence of causality from export growth to output growth, but not vice versa.
Thirdly, the economic aspirations of Indonesia are heavily centred on the importance of enhancing economic growth since Indonesia has a substantial history of poverty, under-provision in the labour market, and under-development in major social and economic sectors. Lastly, the Indonesian economy is of the dualistic type whereby more than 60% of the population live in the agricultural and rural areas with the rest of the population living in the major cities.
large domestic market and an extensive period of political stability, most notably during the mid 1970s to mid 1990s, as well as impressive economic development and expansion during the Soeharto regime have attracted foreign and domestic investments in sectors like manufacturing, services, and financial industries.
The strengths of the Indonesian economy are not without its weaknesses. The main drawback is the low level of efficiency in the bureaucracy and the quality of the rural and suburban basic infrastructures. Although it will not be discussed at all in this thesis, political stability is one vocal point worth noting as an important ingredient to ensure the sustainability of economic development. This is especially the case after the fall of Soeharto’s new order regime in 1998, whereby a number of domestic disputes and incidents remained unsolved, such as the Aceh Freedom Movement (Gerakan Aceh Merdeka (GAM)), incidents in Ambon and Maluku, and the recent Bali bombings amongst others. Thus, they expose the country to some unfavourable effects in promoting economic stability and sustained growth.
From the 1970s onwards, Indonesia faced a major economic problem, namely the persistence of high inflation rates, mainly caused by lack of financial discipline, and perhaps coordination, from both the central bank and ministry of finance, reaching their peak during the oil-induced economic boom in 19744. Within this decade, major monetary and fiscal policies were directed to fight inflation and they have proven to work
4
successfully and effectively. Some studies have also been conducted to analyze the performance of the Indonesian economy such as Aghevli (1977), Aghevli et al (1979), Arndt (1979), Nasution (1983), Gillis (1984), Parikh et al (1985), Warr (1986), and Sundrum (1986, 1988) in the areas of macroeconomic development, monetary sector, financial institutions, as well as fiscal and monetary policies.
structural changes, the share of agriculture in the economy has fallen steadily from 42.0% to a mere 23.4% in early 1990 whereas the industrial and services sectors have recorded substantial increments from 21.6% and 36.4% to 36.8% and 39.8% respectively. During the time period of 1970–1990, Indonesia has witnessed a vast recovery and rapid economic growth and this time period up to the early 1990 can be viewed as the resurgence of the Indonesian economy after her independence.
The development process and progress of the Indonesian economy during the period of 1970-1995 can be divided into three major time frames. This is done to provide comprehensive descriptions of the major economic milestones of the economy. The period after 1995 will be discussed separately and can be considered as the most recent development of the Indonesia economy that involves numerous dynamic adjustments and structural changes such as the notable incident of the Asian financial crisis in 1997.
The resurgence of the Indonesian economy and the primary oil boom (1963-1980)
despite falling exports and access to hard currency causing hyperinflation, coupled with economic stagnation5.
The resurgence in the economy began with the inception of the so-called “new-order” regime under Soeharto’s leadership with the well-known and successful Five Year Development Plan (REPELITA: Rencana Pembangunan Lima Tahun) which started in the year of 1968. During this period and subsequently, Indonesia has shown a remarkable improvement in economic growth, a substantial reduction in the inflation rate, and job creation in several sectors of the economy. Export-led growth was identified as the main source of this magnificent increase in the country’s economic performance along with the voluminous amount of foreign aid received from 1970 to 1972 (Kokko 2002). Moreover, the first oil shock from 1973 to 1974 which was followed by the second one from 1979 to 1981 have enabled Indonesia to experience strong and improved macroeconomic performance as well as her remarkable trade activities. This was because Indonesia was a net oil exporter country and enjoyed great benefits from hikes in oil price and moreover, during that period, some concerted efforts have been made by the Organization of Petroleum Exporting Countries (OPEC) to sustain a reasonably high oil price.
5
Table 2.1 Selected Key Macroeconomic Indicators of Indonesia, 1963-1980 (%)
Year Real GDP Growth Inflation Rate GDP Per Capita Growth Nominal Exports Growth
1963 -2.25 145.91 -4.33 -6.23
1964 3.45 108 1.21 11.83
1965 0.95 306.76 -1.28 -3.60
1966 2.85 1136.25 0.54 -1.26
1967 1.13 106 -1.18 0.36
1968 12.03 128.84 9.45 9.98
1969 7.48 15.52 4.97 14.85
1970 8.15 12.35 5.61 17.10
1971 6.70 4.36 4.46 15.71
1972 7.88 6.51 5.28 21.21
1973 9.78 31.04 7.13 18.64
1974 8.26 40.60 5.67 6.56
1975 6.18 19.05 3.71 -2.42
1976 5.60 19.86 3.40 17.02
1977 8.64 11.04 6.14 9.45
1978 9.21 8.11 6.82 1
1979 7.10 16.26 4.84 2.29
1980 8.73 18.02 6.50 5.53
Average 6.25 118.64 3.83 7.67
Source: World Development Indicators CD ROM (World Bank, 2004)
Consequently, this increase in the oil revenue has benefited the whole economy during that period. In addition to that, the export of Liquefied Natural Gas (LNG) starting from the year 1977 boosted the economic performance of Indonesia even further.
Economic slowdown and global recession (1981-1986)
The fall in oil prices and increasing current account deficits ushered Indonesia into a period of economic slowdown beginning from the early 1980s. The GDP growth figure dropped considerably during this period and was falling behind other Asian countries. The global recession in the early 1980s was acknowledged as the main cause of this slow economic growth. Both domestic and foreign investments fell during this period and government expenditures on large capital intensive projects were also reduced as a response to lower oil revenues —the major source of income for the economy. Export earnings fell and the volume of debts increased in response to higher world interest rates during this tough economic period for the global economy and in particular, for Indonesian economy.
realigning the exchange rate system in order to maintain Indonesia’s competitiveness in the trade sectors.
Table 2.2 Selected Key Macroeconomic Indicators of Indonesia, 1981-1986 (%)
Year Real GDP Growth Inflation Rate Current Account (% of GDP) Nominal Export Growth
1981 8.15 9.48 -0.61 -18.05
1982 1.1 11.79 -5.62 -9.0
1983 8.45 10.46 -7.42 1.65
1984 7.17 4.73 -2.09 6.55
1985 3.48 5.83 -2.17 -7.80
1986 5.96 9.28 -4.67 15.21
Average 5.72 8.60 -3.76 -1.91
Source: World Development Indicators CD ROM (World Bank, 2004)
Table 2.2 shows that GDP growth fell substantially to 1.1% in 1982 as the world entered into global recession. Inflation soared into double digits in 1982 and 1983 to record 11.79% and 10.46% respectively. The current account deficits widened in this time of recession and export growth shrunk considerably by 18% and 9% in the early 1980s. The second major devaluation of the exchange rate in 1983 did help Indonesia to record a substantial GDP growth of 8.45% which is comparable to the level of sustained growth and subsequently inflation was brought down to around 4.8% in 1984. Export growth also showed signs of recovery near the end of this second milestone to record 15% growth.
The secondary boom: non-oil recovery period and non-oil export revival (1987-1996)
domestic exports growth. The falling trend of oil price stabilized in 19866 and most economies started to realign its major policies and expenditures programs in this period as well. Indonesia also conducted her third major devaluation in 1986 whereby the government allowed the Rupiah to depreciate far more rapidly than before by letting the money supply growth rate to increase. This policy, however, resulted in a lower inflation rate than the previous period which might be explained by the resurgence in the non-oil exports that was boosted by devalued currency, a relatively small decline in fiscal expenditures, and the price controls imposed by the government on several key commodities and services.
Agriculture, the sector that has always contributes significantly to Indonesia’s economy, was superseded by the manufacturing production sectors that recorded an excellent real growth during this period from 1991 as shown by Table 2.3. Investments, domestically and from abroad, regained its momentum by comprising almost one third of the aggregate demand elements (van der Meulen Rodgers, 1994). This fact can be seen from Table 2.3 whereby manufacturing value-added as a percentage of GDP has outpaced agricultural value-added most notably from 1991 onwards. The manufacturing sector recorded a quarter’s share of GDP in 1996 whereas agriculture sector only recorded around 16% of GDP as compared to almost 23% in the early 1990s. Both GDP growth and inflation rates were more stable during this period although the inflation rate was still considered high. Perhaps at that point in time, the goal of the authorities was to keep inflation from recording double digits. The current account deficits have been relatively stable at around 1–3% of GDP over the years. Exports growth showed double
digit growth occasionally in 1987, 1991, and 1992, with the rest of the years showing a relatively stable, but lower, rate of export growth.
Table 2.3 Selected Key Macroeconomic Indicators of Indonesia, 1987-1996 (%)
Year Real GDP Growth Inflation Rate Current Account (% of GDP) Nominal Export Growth
1987 5.30 9.28 -2.66 14.62
1988 6.36 8.04 -1.57 1.05
1989 9.08 6.42 -1.09 6.74
1990 9.0 7.81 -2.61 3.36
1991 8.93 9.41 -3.32 18.78
1992 7.22 7.53 -1.10 13.71
1993 7.25 9.68 -1.33 6.11
1994 7.54 8.52 -1.58 9.94
1995 8.40 9.43 -3.18 7.72
1996 7.64 7.97 -3.37 7.56
Average 7.67 8.41 -2.27 8.96
Source: World Development Indicators CD ROM (World Bank, 2004)
Year Agriculture Value-Added Manufacturing Value-Added
1987 22.48 16.33
1988 22.48 19.70
1989 22.02 17.02
1990 20.42 18.30
1991 12.79 14.21
1992 17.45 19.08
1993 17.88 22.30
1994 17.29 23.35
1995 17.14 24.13
1996 16.67 25.62
Average 18.66 20
Source: World Development Indicators CD ROM (World Bank, 2004)
2.2
The Asian Financial Crisis
pointed out that there were threats of economic overheating by the second half of 1995. Factors such as rising inflation, massive capital inflows from foreign investors that were used to finance property purchases in the face of a significant jump in residential and commercial property demand, and a widening current account deficit contribute to the fear of overheating. Massive capital inflows triggered property developers in Indonesia to borrow money from abroad and mostly denominated in US dollars which was stable at that time. Some sceptics argued that the inflation rate in Indonesia was still in an acceptable rate of 2.3%, which cast doubt on the overheating of the economy.
In addition to that, the widening current account deficit is not in itself a threat to economic stability and thus alleviates any possible danger of overheating that will lead to economic collapse. This is exactly the case for Indonesia since she believed that the economy was being driven by excess investment over national savings and the attraction of foreign capital to Indonesia was not used to finance the current account deficit per se
Manning and Jayasuriya (1996) argued that there are two factors underpinning fears of overheating. First, private capital movements have replaced public capital utilization to play a much larger role. This means that the most likely source of any major external shocks would be from the capital account given the volatility of short-term private capital flows. Second, the source of fluctuations in the capital account is none other than the ever-changing political climate in Indonesia. Speculations and political uncertainty were very pervasive in Indonesia and thus made Indonesia very vulnerable to any destabilizing capital movements due to the loss of investors’ confidence.
However, the attention which has not been paid enough by the authorities to the indications shown by the economy rendered Indonesia into the Asian Financial Crisis that occurred in 1997 that was initiated by the depreciation of Thai Baht. The high private sector capital outflow has caused many banks and firms to collapse, resulting into many non-performing loans (NPLs) since they were not able to clear most of the loans they made. This adverse condition necessitated the Indonesian central bank (BI) to bail out banks in order to restore people’s trust and investors’ confidence. Consequently, it meant a depletion of Indonesia’s foreign reserves and indicated that major portions of capital inflows were used to finance current account deficits and only minor parts were being accumulated as foreign reserves.
somehow overlooked that the 1998 presidential election was a critical point for the Indonesian economy that will heighten the level of foreign investors’ awareness and cautions.
The widening of current account deficits was argued mainly because of faulty interpretation of crude trade data (Manning and Jayasuriya 1996). Yet, if that was the case, should it not be the reason and concern for an even more alarming danger of economic collapse that was heading on Indonesian way? At least, this should prompt the officials to study carefully the most credible data to avoid any misinterpretation, especially concerning high and short-term capital flows. The reason was that there might be a high possibility that projected investments as well as exports-imports flow data that are used in order to record any trade balance in the current account and this projected investments and exports-imports were sometimes overestimated. This only available information was perceived to be the actual scenario and given only this kind of projected
information; it is rather straightforward for the investors to question the soundness of their investment returns and for analysts to point out that there were alarming dangers of economic downturn.
Indonesia’s crisis in 1997 began with massive capital outflows from the country7. This massive capital outflows eventually brought about the collapse of the Indonesian Rupiah. In the beginning of the crisis, July 1997, the Rupiah depreciated by 7%. Then finally on 14 August 1997, the Rupiah was floated and marked the end of a long history
7
of crawling peg exchange rate system. We are going to discuss two fundamental reasons behind the financial crisis that led to economic downturn in Indonesia, namely the over-reliance on short-term borrowing (Pincus and Ramli 2001) and the second is the contagion effect8. To discuss the first reason, we will start by looking at the structure of foreign debt owed by Indonesian domestic banks and private corporations in 1995 until the period before the crisis in the middle of 1997.
Table 2.4 International Claims Held by Indonesian Banks – Distribution by Sectors and Maturity (in Billions of US Dollars)
Period Total Outstanding Obligation by Sector Debts and Reserves
Banks Public Sector
Non-Bank Private
Short
Term Reserves
Short Term/ Reserve
End 1995 44.5 8.9 6.7 28.8 27.6 14.7 1.9
End 1996 55.5 11.7 6.9 36.8 34.2 19.3 1.8
Mid 1997 58.7 12.4 6.5 39.7 34.7 20.3 1.7
Note: the data excludes offshore issues of commercial paper and other non-bank liabilities. Source: Bank for International Settlements (1998).
Table 2.4 shows that there was a sharp increase in foreign borrowing with significant increases in the short-term debt borrowed by private firms and banks from the end of 1995 up to the middle of 1997. The short-term debt held by the public sector remained relatively stable. These massive capital inflows (foreign borrowing) were caused by several factors amongst which we will elaborate on three important ones9. First, the liberalization in the banking and financial sector adopted by the Indonesian government
8
Contagion is defined here as the spread of economic difficulties across countries and often manifest itself as a co-movement of, for instance, exchange rates (World Bank 2000).
9
in the early 1990s have paved the way for firms and domestic corporations to seek access to the foreign capital. Second, the deregulation in the banking and financial sector was not accompanied by adequate supervision from the authorities, thus creating an environment conducive to high rates of short-term borrowing as it allowed banks to take on sizeable foreign currency and maturity risks. Third, low interest rates in Japan have induced outward investment from this country to Indonesia in particular and to other Southeast Asian countries in general10.
The increase in short-term debt was particularly significant since it exceeded foreign reserves.11 In fact short-term debt in excess of reserves does not necessarily cause a crisis. However, it renders a country vulnerable to a financial panic.12 Relatively speaking, countries with large foreign exchange reserves compared to short-term debt are much less vulnerable to a panic, since each creditor can be assured that sufficient funds are available to meet his claims (Radelet and Sachs 1998b). Hence, the fact that pre-crisis Indonesia’s short-term debt to foreign reserves ratio exceeded 1 as shown in Table 2.4 made the country vulnerable to a financial panic.
Apart from the fact that Indonesia’s short-term debt exceeded its foreign reserves, the underlying problem with this massive short-term debt is that apparently most of it was
10 The main factor that drove the Japanese banks into heavy lending to Indonesia and other Southeast Asian
countries was the existence of relatively higher interest rate in these countries. The low interest rate in Japan was due to its fragile banking sector, which was affected by the burst out of the 1980’s asset bubble and weakened by its stagnant economy in the 1990s.
11
Note that the actual amount of Indonesia’s short-term debt borrowing would be even larger if offshore issues of commercial paper and other non-banks liabilities were included.
12
used to finance speculative and unhedged investments in real estate markets (or other non-traded goods) rather than being used to increase productive capacity for manufactured exports (traded goods) as in the earlier periods.
Table 2.5 Indonesia's Gross Domestic Product Share by Industrial Origin (%)
Item Share 1985 1995
GDP 100.0 100.0
GDP (non petroleum) 78.7 91.3
Traded sector 40.2 38.9
Non-traded sector 59.8 61.1
Note: traded sector includes non-food crops, forestry and fishery, mining and quarrying, manufacturing industries.
Non-traded sectors includes farm food crops; livestock and products; electricity, gas and water supply; construction; trade, hotel and restaurant.
Sources: Centre Bureau of Statistics, Economic Indicators (various issues).
Table 2.5 shows that Indonesia’s GDP share of traded goods decreased from 40.2 % in 1985 to 38.9 % in 1995 while the share on non-traded goods increased from 59.8 % in 1985 to 61.1 % in 1995. Although the figures reflect a relatively small change in the GDP share on traded goods to non-traded goods, Radelet and Sachs (1998b) suggested that it probably understated the true amount as firms apparently diverted their own working capital and other loans towards real estate investments.
short-term debt was unhedged. This was partly due to the historical nature of predictable and low rate of the Rupiah appreciation (Nasution 1999) and due to similar reasons that encouraged capital inflows into Indonesia that were mentioned earlier.
A second factor that caused the crisis was the contagion effect from the region. According to Radelet and Sachs (1998b), Indonesia appears to be the clearest case of contagion in the region. Their argument was that, though it was true that there were many problems and weakness in the Indonesia economy before the crisis, yet by most measures13, Indonesia’s imbalances were among the least severe in the region. These can be seen in Table 2.6 and Table 2.7.
Table 2.6 Current Accounts of Four Southeast Asian Countries (% of GDP)
Note: current account used here is based on NIA Definition.
Source: International Financial Statistics of the International Monetary Fund.
Table 2.7 Government Fiscal Balances of Four Southeast Asian Countries (% of GDP)
Countries 1990 1991 1992 1993 1994 1995 1996 1997
Indonesia 0.43 0.45 -0.44 0.64 1.03 2.44 1.26 0.00
Malaysia -3.10 -2.10 -0.89 0.23 2.44 0.89 0.76 2.52
Philippines -3.47 -2.10 -1.16 -1.46 1.04 0.57 0.28 0.06
Thailand 4.59 4.79 2.90 2.13 1.89 2.94 0.97 -0.32
Sources: International Financial Statistics of the International Monetary Fund.
13
Most measures are defined here as the usual few macroeconomic statistics which are regarded as relevant to measure the economic fundamentals of a country, such as the size and the rate of growth of current account deficits, and government fiscal balances (Radelet and Sachs 1998b).
Countries 1990 1991 1992 1993 1994 1995 1996 1997 Indonesia -4.40 -4.40 -2.46 -0.82 -1.54 -4.27 -3.30 -3.62 Malaysia -2.27 -14.01 -3.39 -10.11 -6.60 -8.85 -3.73 -3.50 Philippines -6.30 -2.46 -3.17 -6.69 -3.74 -5.06 -4.67 -6.07
From Table 2.6, we can see that Indonesia’s current account deficits in 1996-1997, at an average of 3.5 %, was the lowest as compared to the other three countries and from Table 2.7, we can see that Indonesia’s budget had been in surplus by an average of over 1% of GDP for four years.
In analyzing Radelet and Sachs’ argument, Jap (2003) started by looking at the contagion factors that suggested the most prominent contagion effect came from the Baht crisis and the weakening Japanese economy. The Baht crisis started on 2 July 1997 with floating of the exchange rate and spread quickly to Indonesia, Malaysia, and the Philippines (Hill 1999). The two possible transmission mechanisms for the spread of the Thailand crisis into Indonesia were, firstly, by means of trade links. The crisis in Thailand might spread into Indonesia if the declining economic activity and imports in Thailand decrease Indonesia’s exports. However this possibility seems implausible since the merchandise trade connections between Indonesia and Thailand are quite weak compared with Indonesia’s exports to Japan and U.S., as shown by Table 2.8.
Table 2.8 Share of Indonesian Exports to Selected Countries, 1991-1997 (%)
Period Thailand USA Japan
1991-1995 1 14 31
1996 2 14 26
1997 2 14 24
Source: Direction of Trade Statistics Yearbook, IMF (1998).
besides trade links, different countries are interdependent if they borrow from the same creditors. It seems this was the case for Thailand and Indonesia as these two countries borrowed mainly from the same creditors, which was Japan. This is shown in Table 2.9 whereby both Indonesia and Thailand borrowed substantially from Japan with the highest share of claim amounted to 47%, 40%, and 40% for Indonesia and 58%, 60%, and 54% for Thailand during 1995, 1996, and 1997 respectively.
Table 2.9 International Claims Held by Indonesian and Thailand Banks–Distribution by Country of Origin (Billions of US Dollars)
Country/ Period
Total Outstanding
Claims Held by Banks From
Japan USA Germany All Others
Indonesia
End 1995 44.5 21.0 2.8 3.9 16.8
End 1996 55.5 22.0 5.3 5.5 22.7
Mid 1997 58.7 23.2 4.6 5.6 25.3
Thailand
End 1995 62.8 36.9 4.1 5.0 16.8
End 1996 70.2 37.5 5.0 6.9 20.8
End 1997 69.4 37.7 4.0 7.6 20.1
Source: Bank for International Settlements (1998).
So it seems likely that the Thai contagion effect spread to Indonesia through capital accounts and not by the mean of trade links as has also been discussed by Hill (1999).
to maintain its currency parity against the US dollar despite strong speculative attacks14, while Singapore15 and Taiwan opted to float their currencies rather than lose their reserves in an attempt to stabilize the exchange rate. The depreciation rate of both the Singapore and Taiwan currencies was about 18% over the year. This figure was well below that in Indonesia, Malaysia and the Philippines whose depreciation rates were 151%, 52% and 52% respectively (Corsetti et al. 1998a). We will not pursue further such cross-country comparisons since it is not of a particular interest of this research. However, it is worth emphasizing the fact that the Thai crisis was only a triggering factor that brought the underlying fragile macroeconomic structures of Indonesia to the surface. This fact has also been suggested by Iriana and Sjoholm (2001) who found that contagion from Thailand served only as a trigger for the Indonesian crisis.
Now, another possible explanation related to contagion was the deepening crisis experienced by Japan in 1997. The deepening crisis experienced by Japan in 1997 caused many of its banks, which had heavily lent to Indonesia (and other Asian economies) since the eighties and nineties (due to low interest rates in Japan as discussed previously), to suffer capital losses as they were required to re-balance their portfolio in order to meet the Capital Adequacy Ratio (CAR) standards. Since the capital adequacy requirement was higher for international than national lending, it has forced many of those banks to recall foreign loans lent to Indonesia and other Asian countries. Jap (2003) argued that
14
Hong Kong’s ability to defend its exchange rate parity was due to the increment in the short-term interest rate by the Monetary Authority. With high nominal and real interest rate, it helps prevent an acceleration of the capital outflow and hence convince the international market about the credibility of the Hong Kong’s commitment to keep its exchange rate parity fixed. However, it was misperceived as due to the presence of Currency Board System (CBS) in Hong Kong that motivated President Soeharto to practice it in order to stop the downward fall of rupiah in face of the 1997 crisis (Corsetti et al. 1998b).
15
this was an important factor, which contributed to the sudden capital flight experienced by Indonesia during the crisis, as most of the Indonesia credits (about 35% of its total debts) were borrowed from Japan. This can be seen from Table 2.9 as well.
Again, we do not share the same belief that this is the fundamental reason behind the crisis in Indonesia. If only Indonesia managed its short-term debts prudently and used them to invest in the manufacturing sectors to boost exports by optimizing the productive capacity of the economy, then those short-term debts would be able to generate dollar revenues needed to pay the debts back. Although the revenues generated from export may not necessarily be enough to cover all the debts but at least it will buffer the country from significant exchange rate risks. Jap (2003) argued further that if only Indonesia managed its short-term debt more prudently, the impact of the sudden capital flight, due to the Japanese weakening economy that forced its banks to call back their loans from Indonesia, would not be as severe as it has happened. So to reiterate again, the underlying problem is in the country itself. A weakening Japanese economy had the same role to play as the Thai crisis in relation to Indonesia’s crisis. It only served as a triggering factor which brought the internal distortions within the country to the surface.
even more vulnerable to exchange rate risk. Contagion effects from The Baht crisis and a weakening Japanese economy contributed to blow up the distortions that were already in place. In light of this consideration, a study carried by IMF (1999) confirmed the importance of economic fundamentals and shows that several countries affected by the financial crisis shared similar weaknesses.
Once creditors begin to believe that the other creditors are no longer willing to roll over the debt, each of them will try to call in their loans ahead of other investors16, so as not be the one left without repayment out of the limited supply of foreign exchange reserves (Radelet and Sachs 1998b). Here, it is clear that the Thai crisis and a weakening Japanese economy played important roles in starting the crisis. If it was not the Thai crisis that ‘encouraged’ investors to reassess their investment and weakening Japanese economy that forced Japanese banks to recall their loans from Indonesia, Indonesia’s weaknesses would not be revealed and panic among investors could be avoided as short-term debt can be easily rolled over under normal circumstances.
Furthermore, if Indonesia had sufficient foreign reserves compared to short-term debt and strong economic fundamentals, a reassessment carried by investors might not lead to a panic (or if there it did, at least it would not be so severe), and the crisis might have been avoided or mitigated. In a recent study by Siregar and Rajan (2003), they indicated that Indonesia should at least holds an average reserve of about 5 months of imports. This is to re-emphasize and justify the points made earlier that the fundamental reason behind Indonesia’s crisis in 1997 lied in the country’s frail economic fundamentals itself.
All in all, we should take note about the important domestic factors that caused Indonesia to suffer severely during the crisis years. As we have argued earlier, the authorities’ failure to dampen the overheating pressures is the first and foremost reason. Secondly, Indonesia adopted a managed exchange rate regime with a downward crawling
16 A situation called
peg such that exchange rate might change predictably and smoothly according to government’s policy announcements. Consequently, the maintenance of this crawling peg exchange rate with predictable rates of depreciation has encouraged inadequate hedging of external borrowing by both the financial and the corporate sectors. Failure to do this has caused tremendous debt and huge capital flow reversal that has resulted from massive depreciation of the Rupiah. Next is the weak prudential regulations and financial oversight that led to a sharp deterioration in the quality of domestic bank’s loan portfolios. The high figures of non-performing loans (NPLs) have caused many bank runs and collapse, which in turn destabilize the economy further. Lastly, non economic factors that include political uncertainties, lack of transparency, and loss of confidence in the government have also played a part.
2.3
Indonesian Macroeconomic Conditions and Developments Post
Asian Financial Crisis
Macroeconomic conditions in Indonesia still remain quite frail even after some remedies have been applied to bring back the sustained level of development in Indonesia. In short, the progress of economic recovery has been rather slow. The repercussions from the devastating financial crisis are very persistent since many key macroeconomic indicators continue to show sluggishness in recent years.
The GDP growth fell to historical low of −13.13% in 1998 coupled with a
high debt service ratio both in the public and private sectors as well as the loss of investors’ confidence in the Indonesian economy.
Table 2.10 Key Macroeconomic Variables of the Indonesian Economy: Crisis and Post-Crisis Periods, 1997–2001 (%)
Year GDP Growth GDP Per Capita Growth Unemployment Rate Inflation Rate
1997 4.70 3.27 4.7 6.73
1998 -13.13 -14.30 5.5 57.64
1999 0.80 -0.55 6.4 20.49
2000 4.90 3.53 6.1 3.72
2001 3.32 1.97 8.1* 11.50
Year Real Interest Rate Export Growth Import Growth Money Growth
1997 8.21 7.80 14.72 25.25
1998 -24.60 11.18 -5.30 62.76
1999 11.83 -31.81 -40.68 12.23
2000 6.59 26.50 21.09 16.62
2001 5.31 1.88 8.05 12.84
Source: World Development Indicators CD-ROM (World Bank, 2004). * Source: Economist Intelligence Unit Country Data.
Furthermore, many jobs have been lost in these periods thus creating even a severe recessionary pressure in the domestic economy that brought back the recurrent inherent structural difficulties such as high unemployment figures, income gap, as well as poverty incidence in Indonesia.
Inflation rate shot up to 58% in 1998 and 20% in 1999 during the crisis period and effectively resulted in a negative real interest rate of −24.6% in 1997 and subsequently
recovery process. This condition put another pressure on the Central Bank to expand the money base within the crisis period as shown by table 2.10 above that money growth amounted to 25.25% and 62.76% in 1997 and 1998 respectively. Export and import growth have shown decreasing rates within this crisis period as well due to many halted domestic productions and major reduction in the purchasing power resulted from several depreciations of the Rupiah as well as the breakdown of historically crawling peg exchange rate system into a market-determined (free-floating) exchange rate system during the crisis period. Years after the 1997-1998 crisis period has shown slight improvements in these key macroeconomic variables as depicted in table 2.10 above.
Despite progress after the Asian financial crisis, the Indonesian macroeconomic condition still suffered fragility due to certain challenges from domestic and foreign sides17. Domestically, a relatively slackened performance of exports and low investment coupled with historically high incremental capital to output ratios (ICOR) indicated long-lasting repercussion effects of the financial crisis on growth prospects and economic stability of Indonesia (Nasution 2002). ICOR is an important determinant of economic growth in the Indonesian economy because it contributed more to growth performance as compared to other factors such as labour productivity or increase in efficiency. More than that, fiscal stimulus has been used to offset both external and domestic debts as well as supporting price subsidies on some state-sold products, limiting the impact of this expansionary fiscal policy in boosting economic growth. In the banking sector,
17
deregulation, banking, and corporate restructuring have taken place, yet the banking system remained fragile and sluggish in restoring its core intermediation functions. On the other hand, the lack of commitment to sound and coherent economic policies has begun to erode the confidence of the international community and foreign investors to root their capitals in Indonesia. Not to mention the rising costs of production due to new policies designed by the government to regularly raise the minimum wages and generous severance benefits, which have dampened the willingness of foreign investors to invest in Indonesia (Nasution 2002). Furthermore, all these uncertain economic policies and lack of soundness in policy direction, plus the unfortunate global condition such as the September 11 attacks and international economic slowdown on top of the inherent domestic problems, have posed greater challenges for Indonesia to sustain macroeconomic stability and economic development.
The economy grew by 4.9%, 3.3%, and 3.5% in 2000, 2001, and 2002 respectively according to the BI report in January 200318 with the per capita growth rates to record some positive figures of 3.5%, 2%, and 2.7% in 2000, 2001, and 2002 accordingly19. These figures were relatively higher than in pre-crisis period. However, these rates of economic growth are not large enough to absorb the new batch of labour entering the job markets (Nasution 2002) as depicted by the open unemployment rate of 6.1% in 2000, 8.1% in 2001, and 8.3% in 2002 as compared to 4.9% in 199620. Nasution (2002) affirmed that the economic recovery is mainly driven by an increase in the private consumption whereby in 2002, consumption expenditures amounted to 60% of GDP and
18
http://www.bi.go.id/bank_indonesia2/utama/publikasi/upload/SUPLEMEN%202003-Final_Engl.pdf
19
The latest figure is based on the Economist Intelligence Unit (EIU) estimates.
of this amount 80% was private consumption. This makes the effective share of private consumption almost half (approximately 48%) of the GDP in that particular year.
Unfortunately, this economic recovery is not driven by the usual growth engines such as investment, exports, and productivity improvements. This might explain some scepticism about the development prospects in Indonesia whereby positive and reasonable growth rates were recorded but the unemployment figures remained high and an increasing portion of the people fell below the poverty line. As argued earlier, there are many factors that discouraged inflows of foreign direct investments as well as an exports resurgence such as the uncertain course of economic direction, political instability, increasing costs of domestic production, slow pace of banking and corporate restructuring, fiscal distress, and high non-performing loan ratios. The historically high ICOR indicated that high economic growth prior the crisis was due to a high investment ratio that boosted GDP growth rather than efficiency improvements (Nasution 2002). In addition to that, most of these investments were financed by the government savings that yielded growing budget deficits over the years including those during the crisis years and subsequently. All these conditions have substantially reduced government earnings and thus put a halt to many state-funded projects, which in turn will contribute to a higher unemployment rate.
2.4
Fiscal Policy in Indonesia
problem in the Indonesian economy for the present time and years to come (Nasution 2002). The inflexible and inefficient tax system is a factor that responsible for the insufficiency of government taxation revenues that is used to finance state projects and state-sold products apart from the rising company bankruptcy, reduction in trade flows, and consequently decreasing personal income after the financial crisis. In addition, high subsidies on petroleum and electricity add more pressure on sustaining balanced-budget system. Furthermore, the government also has several other short- to medium-term plans such as revamping the financial system, providing social-safety nets for the low-income families, and the decentralization plans21 that require an additional expenditure to be added on government balance sheet.
Another problem that has caused widening budget deficit is the mounting debts waiting to be repaid and the pressure is worsen by the recent financial crisis that has made the problem seemed to be larger than it seems.22 Soaring debt repayment has been partially due to Rupiah’s depreciation, interest rate increases, and inflation hike (Nasution 2002). As a response to tackle this budget deficit, the government cut non-debt expenditures by cutting subsidies on state-sold products, petroleum, and electricity services; freezing the salary of civil servants; and selling government bonds to rich regions (Nasution 2002). At the same time, the reduction in subsidies was also meant to reduce the gap in domestic and international prices as to prevent illegal exports for arbitraging activities. To avoid inflationary pressures created from government fiscal policies, the monetary authority finance the budget deficit through official development
21
The latest plan requires the state to disburse 25% of the government revenue to the contributing region.
22
aid from foreign creditors and consultative group on Indonesia (CGI). Moreover, inflationary finance is rule out by both government policy and Bank Indonesia Act in 1999 that bans central bank from buying government bonds in the primary market except for bailing out banks.
In fiscal year 2000, the government debt outstanding reached 100.7% of GDP that consisted of 50.8% and 49.9% domestic and external debt respectively (Nasution 2002). During the “new order” era, the strategy adopted is to obtain long-term official development assistance with low interest rates to finance and thus relaxing the foreign exchange constraints and put less pressure on domestic market ability to settle the government debts. At this point in time, the government use the method of a rudimentary domestic financial market to finance the outstanding debt. However, the interest rates on government bonds that is very much sensitive to 1-month SBI rates, the inflation rate, and the exchange rate increases the burden on the fiscal side of the economy as these macroeconomic variables subjected to high volatility and uncertainty23.
In summary, the fiscal policy in Indonesia has to find its way to increase the tax base revenue apart perhaps by revamping the current tax system and to boost more trade activities by creating export incentives. The relatively underdeveloped and inactive secondary market for government bonds should be another concern for the authority to rely on this method for financing budget deficits. If this could be a viable strategy, then focused attention should be put on developing effective rules and regulation about this
23
secondary market and encourage banks to include government bonds for their liquidity purposes. The function of fiscal policy as an “automatic stabilizer” as a counter measure for recessionary pressures does not seem to be the case for Indonesia due to massive debt restructuring that has drained most of the government’s resources. However, at least, the domestic political goal of creating more employment through labour-intensive public and state works should be achieved by government spending to ease the burden of the poor that has already hit by adverse impact of financial crisis. Lastly, the method of relying on foreign official development aid might work only for long-term fiscal sustainability. The government should take more proactive fiscal policies and methods to increase revenues in order to ensure the short- and medium-term fiscal goals especially in restoring the economic conditions after the structural changes took place.
2.5
The Conduct of Monetary Policy in Indonesia
This section will discuss the recent conduct of monetary policy in Indonesia during and after the financial crisis24. We will also bring the importance of monetary policy during the period of financial crisis in Indonesia. In addition to that, the discussion of key macroeconomic variables that are important in explaining the conduct of monetary policy is particularly crucial to suit our purpose in developing an SSMM for the Indonesian economy and to evaluate any responses from future unexpected shocks to the economy. Furthermore, it will be useful for us to determine the appropriate measures to be taken in the monetary policy elements to ensure the effectiveness of any policy actions in tackling
any future shocks to the economy which is done through the dynamic simulation of the Indonesian SSMM.
Before we discuss the conduct of monetary policy in Indonesia, it is necessary to define some terminology used, such as target, instruments, indicators, and goals of monetary policy25. An instrument variable can be directly manipulated or controlled by the central bank on a day-to-day or week-to-week basis. Goal variables are the eventual objectives of monetary policy conducted by the central bank, which are usually expressed in terms of statements involving economic progress or the sustained level of welfare of a particular economy. This is to be contrasted with a target variable which is an operational concept that is more closely related to the goal variables than instruments, in the sense that the former can be considered as the tangible form or manifestation of goal variables. Finally, indicators are those variables which provide policy makers and central bank authorities with important information but are not (or cannot!) be kept on some targeted paths.
Following these distinctions, we are now in a better position to describe several alternative instruments that have been used to achieve targeted paths for the Indonesian economy. The instruments will include the money supply controlled by the BI or interest rates set by BI26. Target variables are the inflation rate and output gaps or output levels27.
25
These clear and elegant definitions can be found in McCallum (1998).
26
Fiscal expenditure governed by the Ministry of Finance is an instrument of fiscal policy that is worth noting. In general, fiscal policy is supposed to be controlled by the Ministry of Finance but BI seems to have a role to play as well (See McLeod, 2003).