T H E J O U R N A L O F H U M A N R E S O U R C E S • 45 • 1
The “Missing Girls” of China and
the Unintended Consequences of the
One Child Policy
Avraham Ebenstein
A B S T R A C T
High ratios of males to females in China have concerned researchers (Sen 1990, Yi et al. 1993) and the recent increase has alarmed policymakers worldwide. This paper presents an analysis of China’s census data that in-dicates that the “missing girls” phenomenon is causally linked to enforce-ment of the One Child Policy. Fertility is lower and sex ratios are higher among those under stricter fertility control, and the overall increase in the sex ratio is driven by an increase in the prevalence of sex selection among first and second births. By exploiting regional and temporal variation in fines levied for unauthorized births, I find that higher fine regimes discour-age fertility, but are associated with higher ratios of males to females.
I. Introduction
When the People’s Republic of China was founded in 1949, the country had a population of approximately 540 million. Only three decades later, its population reached more than 800 million. This unprecedented population in-crease from the 1950s to the early 1970s created a global concern that China was destined for a “Malthusian collapse”—unchecked population growth that eventually outstrips growth in the food supply and results in massive famine. Chinese fertility policy was redirected toward limiting fertility, culminating in the One Child Policy in 1979. While China’s family planning programs successfully reduced the fertility
Avraham Ebenstein is a Lecturer, Department of Economics, Hebrew University, Jerusalem, Israel. The author thanks Ronald Lee, David Card, William Lavely, and three anonymous referees for helpful com-ments. The author also received helpful guidance from Rodney Andrews, Kenneth Chay, Richard Crump, Monica Dasgupta, Gretchen Donehower, Griffith Feeney, Simon Galed, Gopi Shah Goda, Susan Green-halgh, Jonathan Gruber, Damon Jones, David Levine, Marit Rehavi, David Romer, Claudia Sitgraves, Kevin Stange, Kenneth Wachter, Feng Wang, and Danzhen You. The data used in this article can be obtained beginning August 2010 through July 2013 from Hebrew University, Mount Scopus Campus, #4208, Jerusalem, Israel, ebenstein@mscc.huji.ac.il.
[Submitted February 2008; accepted September 2008]
88 The Journal of Human Resources
rate, as this paper will demonstrate, it also had the unintended consequence of ex-acerbating the distortion in the country’s sex ratio.1
Researchers have long been concerned with the unusually high fraction of males to females in the Chinese population. In 1990, Amartya Sen alerted Western re-searchers to a “sex bias in relative care”—decades of mistreatment and neglect of China’s women. He suggested this bias was responsible for the high Chinese sex ratio, and estimated that 50 million Chinese women and 100 million women world-wide were unaccounted for relative to natural birth and mortality rates. Sen’s finding aroused the concern of policymakers and has provoked a wave of research on the topic: Where did the “missing girls” go? In recent years, the female deficit has grown. In spite of a general improvement in infant health care in China, the number of male children below the age of 15 exceeds the number of female children by 13 percent. Some caution that the marriage prospects for the next generation of Chinese men are grim if the situation is not corrected (Poston and Glover 2005).
A consensus has emerged that the sex ratio distortion in China is due to prenatal discrimination against female conceptions. This consensus is based primarily on evidence from fertility surveys (Hull 1990), field work (Junhong 2001), and census data (Yi et al. 1993, Das Gupta 2005). In this paper, I improve on the existing literature in several ways. First, by exploiting rich microdata from China’s census samples (1982, 1990, 2000), I am able to more robustly document the practice of sex selection and more concretely estimate the number of “missing girls” due to this behavior. Second, my analysis reveals new information on striking patterns in birth interval lengths—sons are preceded by longer intervals than daughters. This provides new and further evidence that sex selection is responsible for the “missing girls,” rather than biological factors such as hepatitis (Oster 2005). Third, I present novel and compelling evidence that implicates the One Child Policy in this phenomenon: The timing of the increase in the sex ratio and cross-sectional variation in the policy enforcement highlight the importance of the policy in explaining China’s gender imbalance.2Parents under tighter fertility control are characterized by lower fertility
and higher sex ratios among births, indicating that parents are engaging in sex se-lection to satisfy their dual interest in complying with the fertility policy and having at least one son. Lastly, this paper provides the first in-depth look at China’s 2000 census offering the most comprehensive and conclusive look at recent Chinese fer-tility patterns. The analysis reveals several alarming patterns, such as a steep rise in the sex ratio of first births during the 1990s in the wake of stricter enforcement of the One Child Policy.
The paper is organized as follows. Section II provides background information regarding China’s fertility policies, the historical evolution of sex ratios at birth, and existing demographic analysis on the “missing girls” of China. Section III documents the increase in sex selection at earlier parities and estimates the number of “missing girls” in the last two decades in China. In Section IV, I demonstrate that the sex
1. Sex ratio refers to the ratio of males to females.
Ebenstein 89
ratio distortion is related to enforcement of the One Child Policy. I conclude in Section V with a brief discussion of the policy implications of the results.
II. Background
Historically, Chinese parents have favored large families and have directed family resources to sons at the expense of daughters. As the population grew rapidly, Chinese policymakers felt compelled to limit fertility, and in the wake of the One Child Policy (1979), the sex ratio of births began to rise. As I will later discuss, this forced decline in fertility and rise in the male fraction of births appear to be causally linked.
Following a famine associated with Mao’s Great Leap Forward (1958–60), total fertility exceeded six births per mother throughout the 1960s (Banister 1987). The rapid population growth alarmed Chinese officials, and the Communist Party sub-sequently enacted a series of fertility control policies, culminating in the One Child Policy in 1979. The policy excluded additional children from free public education and parents were subject to fines. Following a forced sterilization and abortion cam-paign in 1983 that created domestic unrest, Chinese policymakers began considering revisions to the policy. By allowing some mothers to have a second child, the gov-ernment hoped to discourage violations and increase public support for the policy (Gu et al. 2007).
In 1984, the Chinese government instituted a localized fertility policy in which residents of different provinces were subject to different mandated limits (Green-halgh 1986). Though the one child limit was enforced on urban residents, mothers of a daughter in several rural provinces were allowed to have a single additional birth (a “1.5-child” policy) and families in remote areas a second or third child. Today, Chinese fertility policy imposes a one-child limit on urban residents who make up about a third (35 percent) of the population, a 1.5-child policy limit in rural areas3 (54 percent), and a two- (10 percent) or three-child (1 percent) policy limit for provinces in remote areas. The policy also grants exclusions to various groups, including Chinese ethnic minorities and those employed in dangerous occupations. In China, parents have historically preferred sons to daughters and in some cir-cumstances discarded daughters upon birth (Coale and Banister 1994). In the 1960s, when fertility was high and infant mortality was low, this pattern was temporarily muted by the fact that most mothers were likely to have at least one surviving son without resorting to sex selection. However, while the female deficit was reduced, high fertility and low infant mortality were contributing to unsustainable population growth. During the late 1960s and early 1970s, the Chinese government promoted a “Two Is Enough” policy, and the sex ratio following first and second-born daugh-ters began to rise (see Figure 1).
90 The Journal of Human Resources
5.
6.
7.
8.
1970-1974 1975-1979 1980-1984 1985-1989 1990-1994 1995-2000 Year of Birth
1st Birth 2nd Birth 3rd Birth
Fraction Male
Figure 1
Male Fraction of Births Following Daughters in China
Source: China census 1982–2000. Sample restricted to mothers ages 21–40. See technical appendix at author’s website for details. Vertical line indicates year of introduction of China’s One Child Policy (1979).
Ebenstein 91
that rely most heavily on fertility surveys4 (Hull 1990, Yi et al. 1993) or field
surveys5(Junhong 2001) to more robustly document the practice of sex selection.
The results demonstrate convincingly that sex selection is responsible for the female deficit and the recent increase is due to its increased prevalence among first and second births.
III. China’s Census and the Sources of the Female
Deficit
The China census sample contains basic demographic information for every man, woman, and child surveyed.6 Because there is no census question that matches mothers to children, I infer the relationship using the census question that identifies each household member’s relationship to the head.7The census has
no information on children no longer living at home, so I restrict the sample to mothers and children who are most likely to be living in the same household. The sample comprises all married women 21 to 40 who are successfully matched to at least one child. The matching algorithm matches over 95 percent of children to a mother and the sex ratio among matched children is almost identical to the sex ratio for the cohort as a whole, suggesting that unmatched children are not driving the results found in the matched sample used for this analysis. As a further check that unmatched children are not confounding the results, I use a direct question in the China 1990 and 2000 census in which mothers report the number of living sons and daughters. For 91 percent of the mothers in each year, the reported number and matched number of children are equal. Excluding the mothers for whom there is a discrepancy only changes the results slightly.8I include these mothers, however, so
that the sample is as comprehensive as possible.9 The summary statistics for the
China census samples are shown in Appendix Table A1.
Table 1 reflects the large impact of sex preference on parental stopping probability and the close correspondence between the number of a mother’s living daughters and the male fraction of subsequent births. With only a small distortion observed among first-born children in recent years, the high share of mothers having children following daughters, in combination with the high sex ratios at these parities, is
4. Hull examines roughly 229,000 births that occurred between 1986 and 1987. Yi et al. rely mainly on the 1988 Two Per Thousand Fertility Survey, but also cite results from the 1990 census indicating a relationship between the sex composition of existing children and the sex of the next child.
5. Junhong (2001) surveyed 820 married women in a village in rural central China.
6. Sample size of the China census data: 1982 1 Percent Survey (10,037,508), 1990 1 Percent Survey (11,568,585), 2000 One Per Thousand Survey (1,180,111).
7. The IPUMS-Minnesota matching rules for assigning the most probable child to mother are used for all data sets. Information on the IPUMS algorithm is available at http://www.ipums.umn.edu.
8. A version of the tables excluding these mothers is available from the author upon request. The results are actually slightly stronger, with higher sex ratios observed following daughters.
92 The Journal of Human Resources
Table 1
Fertility Patterns in China by Sex of Existing Children
Percent who have another child
Fraction Male (of next birth)
Parity Sex Combination 1982 1990 2000 1982 1990 2000
Overall 0.516 0.520 0.533
1st None 0.511 0.510 0.515
2nd One boy 0.71 0.54 0.35 0.51 0.50 0.50
One girl 0.75 0.60 0.49 0.52 0.55 0.62
3rd Two boys 0.53 0.30 0.18 0.50 0.43 0.39
One girl, one boy 0.54 0.29 0.16 0.52 0.52 0.53
Two girls 0.68 0.55 0.46 0.54 0.61 0.70
4th Three boys 0.40 0.24 0.17 0.48 0.40 0.37
One girl, two boys 0.36 0.17 0.11 0.51 0.49 0.52
Two girls, one boy 0.44 0.23 0.14 0.52 0.55 0.58
Three girls 0.62 0.54 0.50 0.56 0.64 0.72
Source: China Census 1% sample (1982), 1% sample (1990), .10% sample (2000). Married women ages 21–40 and their matched children ages 0–18.
Notes: Data in thousands. Sex ratio (boys/girls) at birth is calculated by assigning weights to each male and female that account for differential mortality rates by age, sex, and year. China life tables taken from Banister (2004).
clearly responsible for the high overall sex ratio in China.10Sons represent over 60
percent of births to mothers with one daughter, and over 70 percent of births to mothers with two daughters. In the 2000 China census, mothers of two daughters are nearly three times as likely to have a third child as mothers of two sons (46 percent versus 18 percent). Since mothers are less likely to have another child fol-lowing sons, the high sex ratios folfol-lowing daughters have a pronounced impact on the overall sex ratio and explain the high overall sex ratio despite the relative lack of sex selection at the first parity.
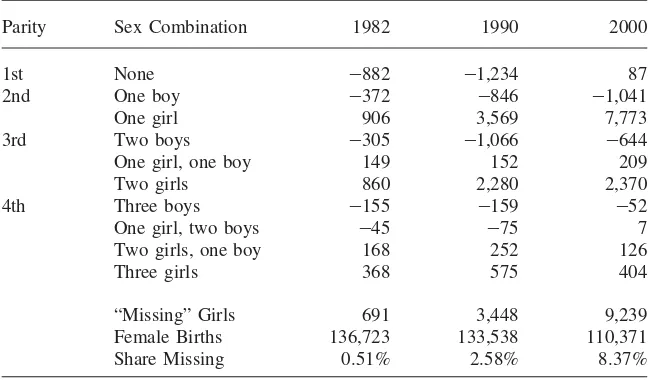
In Table 2, I attempt to account for the overall female deficit by examining the share of missing girls (or boys) following each observed sex combination. Using a baseline estimate that the natural sex ratio at birth is 1.059 (implying a natural share
Ebenstein 93
Table 2
Accounting for the Female Deficit in China (000s) by Parity: 1982–2000
Parity Sex Combination 1982 1990 2000
1st None ⳮ882 ⳮ1,234 87
2nd One boy ⳮ372 ⳮ846 ⳮ1,041
One girl 906 3,569 7,773
3rd Two boys ⳮ305 ⳮ1,066 ⳮ644
One girl, one boy 149 152 209
Two girls 860 2,280 2,370
4th Three boys ⳮ155 ⳮ159 ⳮ52
One girl, two boys ⳮ45 ⳮ75 7
Two girls, one boy 168 252 126
Three girls 368 575 404
“Missing” Girls 691 3,448 9,239
Female Births 136,723 133,538 110,371
Share Missing 0.51% 2.58% 8.37%
Source: China Census 1% sample (1982), 1% sample (1990), .10% sample (2000). Married women ages 21–40 and their matched children ages 0–18.
Notes: These calculations represent the weighted average of the distortion to the fraction of sons born following a combination by the actual number of women who are observed with another child. These results will not exactly match the female deficit reported in Appendix Table A1.
of male births of 51.4 percent), I can estimate the number of missing girls at each parity.11The results indicate that the female deficit observed in aggregate natality
data is composed of a large female deficit following daughters, and a smaller female surplus following sons that slightly mitigates the deficit following daughters. Prenatal selection and infanticide can account for a female deficit of roughly 9.3 million missing girls in China’s 2000 census.12In the earlier Chinese census of 1982, I find
that sex selection is less common and the net female deficit is small relative to total births. However, the pattern of high sex ratios at birth following daughters and low sex ratios following sons suggests the presence of human manipulation even in this earlier period. Note also that the results shown in Table 2 imply a female surplus at the first parity in the 1982 and 1990 samples. This is due to the choice of a high
11. Banister (2004) writes: “In Caucasian and Asian populations where no prenatal sex-selection is prac-ticed, the SRB is in the narrow range 105.0-107.0. For example, the annual recorded SRB in Japan during 1980-2000 was 105.2-106.0.” I choose 1.059 as the natural sex ratio at birth in accordance with Coale (1991).
94 The Journal of Human Resources
baseline “natural” sex ratio for this exercise (51.4 percent), which provides a more conservative estimate of the total number of missing girls, but implies that the male fraction of first births (51 percent) in these samples was unnaturally low.
When the missing girls are identified by parity, the rising sex ratios among first and second births are almost entirely responsible for China’s growing imbalance. Table 2 shows that in China, the number of “missing girls” among children aged 0–18 increased from 3.4 million to 9.2 million between the 1990 and 2000 census. The 5.8 million increase in missing females can be traced in large part to the rise in the sex ratio following a first-born daughter: in the 1990 census sample, 55 percent of births following a daughter were male whereas in the 2000 census sample, over 62 percent of these births were male. Since many parents in the sample (49 percent) had a second child following a daughter, these births account for 7.7 million of the 9.3 million missing girls in these data. While higher order births are even more distorted, they are less common, and thus the bulk of the increase in China’s sex ratio is explained by childbearing behavior following a single daughter. Ironically, the “1.5-child” policy in China discourages higher order births following sons more than births following daughters. This has the effect of increasing fertility among parents who want a son and may engage in sex selection in favor of a male birth, but reducing fertility among parents who want a daughter and might engage in sex selection in favor of a female birth, and further increasing the overall female deficit. The sex ratio of first births rose between 1990 and 2000 as well, rising from 51 percent to 52 percent and increasing the number of “missing girls” by 1.6 million. In total, the increased sex ratio of first births and second births following daughters is responsible for 5.7 million of the 5.9 million increase in “missing girls” observed in the census, or 97 percent of the total change.
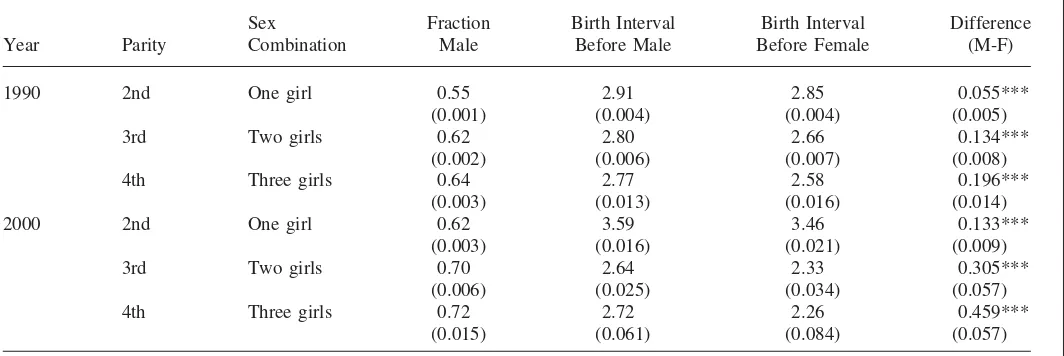
Das Gupta (2005) presents evidence from China’s 1990 census that the high sex ratios in China are driven by “missing girls” following daughters, and that this is most likely due to “parental intervention.” In Table 3, I present additional support for this hypothesis by examining the duration between mothers’ births. If sex selec-tion is responsible for the distorted sex ratios following girls, birth intervals should be distorted for women who choose to abort a female fetus. Specifically, one would anticipate finding a longer delay between an initial birth and a subsequent male birth than a subsequent female birth, due to the fact that a child born following an abortion should be born approximately 30 weeks later than a child born on a first attempt.13
(The expected interval distortion associated with infanticide is even larger, since ultrasound is available less than five months into pregnancy.) Since boys are more likely to be preceded by a sex selection induced delay, on average sons will be preceded by a longer birth interval than daughters. The difference in birth interval length also will be larger at parities with more distorted sex ratios, since a larger share of males will presumably have been preceded by a female conception. Con-sistent with this prediction, in the 1990 census data, following two daughters the share of mothers who have a son is 62 percent and male births arrive 0.14 years
Ebenstein
95
Table 3
Birth Interval Length Following Daughters by Sex of Next Child in China
Year Parity
1990 2nd One girl 0.55 2.91 2.85 0.055*** (0.001) (0.004) (0.004) (0.005) 3rd Two girls 0.62 2.80 2.66 0.134***
(0.002) (0.006) (0.007) (0.008) 2000 2nd One girl 0.62 3.59 3.46 0.133***
(0.003) (0.016) (0.021) (0.009) 3rd Two girls 0.70 2.64 2.33 0.305***
(0.006) (0.025) (0.034) (0.057)
* significant at 10% ** significant at 5%. *** significant at 1%. Source: See Table 1.
96 The Journal of Human Resources
later than female births. In the 2000 census data, the percentage male for these mothers is 70 percent, and sons arrive 0.34 years later than daughters. The distorted birth intervals are strong evidence that the high sex ratios observed are the product of human decision. There exists no biological explanation that can account for these extended birth intervals preceding the desired sex.
While the Chinese preference for sons is well known, the data also indicate that following sons, parents appear to practice sex selection to ensure the birth of a daughter. In the 2000 census, mothers with two sons who have a third child have a 61 percent chance of having a daughter. Junhong (2001) in field work found that 7 percent of male fetuses at higher birth parities are aborted following ultrasound, and this is consistent with qualitative evidence that Chinese parents prefer a daughter following sons. Greenhalgh (1994) cites one rural village in which villagers refer to a second son as fudan zhongor a “heavy burden,” since a second son requires a new house at the time of his marriage, which may cost up to 10 years of annual income. Some suggest that mothers in China prefer at least one daughter to help the mother with household chores (Junhong 2001). In any event, the 2000 census reveals that among parents with sons, they exhibit a preference for daughters, and the overall female deficit is in fact composed of large deficit following daughters and a surplus following sons.
Others assert a known cause of the sex ratio distortion is the adoption of unwanted girls by Chinese families with no daughters (Johannson and Nygren 1991). While published figures indicate that only 10,000 adoptions occur per year in China, some have estimated that as many as 500,000 adoptions occur when one includes informal adoptions (Johnson 1993). Though adoption within China is common, external mi-gration via adoption is much less common and cannot explain these results. Recipient countries document that fewer than 10,000 Chinese infants are sent abroad annually, and while 95 percent of those adopted are girls, this represents only a negligible share of the missing girls.14Although I cannot distinguish sex selection from
within-China adoption, the practice should not affect the paper’s core result regarding the female deficit associated with sex selection, since the adopting family will enumerate the daughter. As such, Table 2 should be interpreted as the combined impact of female conceptions terminated and unwanted daughters adopted by a different family within China.
Though the orthodox opinion is that parental intervention following daughters is responsible for the sex ratio distortion, Oster (2005) proposes that high hepatitis rates in several Asian countries may be responsible for the high sex ratios observed in these countries.15However, any biological hypotheses are difficult to reconcile
with the analysis in this section: The high sex ratios following daughters and ex-tended birth intervals preceding sons represent strong evidence that sex selection is
14. In 2005, the United States naturalized nearly 8,000 Chinese adopted children, and over 95 percent of the children were female. The Chinese government reports a total of 60,000 adopted births sent to foreign countries between 1992 and 2006. (http://www.washingtonpost.com/wp-dyn/content/article/2006/03/11/ AR2006031100942.html).
Ebenstein 97
the primary explanation for the “missing girls” of China. As such, in the next section I extend this analysis to examine variation within China in sex selection. The results indicate that parents under stricter fertility limits are characterized by lower fertility and higher sex ratios, further supporting the claim that human decision is responsible for China’s “missing girls,” and directly implicating the One Child Policy in the rising sex ratio at birth in China.
IV. Sex Ratios and the One Child Policy
While the sex ratio distortion in China is a long-standing demo-graphic pattern, fertility policies instituted to slow population growth have exacer-bated the female deficit. Under the One Child Policy, parents in China who exceed their fertility limit are forced to pay a fine and are subject to a variety of other monetary punishments, including the seizure of property and forced dismissal from government employment. There are four fertility limits for four different categories of parents. Those registered to an urban work zone (or hukou) are subject to the one-child limit; those registered to a ruralhukouare often allowed a second child if the first child is a daughter (resulting in an average of 1.5 children per mother, the “1.5-child” policy); residents in autonomous regions are generally allowed a second birth; and ethnic minorities are subject to weaker regulations in almost all provinces (Gu et al. 2007).16
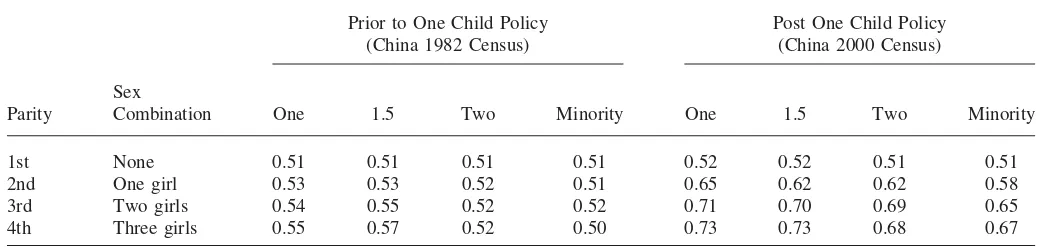
In Table 4, which stratifies births by the mothers’ fertility limit category and parity, one observes that in the 2000 census data mothers are more likely to have a son once they face a fine for childbearing. For example, at the first birth mothers facing different fertility policies have similar sex ratios at birth, but following one daughter, mothers facing the One Child Policy are three percentage points more likely to have a son than those facing less strict fertility limits. Following two daugh-ters, mothers under the One Child Policy and mothers under the “1.5-child” policy are two and one percentage points more likely to have a son than mothers under the two-child policy, respectively. In comparison, in the 1982 census data, which cap-tures births prior to the implementation of the One Child Policy in 1979, mothers in these different categories had similar sex ratios among first and second births.17
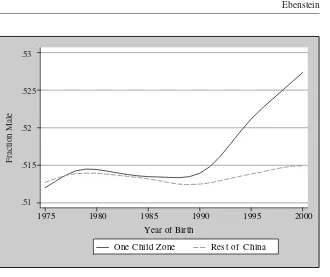
For mothers whose peak childbearing years were under the One Child Policy (2000 census data), at each parity, those under the strictest fertility control are the most likely to have a son, which suggests a direct role for fertility control in the rising sex ratio at birth. I explore this hypothesis graphically in Figures 2 and 3.
Figure 2 indicates that following the government crackdown in the early 1990s, the male fraction of first births began to rise among parents under the provinces
16. The registration status of the household during the 2000 census will only approximate the fertility regime the family faced when making fertility choices. Some families may have migrated and registered in an urban zone. As a robustness check, I exclude the 11 percent of mothers who in the 2000 census report that they currently do not live in their hukou, and the results are very similar.
98
The
Journal
of
Human
Resources
Table 4
Male Fraction of Births by Fertility Policy in China
Prior to One Child Policy (China 1982 Census)
Post One Child Policy (China 2000 Census)
Parity
Sex
Combination One 1.5 Two Minority One 1.5 Two Minority
1st None 0.51 0.51 0.51 0.51 0.52 0.52 0.51 0.51 2nd One girl 0.53 0.53 0.52 0.51 0.65 0.62 0.62 0.58 3rd Two girls 0.54 0.55 0.52 0.52 0.71 0.70 0.69 0.65 4th Three girls 0.55 0.57 0.52 0.50 0.73 0.73 0.68 0.67
Source: See Table 1.
Ebenstein 99
1975 1980 1985 1990 1995 2000
Year of Birth
One Child Zone Rest of China
Fraction Male
.53
.525
.52
.515
.51
Figure 2
Rising Sex Ratio among First Births in China
Source: China census 1982–2000. The graph is created by calculated the running-mean smoother applied by the lowess command using STATA 9 software.
covered by a strict one-child limit. Likewise, Figure 3 indicates that the increase in the sex ratio of second births has been more pronounced in the One Child zone relative to the rest of China—strong evidence that the policy is affecting the sex ratio at birth. Though the time series evidence confounds the separate effect of the increased enforcement of the fertility regulations and the introduction of ultrasound, the technology was widely available in rural China by the early 1990s (Greenhalgh and Winckler 2005). As such, comparisons between policy regions in the 1990s can be thought to capture the effect of the fertility regulations, whereas the intercensus comparison in Table 4 reflects the combined impact of better technology and the introduction of the One Child Policy.
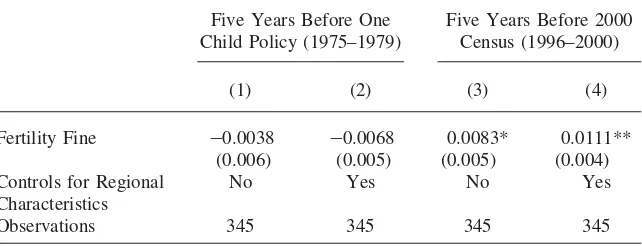
In Table 5, I further test the claim that the fertility reduction induced by the One Child Policy is affecting the sex ratio of births by exploiting variation in the fines on excess fertility, catalogued by province, year, and ethnicity (Scharping 2003).18
100 The Journal of Human Resources
5.
5
5.
6.
5
6.
7.
1975 1980 1985 1990 1995 2000
Year of Birth
One Child Zone Rest of China
Fraction Male
Figure 3
Rising Sex Ratio among Second Births Following a Daughter in China
Source: China census 1982–2000. The graph is created by calculated the running-mean smoother applied by the lowess command using STATA 9 software.
I describe the calculation of these fines in an appendix to this paper, and provide a link to a data set of fine rates by province and year (1979–2000). Additionally, a visual summary of the spatial dispersion of the fines is presented in Figure 4, where I show the average fine on a third birth in each of China’s 345 prefectural zones. As seen in Figure 4, the variation in the average fine rate is driven by geographical differences, such as provincial regulations, ethnic composition, and the share of parents with urban registration. Note that the geographic variation in the average fine rates reflected in the figure corresponds reasonably well to recent efforts by other scholars to document local variation in enforcement of China’s fertility policy (see Gu et al. 2007), suggesting that the imputed fine is capturing key elements of the variation in the strictness of the policy.19If this paper’s main hypothesis is valid
and the regulations are causally linked to fertility outcomes, the fines should not be correlated with the sex ratio prior to the policy but should be positively correlated with the sex ratio in recent years. Table 5 reflects that both of these predictions are
Ebenstein 101
Table 5
Regression (OLS) Estimates of Male Fraction of 5-year Birth Cohort (LHS) on Fertility Fines (RHS)
Five Years Before One Child Policy (1975–1979)
Five Years Before 2000 Census (1996–2000)
(1) (2) (3) (4)
Fertility Fine ⳮ0.0038 ⳮ0.0068 0.0083* 0.0111**
(0.006) (0.005) (0.005) (0.004)
Controls for Regional No Yes No Yes
Characteristics
Observations 345 345 345 345
* significant at 10% ** significant at 5%. *** significant at 1%. Source: China 2000 Census.
Notes: The fine is measured in years of household income, taken from Scharping (2003). Each regression examines the partial correlation between a 5-year age group and the fertility fines in 2000 by prefecture. China’s 2000 census is broken into 345 prefectural boundaries, and this is the finest geographic breakdown available in the data. Controls for regional characteristics are the share of individuals with access to tap water, share with electric or gas fuel, share with concrete or brick households, and the average education of those 30–39 years old. The male share of births is proxied by the living share of those in each cohort. Standard errors are robust and clustered at the province level.
borne out by the data, consistent with the claim that the female deficit is related to the stringency of fertility control.
signifi-102 The Journal of Human Resources
0-1 1-2 2-4 4+
Figure 4
Fine Rates in China
Source: Scharping (2003). Fine rates in years of household income. Darker shades correspond to higher penalties. Average fine is calculated for having a 3rd birth among residents of each prefecture using demographic information and the policy rule in the province.
cant at the 5 percent level.20This suggests that the impact of the fertility fines on
the sex ratio in recent years is not simply related to preexisting features of the regions.21Enforcement of fertility regulations is responsible for the connection
tween sex ratios and fertility fines, rather than a spurious regional correlation be-tween lower fines and lower son preference. The parameter estimates indicate that increasing the fine in each prefecture by 100 percent yields roughly a 1 percent increase in the male fraction of births.
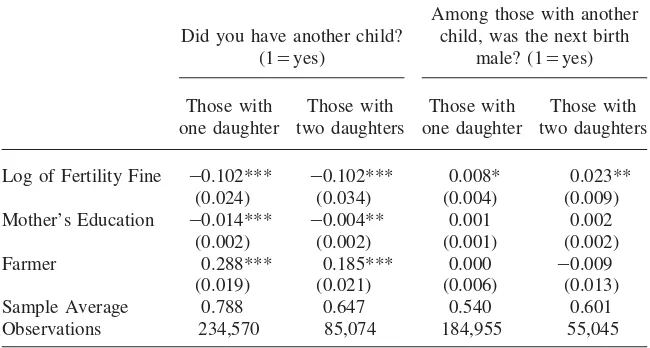
In Table 6, I perform an individual-level test of whether the fertility reduction induced by the One Child Policy is affecting the sex ratio of births. If indeed the policy is having this effect, one would anticipate that the fines on excess fertility
20. One anonymous reviewer noted that migration of parents across provinces (and fine regimes) could bias the coefficient on the fine variable. A version of these regressions excluding any parents who were born in a differenthukouis available upon request. The results are very similar but slightly less statistically significant, since migration by women for marriage in China is common.
Ebenstein 103
Table 6
Regression (OLS) Estimates of Fertility Outcomes (LHS) on Fertility Fines (RHS) Following Daughters: China 1964–2000
Log of Fertility Fine ⳮ0.102*** ⳮ0.102*** 0.008* 0.023**
(0.024) (0.034) (0.004) (0.009)
Mother’s Education ⳮ0.014*** ⳮ0.004** 0.001 0.002
(0.002) (0.002) (0.001) (0.002)
Farmer 0.288*** 0.185*** 0.000 ⳮ0.009
(0.019) (0.021) (0.006) (0.013)
Sample Average 0.788 0.647 0.540 0.601
Observations 234,570 85,074 184,955 55,045
* significant at 10% ** significant at 5%. *** significant at 1%.
Source: Matched sample of mothers and children from census taken in 1982, 1990 and 2000 pooled and weighted by probability of being sampled. Sample restricted to mothers ages 3540 and their matched children ages 0–18.
Notes: The fine is measured in years of household income, taken from Scharping (2003). Education is measured in years. The first two regressions examine the partial correlation between the fine for a 2nd/3rd birth and the chance parents have a 2nd/3rd child. The second two regressions are restricted to those who have a 2nd/3rd birth and examine the partial correlation between the fine paid for the 2nd/3rd birth and the chance the birth is male. All specifications include province fixed effects, a fixed-effect for the year of the previous birth, and control variables for the age and years of education of both parents. Robust standard errors clustered at the province level.
are negatively correlated with the share of parents having second or third births, but positively correlated with the fraction of these births which are male. The results are consistent with both of these predictions. The sample is restricted to parents who have not yet had a son to focus on the group of parents responsible for the female deficit observed in China, and mothers aged 35–40 who are likely to have completed their fertility.22The regressions are estimated using the mothers in this group and
their births in the 1982, 1990, and 2000 China census samples between 1964 and 2000. The sample includes parents who were bearing children prior to the policy and face a zero fine regime (1982 census sample) versus those who were subjected to the One Child Policy (1990 and 2000 census samples). This allows for a rich set of controls accounting for differences that may have varied by region in China in tastes for fertility predating the policy. As such, the parameter estimates for the fine
104 The Journal of Human Resources
rate can be thought derived from a “differences in differences” estimator, where the results are robust to time-invariant differences in fertility tastes across regions.23
In Columns 1 and 2 of Table 6, I estimate linear probability models of whether parents had a second child or third child on the log of the fine rate facing the parents and a set of control variables.24The results indicate that raising the fertility fine by
100 percent reduces the probability of a second and third birth by 10.2 percentage points and 10.2 percentage points respectively. Better educated mothers appear less likely to have an additional child following daughters, possibly reflecting weaker son preference and lower dependence on sons for elderly support. Each additional year of education reduces the probability of a second and third birth by 1.4 and 0.4 percentage points respectively. Farming families are 28.8 and 18.5 percentage points more likely to have a second and third birth respectively. This is most likely due to greater reliance among peasants for their labor, and anticipated old-age support (Wang 2006).25 In Columns 3 and 4, I estimate linear probability models for the
chance of observing a male birth after one or two daughters and the results indicate that an increase in the fine rate of 100 percent is associated with a 0.8 (significant at the 10 percent level) and 2.3 percentage point increase (significant at the 1 percent level) in the probability of a male birth respectively. The other covariates appear less important: the coefficient on mother’s education and the coefficient on the family being employed in agriculture are small in magnitude and statistically insignificant. This suggests that among those having “out of plan” fertility, the group is composed of parents who want a son. So, conditioned on the punishment (the fine), the ob-servable features of the parents are no longer very important in predicting the chance of a son. The results presented in Table 6 of these regressions also provide important information regarding potential modifications to China’s current fertility regulations. For example, the coefficients imply that if China were to lower the financial pun-ishments on second births, each percentage point decline would yield a 0.1 percent increase in fertility but lower the male fraction of births by .008 percent.
The observation that parents who have children in higher fine regimes are more likely to have a son reflects two factors operating in this context. The first is that parents who are unwilling to practice sex selection in high fine regimes are less likely to have an additional child. Therefore, higher fines are associated with higher sex ratios among those who have an additional birth. The second factor is that the higher fine reflects that these parents will have lower anticipated fertility in ways not captured by the fine. Parents who are determined to have a son in high fine
23. This follows the strategy employed by Li et al. (2005), who exploit the fact that minorities in China were generally exempt from the One Child Policy to produce a “differences-in-differences” of the policy’s impact on fertility rates.
24. I include in all specifications province fixed-effects and control variables for the mother’s age, the father’s age, and the education level of both parents, and a fixed-effect for the year of the previous birth. The fines vary over province, year, ethnic group, and whether the household is registered in an urban area. Details of the fine imputation to the census sample is described in the appendix.
Ebenstein 105
regimes will often be compelled to complete fertility earlier, and will be forced to engage in sex selection at a lower parity. In recent years, China’s fertility policy has actually tightened. Tabulations of China’s 2005 intercensal survey (1 percent national sample) indicate that the sex ratio of first births reached 108.4 (Li 2007), consistent with recent reports that officials in rural areas are increasingly unwilling to authorize second births following a daughter.
V. Conclusion
Although rapid industrialization and large changes in fertility have reshaped China in the last 40 years, sex preferences have survived the transition. In an earlier era of high fertility, they were manifested in higher stopping probabilities following sons and had a muted effect on the overall sex ratio. Today, fertility in China has slowed but the imbalance in the sex ratio has become a pressing concern and the situation appears to be worsening. Chinese government figures indicate that the female deficit has worsened since the 2000 Census, with the overall sex ratio at birth reaching 118 boys born for every 100 girls in 2005.26 Recent reports that
Chinese gangs are beginning to traffic in Vietnamese and North Korean women for would-be husbands are particularly alarming and suggest the China marriage market squeeze could become an even larger policy issue (Zhao 2003). A long history of sex preferences and the economic realities favoring sons in China make it unlikely that the problem will resolve itself by parents choosing to alter their fertility deci-sions in favor of scarce daughters. Policymakers in India should consider the ex-perience of China as they move to slow the growth of their own population.27
The lesson to policymakers in family planning is this: encouraging or forcing people to change their fertility behavior without addressing their fundamental pref-erences may have unanticipated consequences. Although the future course of Chi-nese policy is yet to be determined, the discussion has now appropriately turned to revising the current regulations (Feng 2005, Yi 2007). A relaxation in the One Child Policy could reduce the sex ratio at birth by allowing more parents to have a son without resorting to sex selection. Failure to act may prove costly for the next generation.
References
Banister, Judith. 1987. “China’s Changing Population.” Palo Alto, Calif.: Stanford Univer-sity Press.
———. 2004. “Shortage of Girls in China Today.”Journal of Population Research (21)1:20–45.
26. Report issued by Chinese State Council and Central Committee (January 2007).
106 The Journal of Human Resources
Banister, Judith, and Kenneth Hill. 2004. “Mortality in China 1964–2000.”Population Stud-ies(58)1:55–75.
Cai, Yong, and William. Lavely. 2005. “China’s Missing Girls: Numerical Estimates and Effects on Population Growth.”The China Review3(2):13–29.
Coale, Ansley. 1991. “Excess Female Mortality and the Balance of the Sexes in the Popula-tion: An Estimate of the Number of “Missing Females.”Population and Development Re-view17(3):517–23.
Coale, Ansley, and Judith Banister. 1994. “Five Decades of Missing Females in China.” Demography31(3):459–79.
China. 1982. Integrated Public Use Microdata Series-International: Preliminary Version 1.0. Minneapolis: Minnesota Population Center, University of Minnesota, 2002.
———. 1990. China Population and Information Research Center, 1 percent Sample of the 1990.
China Population Census Data, accessed from the Texas A&M University China Archive. ———. 2000. 0.10 percent Sample of the 2000 China Population Census.
Das Gupta, Monica. 2005. “Explaining Asia’s ‘Missing Women’: A New Look at the Data.”Population and Development Review31(3):529–35.
Ding, Qu Jian, and Therese Hesketh. 2006. “Family Size, Fertility Preferences and Sex Ra-tio in China in the Era of the One Child Policy: Results from NaRa-tional Planning and Re-productive Health Survey.”BMJ, May 11 [online]. Available at: http://bmj.com/ (Ac-cessed: September 3, 2007).
Ertfelt, Steven. 2006. “Study Confirms China Forced Abortion Policy Created Gender Im-balance,”Reuters News Release, August 18 [online]. Available at: http://
www.freerepublic.com/. (Accessed: August 25, 2007).
Feng, Wang. 1996. “A Decade of the One-Child Policy: Achievements and Implications.” InChina, edited by Alice Goldstein and Wang Feng, 96–116. Boulder, Co: Westview Press.
———. 2005. “Can China Afford to Continue Its One-Child Policy?” Asia Pacific Issues, East-West Center #77.
Greenhalgh, Susan. 1988. “Shifts in China’s Population Policy, 1984–86: Views from the Central, Provincial, and Local Levels.”Population and Development Review12(3):491– 515.
Greenhalgh, Susan, and E Winckler. 2005. “Governing China’s Population From Leninist to Neoliberal Biopolotics.” Stanford, Calif.: Stanford University Press.
Greenhalgh, Susan, Zhu Chuzhu, and Li Nan. 1994. “Restraining Population Growth in Three Chinese Villages, 1988–1993.”Population and Development Review20(2):365– 395.
Gu, Baochang, Feng Wang, Guo Zhigang and Erli Zhang. 2007. “China’s Local and Na-tional Fertility Policies at the End of the Twentieth Century.”Population and Develop-ment Review33(1):129–47.
Hudson, Valerie, and Andrea den Boer. 2004.Bare Branches: The Security Implications of Asia’s Surplus Male Population. Cambridge: MIT Press.
Hull, Terence. 1990. “Recent Trends in Sex Ratio at Birth in China.”Population and De-velopment Review16(1):63–83.
Jha, Prabhat Rajesh Kumar, Priya Vasa, Neeraj Dhingra, Deva Thiruchelvam, Rahim Mo-ineddin. 2006. “Low Male-to-Female Sex Ratio of Children Born in India: National Sur-vey of 11 Million Households.”Lancet#367.
Johansson, Sten, and Ola Nygren. 1991. “The Missing Girls of China: A New Demographic Account.”Population and Development Review17(1):35–51.
Ebenstein 107
Junhong, Chu. 2001. “Prenatal Sex Determination and Sex-Selective Abortion in Rural Cen-tral China.”Population and Development Review27(2):259–81.
Li, Hongbin, Zhang, Junsen, and Yi Zhu. 2005. “The Effect of the One-Child Policy on Fertility in China: Identification Based on the Differences-in-Differences.” Discussion Pa-per, Chinese University of Hong Kong.
Li, Shuzhuo. 2007. “Imbalanced Sex Ratio at Birth and Comprehensive Intervention in China.” Prepared for 4th Asia Pacific Conference on Reproductive and Sexual Health and Rights.
Lin, Ming-Jen, and Ming-Ching Luoh. 2006. “Can Hepatitis B Mothers Account for the Number of Missing Women? Evidence from Three Million Newborns in Taiwan.” Na-tional Taiwan University Faculty Working Paper.
McElroy, Marjorie, and Dennis Tao Yang. 2000. “Carrots and Sticks: Fertility Effects of China’s Population Policies.”American Economic Review90(2):389–92. Papers and Pro-ceedings of the One Hundred Twelfth Annual Meeting of the American Economic Asso-ciation.
Oster, Emily. 2005. “Hepatitis B and the Case of the Missing Women.”Journal of Political Economy113(6):1163–1216.
Oster, Emily, Gang Chen, Xinsen Yu, and Wenyao Lin. 2008. “Hepatitis B Does Not Ex-plain Male-Biased Sex Ratios in China.” Draft.
Poston, Dudley, and Karen Glover. 2005. ” Too Many Males: Marriage Market Implications of Gender Imbalances in China.” Paper presented at the 25th IUSSP World Population Conference. Tours, France. July 18–23.
Qian, Nancy. 2008. “Quantity and Quality and the One Child Policy: The Only-Child Dis-advantage on School Enrollment in Rural China.” Unpublished.
Scharping, Thomas. 2003. “Birth Control in China 1949–2000.” New York, NY: Routledge Curzon.
Sen, Amartya. 1990. “More than 100 Million Women are Missing.”New York Review of Books37(20):61–66.
Taiwan Panel Study of Family Dynamics. 1999. Office of Survey Research of Academia Sinica.
Trivers, Robert, and Dan Willard. 1973. “Natural Selection of Parental Ability to Vary the Sex Ratio of Offspring.”Science(179)4068:90–92.
Welch, Finis. 1974. “Sex of Children: Prior Uncertainty and Subsequent Fertility Behavior.” RAND Research Report R-1510-RF. Santa Monica, Calif.: Rand Corporation.
Yi, Zeng, Tu Ping, Gu Baochang, Xu Yi, Li Bohua, and Li Yongping. 1993. “Causes and implications of the recent increase in the reported sex ratio at birth in China.”Population and Development Review19(2):283–302.
Yi, Zeng. 2007. “Options for Fertility Policy Transition in China.”Population and Develop-ment Review33(2):215–46.
Zhao, Gracie Ming. 2003. “Trafficking of women for marriage in China: Policy and prac-tice.”Criminal Justice3(1):83–102.
108 The Journal of Human Resources
Appendix
I. Sex Ratios and the Rural/Urban Comparison
In Table A2, I present results that compare fertility patterns among parents in the 2000 census by rural and urban status. Columns 1 and 2 reflect that rural parents are more likely to have a second child after either a daughter or son. For example, following a daughter, 82 percent of rural parents have a second child, whereas only 23 percent of urban parents have a second child, possibly owing to harsher penalties on extra births for parents with urban registration. However, Col-umns 3 and 4 indicate that among parents who have a second child after a daughter, urban parents are morelikely to have a son, with 60 percent of births being male versus 59 percent of second births to rural parents. While the One Child Policy effectively lowers urban fertility, among those who have an additional birth, there is little difference between the behavior of rural and urban parents.
Table A1
Matched Mothers and Children (000s)—China, 1982–2000
Statistic 1982 1990 2000
Mothers 108,555 145,204 148,341
Sons 129,612 138,099 121,550
Daughters 122,685 127,008 105,464
Children per Mother 2.324 1.826 1.530
Sex Ratio of Children 1.056 1.087 1.153
Sex Ratio at Birth 1.064 1.085 1.143
Female Deficit (0–18) 0.51% 2.59% 8.37%
Source: China Census 1% sample (1982), 1% sample (1990), .10% sample (2000). Married women ages 21–40 and their children ages 0–18.
Ebenstein 109
Table A2
Fertility Patterns by Rural/Urban Status, 2000
Did you have another child? (1⳱yes)
Among those with another child, was the
next birth male? (1⳱yes)
Sex of First Child Rural Urban Rural Urban
Boy 0.649 0.159 0.489 0.501
(0.004) (0.005) (0.005) (0.016)
Girl 0.822 0.232 0.589 0.597
(0.003) (0.005) (0.004) (0.013)
Source: China 2000 Census. Sample restricted to married women ages 35–40. Notes: Urban/rural defined by hukou registration status. Standard errors in parentheses.
II. Sex Selection in India and Declining Fertility
In India, mothers face no mandated fertility limit but in recent years are choosing to have fewer children, due to many causes related to economic de-velopment, and the country has witnessed a rising sex ratio at birth due to sex selection (Jha et al. 2006). In order to examine the connection between these trends, Table A3 compares the sex ratio following daughters for mothers of different edu-cation levels who were surveyed in India’s Demographic and Health Survey (DHS). Educated Indian women prefer fewer children, which is thought to reflect higher opportunity costs of childbearing in the labor market, and a taste for child quality rather than quantity. While India has no fertility policy in place, a comparison of mothers stratified by education is similar in spirit to examining the sex ratio at birth in China for parents subject to different policy regulations.
In Table A3, the survey results for 1992 and 2006 reflect that mothers with more education appearmorelikely to have a son than those less educated.28While more
affluent women presumably have better access to sex selection technology, the skewed sex ratio for these women is consistent with an interpretation that anticipated fertility is affecting the sex selection decision. Also note that higher educated women experienced larger average fertility declines and a more marked increase in the male fraction of births between the 1992 and 2006 surveys. For example, for mothers with a high school degree, the average number of children fell from 2.16 to 1.77, and the male fraction of second births after a daughter rose from 51 percent to 58 percent. This provides further support for the hypothesis that declining fertility is in part responsible for the rising sex ratio at birth.
110
The
Journal
of
Human
Resources
Table A3
Male Fraction of Births and Total Fertility by Mother’s Education, India
India (1992) India (2006)
Parity
Sex
Combination Illiterate Primary Middle HSⳭ Illiterate Primary Middle HSⳭ
1st None 0.52 0.51 0.52 0.51 0.51 0.51 0.51 0.52 2nd One girl 0.53 0.52 0.52 0.51 0.53 0.53 0.53 0.58 3rd Two girls 0.52 0.51 0.52 0.52 0.53 0.55 0.58 0.70 4th Three girls 0.52 0.53 0.57 0.62 0.52 0.59 0.62 0.75 Total Fertility Rate 3.32 3.02 2.52 2.16 3.34 2.82 2.28 1.77
Ebenstein 111
III. Calculating the Fines for Excess Fertility in China
The fertility policy in China is enforced by a complex system of financial disincentives for excess fertility, including reduction of land allotments, denial of public services, and fines for unauthorized births. The fines represent the critical variable in the model’s estimation, and they are taken from Scharping (2003). The complete record of the published fine rates collected by Scharping are listed in Table A4, and they reflect wide variation in the punishments on excess fertility across province and year. While comprehensive fine rates for this period are not publicly available, a good deal of information regarding the strength of enforcement across regions, time, and ethnicity is available from smaller-scale surveys conducted during this period.29The algorithm used to combine these sources of information to
impute the fine rates is described below, and the corresponding STATA code and data are available for download at the author’s website.30
During the 1980s, the provincial regulations reflect that the vast majority of prov-inces collected the fine from wage earners in the form of regular deductions (Scharp-ing 2003). For fines levied as wage deductions, I calculate the present value of the deduction at a 2 percent discount rate yielding a single amount of the fine in years of income. For example, in February 1980 Guangdong province ratified a fine of 10 percent of income from each parent for 14 years for an unsanctioned birth, which in my data is calculated as having a present value of 1.21 years of income. In the 1990s, fines began to be levied as a share of annual income, partly in response to difficulties in collections as fewer workers rely on the state for their livelihood. For example, Shanghai reported in 1981 that an unauthorized birth carried a 10 percent wage deduction from both parents for 16 years. In 1992, this amount was raised to an immediate payment of three years of household income. When provinces report a specific deduction as a share of annual income, like Shanghai, the fine variable used in the analysis is taken directly from these provincial regulations. For nonwage workers, such as the peasantry following decollectivization, I am forced to assume the fines were in proportion to the published rates on wage-earners.31
I use the published fine rates in Appendix Table A4 and aforementioned impu-tation procedure to create a data set of fine rates by province and year for 1979– 2000. For provinces in which no fine information is available for 1979, I assume that each province instituted a baseline fine of 10 percent deductions for 14 years in 1979, consistent with historical accounts for the provinces for which regulations are available. When a province discloses their policy, I assume that the explicit
29. The China Health and Nutrition Survey has fine data for 1989, 1991, and 1993, but the rates are only for a small number of communities (156 in 1989) in several provinces. As described in this appendix, the information in the CHNS is used to guide imputation of the fines to the national census.
30. http://pluto.mscc.huji.ac.il/⬃ebenstein/
112
The
Journal
of
Human
Resources
Table A4
Monetary punishments for excess fertility, China 1979–2000
Province First Report Second Report Third Report Fourth Report Fifth Report
Beijing 1982: 7Y, 10% 1991: 1Y, 500% Tianjin 1988: 5Y, 20% 1997: 5Y, 20%
Hebei 1982: 14Y, 10% 1989: 1Y, 250% 1997: 1Y, 250% Shanxi 1982: 7Y, 15% 1986: 7Y, 25% 1989: 7Y, 20% Inner Mongolia 1982: 14Y, 10% 1995: 1Y, 200%
Liaoning 1979: 14Y, 10% 1980: 14Y, 10% 1988: 14Y, 10% 1992: 1Y, 500% 1997: 1Y, 500% Jilin 1988: 1Y, 30%
Heilongjiang 1982: 14Y, 10% 1983: 1Y, 120% 1989: 14Y, 10%
Shanghai 1981: 16Y, 10% 1982: 3Y, 10% 1992: 1Y, 300% 1995: 1Y, 300% 1997: 1Y, 300% Jiangsu 1982: 10Y, 10% 1990: 1Y, 300% 1995: 1Y, 300% 1997: 1Y, 300%
Zhejiang 1982: 7Y, 5% 1985: 5Y, 15% 1989: 5Y, 50% 1995: 5Y, 50% Anhui 1979: 14Y, 5% 1988: 7Y, 10% 1992: 7Y, 10% 1995: 7Y, 10% Fujian 1982: 14Y, 5% 1988: 7Y, 20% 1991: 1Y, 300% 1997: 1Y, 300% Jiangxi 1997: 1Y, 300%
Shandong 1996: 1Y, 100%
Henan 1982: 7Y, 15% 1985: 7Y, 15% 1990: 7Y, 30%
Hubei 1979: 14Y, 10% 1987: 5Y, 20% 1991: 5Y, 60% 1997: 5Y, 60% Hunan 1979: 14Y, 5% 1982: 5Y, 10% 1989: 1Y, 200%
Guangdong 1980: 14Y, 10% 1986: 7Y, 20% 1992: 1Y, 350% 1998: 1Y, 350% Guangxi 1994: 1Y, 500%
Ebenstein
113
Chongqing 1997: 1Y, 300%
Sichuan 1984: 7Y, 5% 1987: 7Y, 20% 1997: 7Y, 30% Guizhou 1984: 14Y, 10% 1998: 1Y, 500%
Yunnan 1986: 1Y, 10% 1990: 7Y, 40% 1997: 7Y, 40% Tibet 1986: 1Y, 30% 1992: 1Y, 50%
Shaanxi 1981: 7Y, 10% 1982: 7Y, 10% 1986: 7Y, 10% 1991: 7Y, 30% 1997: 7Y, 30% Gansu 1982: 10Y, 10% 1985: 10Y, 10% 1989: 7Y, 30% 1997: 7Y, 30%
Qinghai 1982: 7Y, 10% 1986: 7Y, 10% 1992: 7Y, 25% Ningxia 1982: 14Y, 10% 1986: 14Y, 10% 1990: 14Y, 30% Xinjiang 1988: 7Y, 10% 1991: 14Y, 30%
114 The Journal of Human Resources
policy of the new fine is constant for the remainder of the period. For every province, I have a direct observation of the size of the fine for at least one point in time.
In recent years, several provinces have moved to a system of enforcement which provides greater latitude to local officials in assessing the appropriate fertility fine. For example, in Beijing fines are assessed as “social support fees” for an unautho-rized birth and the regulations indicate that the fine is assessed as an amount between 5,000 and 50,000 yuan. In these circumstances, I am forced to impute the fine with the fine charged by other provinces within the same fertility policy region (discussed below) for which I have reliable measures of the fine amount as a share of income.32
As discussed in the text, while unauthorized births are subject to severe fines, parents in certain circumstances are granted authorization for a second child, and these births carry milder financial consequences. Gu et al. (2007) classify each of the 31 provinces and autonomous regions of China into a one-, 1.5-, or two-child zone, which broadly classifies the average number of children allowed to each cou-ple. For parents in the one-child zone, I presume that the entire value of the fine is levied on all second births. Parents in the 1.5-child zone who have a first-born daughter are in many (but not all) localities eligible for a second child permit. Local variability in the policy is unobserved in the census data but known to be important (Mcelroy and Yang 2000). For example, the China Health and Nutrition Survey (CHNS) documents that in Hubei province (classified in the 1.5-child zone) Han couples with a first-born daughter were not allowed a second child in five out 24 villages in the 1993 survey, and so I approximate this phenomenon with a fine rate of 25 percent of the baseline fine. For parents living in the two-child policy zone and minority parents, I apply a fine equal to 10 percent of the provincial fine rate, to attempt to capture the closer to universal permits on second births to these parents. This value is chosen since all parents were eligible for a one-child bonus, and the CHNS reflects that the average annual one-child bonus (roughly 100 yuan) was approximately 10 percent of the average fine (roughly 1,100 yuan) in the villages sampled.
I also adjust upward the penalty on third births in the one- and 1.5-child zone to account for the premium punishments applied to couples that had a third child. Most provinces report more severe wage deductions or fines for third births, such as Shanghai which doubled the standard fine associated with a second birth. For parents within the one-child zone, I assign a 100 percent premium to the punishment for a third birth relative to the base fine. The markup of 100 percent is chosen consistent with the reported policy in Zhejiang, Shanghai, Jiangsu, and Beijing, each of which explicitly dictated punishments on 3rd births to be twice the fine on 2nd births. For parents in the 1.5-child zone, I assign a 50 percent premium to a third birth, since this will only be the first unauthorized birth for many of these families. For minorities and residents of the two-child zone, the fine on a third birth is equal to 50 percent of the provincial fine rate. This roughly matches the average difference in fines
Ebenstein 115
observed in the CHNS (1993), which indicates that the average fine was twice as large in areas where all couples are allowed a second child.33
The fine relevant for the analysis should be theeffectivefine, which would account for variability in the enforcement of fines. While in urban areas the fines are easily enforced, and excess fertility can be punished with the denial of state services, this is not always the case in the rural areas.34As such, I raise the fine assumed to apply to all individuals registered in an urban hukouan extra 50 percent spike to both second and third births in all zones. This partly based on Scharping’s calculation that roughly half of all levied fines were collected, and so as an approximation between full collections and no collections, I raise the urban fine rate by 50 percent. The second justification is that I attempt to reconcile my fine distribution with data in Gu et al. (2007) on policy fertility.35They have access to more detailed data and
can observe the large concentration of state workers in urban areas (who are subject to stricter rules and harsher punishments) and they produce a distribution of fines similar to those used in my analysis.
33. Author’s calculations from the 1993 CHNS community survey (1,950 versus 3,900 yuan). 34. Scharping writes that before China began liberalizing its economy “[T]ight state control of the urban economy made enforcement of these measures relatively easy.” In recent years, the cities have experienced more difficulty deducting wages, but urban residents continue to be more reliant on social services and are therefore subject to more effective enforcement of the policy. pp. 136.