T H E J O U R N A L O F H U M A N R E S O U R C E S • 45 • 4
School Desegregation and
Educational Attainment for Blacks
Sarah J. Reber
A B S T R A C T
This paper assesses the effects of school desegregation on its intended benefi-ciaries: black students. In Louisiana, substantial reductions in segregation between 1965 and 1970 were accompanied by large increases in per-pupil funding, which allowed funding in integrated schools to be “leveled up” to the level previously experienced only in white schools. Desegregation also brought increased exposure of blacks to whites. Analysis of new data on lev-els of segregation, resources and educational attainment from 1960–75 sug-gests that the increase in funding associated with desegregation improved educational attainment for blacks. A 42 percent increase in funding led to a 15 percent increase in high school graduation rates, and the estimated pres-ent value of the additional education exceeded the additional cost.
I. Introduction
The Supreme Court’s 1954 decision inBrown v. Board of Educa-tion—and the desegregation of schools that followed—was perhaps the most im-portant development in U.S. education policy of the last century. Before Brown, Southern schools were explicitly and completely segregated by law, and many blacks attended schools that received fewer resources than those attended by their white counterparts.1 Previous work has shown that desegregation policy reduced
segre-1. The Coleman Report (1966) and Card and Krueger (1992) suggest that black-white school resource gaps had closed substantially over the first half of the 20th century but were still present. According to Card and Krueger (1992), in 1954 the average student-teacher ratio was about 10 percent higher for blacks in Southern and Border states, compared to their white counterparts. Data for Louisiana show that in 1955 the average district’s instructional spending for blacks was only about 71 percent of instructional spending for whites.
Sarah J. Reber is an assistant professor of public policy and the University of California, Los Angeles, School of Public Affairs and a faculty research fellow at the National Bureau of Economic Research. The author is grateful to Ken Chay, Nora Gordon, Seema Jayachandran, and two anonymous referees for helpful discussions and advice, to Cyrus Kosar for research assistance and to the Louisiana Depart-ment of Education, Louisiana State Library, and New Orleans Public Library for assistance in compil-ing the data. The data used in this article can be obtained beginncompil-ing June 2011 through May 2014 from Sarah Reber, UCLA School of Public Affairs, sreber@ucla.edu.
[Submitted May 2009; accepted September 2009]
gation and increased blacks’ exposure to whites in school. In the case of Louisiana, school desegregation also was accompanied by dramatic changes in the state’s sys-tem of school finance that, together with large increases in federal funding, substan-tially increased the average spending for the schools blacks attended. Desegregation in Louisiana eliminated black-white gaps in student-teacher ratios within districts. Historically, those gaps had been largest in districts with high black enrollment shares, so blacks in such districts saw particularly large improvements in resources over the short period when schools desegregated; on the other hand, blacks in those districts saw smaller increases in exposure to whites.
In this paper, I examine the effects of the dramatic changes that desegregation brought to Southern blacks’ schools on educational attainment using newly collected data on Louisiana school districts. I use variation in the intensity of school deseg-regation related to school districts’ initial black enrollment share to identify its ef-fects. Because changes in spending and exposure are both so closely tied to the black enrollment share (positively and negatively, respectively), I cannot separately identify the effects of these two factors. Instead, I estimate the net effect of deseg-regation-induced changes in funding and peers.
The results indicate that the rate of continuing to the 11th and 12th grade and graduating from high school increased more in higher black enrollment share dis-tricts after desegregation, suggesting that the additional funding that came with de-segregation was more important than increased exposure to whites in increasing black educational attainment.2A 42 percent increase in funding led to a 15 percent
increase in high school graduation rates, and a rough cost-benefit calculation suggests that additional spending had positive net present value. The results are consistent with earlier studies suggesting beneficial effects of school desegregation for blacks (Boozer, Krueger, and Wolkon 1992; Guryan 2004; Ashenfelter, Collins, and Yoon 2006).
II. Background and Previous Literature
A. Desegregation Policy and Trends in Segregation
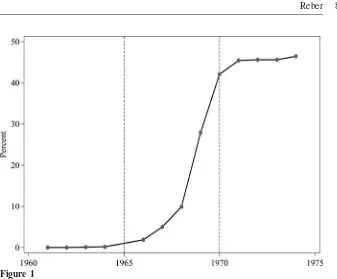
Figure 1 shows trends in black exposure to whites for Louisiana schools, which were similar to trends in other states of the former Confederacy. Black exposure to whites can be interpreted as the white enrollment share of the average black’s school. The data reveal three major turning points for segregation corresponding to changes in legislation and the courts’ interpretation of the Brown decision. There was little desegregation before 1965 (all years refer to the fall of the school year). In 1964, only about 1 percent of black students statewide were in school with any whites, and 64 of 67 districts in Louisiana still had completely segregated schools. Following enactment of the 1964 Civil Rights Act (CRA) and the 1965 Elementary and Sec-ondary Education Act (ESEA), many Louisiana districts took their first steps towards
Reber 895
Figure 1
Black Exposure to Whites for Louisiana Counties, 1960–74
Notes: Authors calculations from Southern Education Reporting Service data (1960–66) and Office of Civil Rights Surveys (1967–74).
desegregation.3By 1968, only one district in Louisiana was still completely
segre-gated but the average black was still in a school that was only about 16 percent white, while the average district was more than 60 percent white. Finally, following a 1968 Supreme Court decision,4larger-scale desegregation plans were required. By
1970, the average black Louisianan was in a school that was more than 30 percent white, and segregation stayed around that level through at least 1976.
B. Desegregation and Black Educational Attainment: Mechanisms
Desegregation could increase the return to schooling—and thus educational attain-ment—by changing school quality for blacks through two main channels. First, de-segregation increased blacks’ exposure to whites in schools. White peers are typi-cally assumed to have a positive effect on outcomes, in part because whites tended to have higher socioeconomic status and better scores on achievement tests, but more white peers could be good or bad for school quality from blacks’ perspective. Sec-ond, desegregation changed average spending—and possibly other, less-tangible aspects of school quality—in schools blacks attended by moving them to
higher-3. See Card and Krueger (1992); Boozer et al (1992); Cascio et al. (2008); Cascio et al. (2010) for more discussion of the role of CRA and ESEA.
spending formerly white schools. In the case of Louisiana, desegregation also in-creased overall average school spending so that spending could be equalized by “leveling up” to the levels previously experienced only in white schools.
It is worth noting that the relationship between time exposed to the treatment and the size of the treatment effect may be different depending on whether the outcome is attainment or achievement (measured, for example, by test scores). Effects on achievement are likely to be cumulative in nature and larger for cohorts that are exposed to the new policies longer, whereas effects on attainment may not increase over time. If the policies considered here increased the return to education for blacks in all grades, we should see immediate changes in attainment for cohorts at risk of dropping out, regardless of how long they have been treated. Consider an 11th grader who is deciding whether to attend 12th grade. Postdesegregation, the quality of education in 12th grade is improved, so the return to 12th grade is higher. How the “treatment effect” relates to total exposure to the treatment is ambiguous: On the one hand, having been exposed to better schools in the past may make 12th grade more valuable; on the other hand, it may mean that diminishing marginal returns have set in and 12th grade is less valuable.
C. Previous Literature: The Effects of Desegregation on Education Outcomes
A number of large-scale studies have examined the relationship between the racial composition of students’ schools or classes and educational outcomes. But these studies have not focused on changes in racial composition due to desegregation policy, as opposed to self-selection into districts with different racial composition. TheEquality of Educational Opportunitystudy, also known as the Coleman Report (1966), was the first to document a negative relationship between being in predom-inately black schools and lower student test scores. Rivkin (2000) similarly finds that students who went to schools with higher black enrollment shares had lower test scores, educational attainment, and earnings.
A number of studies have examined the effects of desegregation policies in a particular district or a small number of districts, and have come to varying conclu-sions about its benefits.5 Boozer et al. (1992) focus on policy-induced changes in
racial composition, instrumenting for the racial composition of schools with an in-teraction of the state where an individual grew up and whether they went to high school after 1964. They show that blacks who attended segregated high schools had lower educational attainment and lower wages; the samples are small, however, and the estimates are imprecise. Guryan (2004) provides the best-identified effects of desegregation plans, exploiting variation in the timing of implementation of plans across districts to assess the effects of desegregation on black high school dropout rates for a national sample of large school districts implementing court-ordered de-segregation plans. He estimates that implementation of a dede-segregation plan reduced dropout rates for blacks by about three percentage points. This paper complements Guryan’s by using a different methodology and source of variation to examine the effects of desegregation on educational outcomes.
Reber 897
A related literature examines the effects of changes in resources in blacks’ schools for the period before desegregation. Card and Krueger (1992, 1996a) conclude that improvements in resources in the black schools relative to white schools in the pre-Brownyears helped narrow the white wage gap. This paper shows that black-white school quality gaps persisted in Louisiana after the period examined by Card and Krueger and examines the effects of the virtual elimination of these gaps due to desegregation in the late 1960s.
III. Mechanisms: Effects of Desegregation on Peers
and Resources
Desegregation had dramatic effects on the characteristics of black Louisianans’ schools. The two major classes of inputs—peers and resources— changed significantly statewide, but blacks in high black enrollment share districts sawsmallerincreases in exposure to whites butlargerincreases in resources in their schools. That changes in blacks’ exposure to whites upon desegregation would vary with the black enrollment share is straightforward, as even if schools within districts are integrated, blacks will not be exposed to as many whites if there are not many whites in their district.
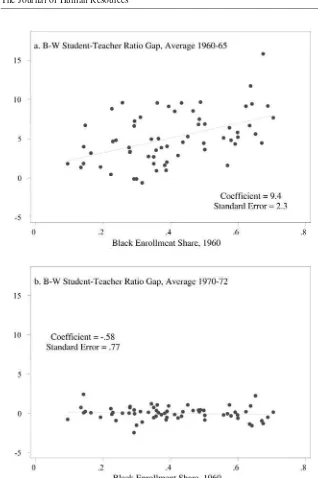
The positive relationship between black enrollment share and changes in resources arose due to the predesegregation system of school finance in the South. State gov-ernments distributed aid on a roughly per-pupil basis, without regard to race; but whites in districts with large black populations directed state money allocated for black students to white schools, generating large black-white resource gaps (as mea-sured by the student-teacher ratio, for example). Figure 2a shows the positive rela-tionship between black-white student-teacher ratio gaps and black enrollment share before desegregation.6Figure 2b shows that those gaps were largely eliminated after
desegregation, and the relationship with black enrollment share disappeared. Because preexisting black-white gaps were larger in higher black enrollment share districts, blacks in those districts saw larger improvements in the student-teacher ratios as a result of equalization due to desegregation.
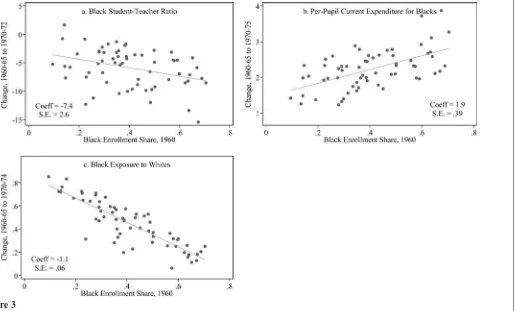
Figure 3 summarizes how changes in educational inputs around the time of de-segregation related to initial black enrollment share graphically; regressions pre-sented below show that these relationships are robust to the inclusion of controls for preexisting district characteristics. Panels A and B show two measures of resources: current expenditure and student-teacher ratios. As schools desegregated, blacks in high black enrollment share districts saw bigger reductions in student-teacher ratios and larger increases in current expenditure compared to their black counterparts in low black enrollment share districts.7Panel C shows the strong, negative relationship
between initial black enrollment share and the change in exposure to whites.
Figure 2
Black-White Student-Teacher Ratio Gaps vs. Black Enrollment Share, Before and After Desegregation
Reber
899
Figure 3
Changes in Resources and Peers vs. 1960 Black Enrollment Share
IV. Methods and Data
A. Empirical Approach
Changes in outcomes are expected to depend on changes in resources in blacks’ schools and changes in blacks’ peers, suggesting an estimating equation with the following basic form:
Doutcome⳱␣Ⳮ␣DresourcesⳭ␣Dpeers Ⳮε ,
(1) c 0 1 c 2 c c
where c indexes county8 andDoutcome is the change in the outcome of interest
around the time of desegregation, Dresources is a measure of the change in re-sources (for example, the change in student-teacher ratios), andDpeersis a measure of the change in peers, such as the exposure of blacks to whites;ε is an error term.9
c
In practice, because both the change in resources and the change in peers are so closely tied to the initial black enrollment share, I cannot separately identify their effects.10This is an important limitation of the analysis. Still, examining the
reduced-form relationship between outcomes and initial black enrollment share can shed some light on the effects of desegregation policy overall and the potential mecha-nisms.
I therefore examine how changes in educational attainment relate to initial black enrollment share. Whether blacks in higher black enrollment share districts are ex-pected to increase their educational attainment more or less as a result of desegre-gation depends on whether exposure to whites (who probably also had higher achievement) or exposure to more resources is more important.11The simplest
spec-ification relates the change in attainment from before to after desegregation to the initial black enrollment share. In this case, the dependent variable of interest is simply the average outcome for 1970–75, less the average outcome for 1960–65
(omitting the transition years): .
1975 1965
1 1
Doutcomec⳱
兺
outcomectⳮ兺
outcomect6t⳱1970 6t⳱1960
The most basic specification is a univariate regression (the regression analog to the graphs presented for changes in inputs in Figure 3):
Doutcome⳱Ⳮ1960fractionblackⳭε ,
(2) c 0 1 c c
8. Because the Census and voting data are available only at the county level, I aggregate district-level data on enrollment, teachers, and finances for the three city districts with their respective counties and conduct the analysis at the county level. Results are similar if these districts are instead excluded. Cameron Parish had substantial revenue from oil reserves and is an extreme outlier in funding and student-teacher ratios; the district is excluded from the analysis.
9. The district-level data for the analysis were taken primarily from annual administrative reports of the Louisiana Department of Education and county tabulations of the Census. More details on construction of the data are available from the author.
10. The problem is exacerbated by the fact that the change in peers is better measured than the change in resources so that the relationship between initial black enrollment share and outcomes loads onto the change in peers (change in black exposure to whites).
Reber 901
where Doutcome is described above, 1960fractionblack is the black share of en-rollment for county cin 1960.12If changes in resources were more important than
changes in exposure to whites, 1is expected to be positive and vice versa if ex-posure to whites is more important than funding. If blacker districts had systemati-cally different initial continuation rates, the share of students on the margin to be affected by the policy might differ. Fortunately, blacks’ initial educational attainment as measured by continuation rates in the early 1960s was not significantly related to black enrollment share.13
If initial black enrollment share is correlated with other factors related to changes in continuation rates, differential changes in attainment for high and low black en-rollment share districts cannot be attributed to desegregation. Indeed, some district characteristics were related to black enrollment share: Blacks in blacker districts had lower median income and were significantly less likely to be registered to vote; blacker districts also had higher poverty rates (proxied by the share of households without complete plumbing) and were more rural.
To address these concerns, I include controls for key characteristics of counties that might be related to both 1960fractionblackandchangesin attainment in some specifications. To account for the possibility that changes during the period of de-segregation are simply a continuation of past trends, I control for the change in per-pupil instructional expenditure for blacks from 1955 to 1959. To account for the possibility that blacks with different socioeconomic status might be on different educational attainment trajectories, I control for several proxies for SES of blacks and the population of the county as a whole from the 1960 Census (nonwhite median income, nonwhite median education, percent of households with complete plumbing, and the percent of population living in urban areas). Because black participation in politics increased following the passage of the Voting Rights Act, I also control for the share of the black voting age population registered to vote in 1960 and the change from 1964 to 1968.14Finally, the availability of employment may influence
school enrollment decisions, so I control for the log change in total employment from 1963 to 1970–75. These controls generally do not affect the coefficient of interest.15
If differential changes in attainment by black enrollment share are caused by changes in schools related to desegregation, we would expect the changes in attain-ment to be closely timed with the observed differential changes in black exposure to whites and funding. To observe the timing of differential changes in attainment by black enrollment share, I estimate equations of the following form:
outcome ⳱Ⳮ1960fractionblack⳯␥Ⳮ ,
(3) ct t c t ct
12. Results are similar if the black enrollment share from another year is used. I use data from 1960 because it is early enough that it is unlikely to have been influenced by desegregation.
13. This is somewhat surprising in light of the inequities in spending before desegregation. 14. I am grateful to Jim Alt for providing the voting data; see Alt (1995).
where1960fractionblackis the 1960 black enrollment share (as above) and separate intercepts ( ) and coefficients ( ) are estimated for each year between 1960 andt ␥t 1975. If␥tis increasing witht, this indicates that attainment grew faster in higher black enrollment share districts over time, and vice-versa if␥ is declining witht.16
t
Two factors limit my ability to assess the timing of changes in black educational attainment precisely. The annual attainment data are noisy, so year-to-year changes are not as precisely estimated as the differences in averages over longer periods. In addition, exactly how the policy is expected to affect trends in attainment is not clear ex ante. Outcomes maylagchanges in schools, but changes in outcomes should not leaddesegregation. I do not, therefore, impose a particular functional form on trends in the fraction black coefficient over time. I present the results graphically after the main findings.
B. Measuring Educational Attainment
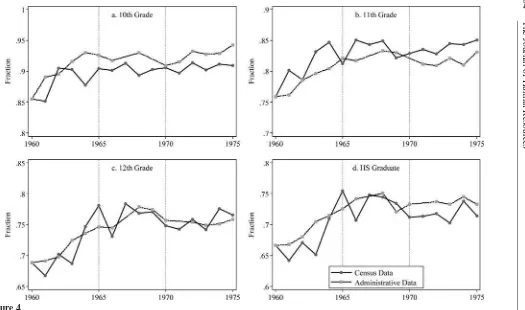
High-frequency individual-level data with county identifiers on completed attainment or school enrollment status are unavailable for this period. A proxy for the dropout rate for each cohort-district-year can be created using Louisiana administrative data on the number of students enrolling in school by grade, district, year, and race. To check the validity of the attainment estimates, I first present estimates of state-wide trends in the educational attainment variables for 1960–75 based on the Louisiana administrative data and compare these to trends estimated from the 1980 Census IPUMS. I use the same methodology to estimate educational attainment variables at the district level using the administrative data.
If families did not move into or out of the state (and there were no mortality), I could infer the share of each cohort continuing to each grade by following a cohort through its entire school career, estimating dropout rates at every grade. For example, for the cohort entering first grade in the fall of 1961, first grade data would be taken from the 1961 report, second grade data from the 1962 report, and so on; the share of the cohort reaching at least 12th grade would be the ratio of 12th grade registration in 1972 to first grade registration in 1961. To reduce the scope for movements in and out of state to affect the estimated 12th grade enrollment rates, I divide 12th grade registration by eighth grade registration four years prior, assuming that there is no “true” dropping out until after the fall of eighth grade.17I refer to the share
of a cohort that registers for 12th grade as the 12th grade “continuation rate,” and similarly for tenth and 11th grade; the estimated share of a cohort completing high school is referred to as the graduation rate.18
16. Similar to Equation 2, controls for preexisting characteristics of counties could be included by esti-mating a separate coefficient on each characteristic for each year (or groups of years). Because the control variables have little substantive effect on the coefficients, I do not present the results.
17. Dropping out before eighth grade was relatively rare for blacks in the affected cohorts: Three percent of black Louisianans born between 1942 and 1957 report a highest grade attained of less than eight years in the 1980 Census. This also assumes that patterns of grade repetition are not changing over time. 18. The continuation rates for tenth, 11th, and 12th grades are calculated as follows: ,
10 , and , where is total black registration for gradegin yeart. 11
regt regt12
11 12 g
contratet⳱ 8 contratet⳱ 8 regt
Reber 903
Figure 4 compares trends in continuation rates calculated from the administrative data to trends in the fraction of blacks born in Louisiana who attendedat least some 10th, 11th, and 12th grade or graduated from high school according to the 1980 Census IPUMS.19The two sources track reasonably well at the state level, especially
for 12th grade continuation rate and the high school graduation rate.20County-level
continuation rates are likely more subject to error associated with migration, com-pared to the state-wide trends. However, if those movements arenot correlated with initial black enrollmentshare, migration will not bias estimates of the coefficient on 1960fractionblack, but will simply introduce classical measurement error to the de-pendent variables.
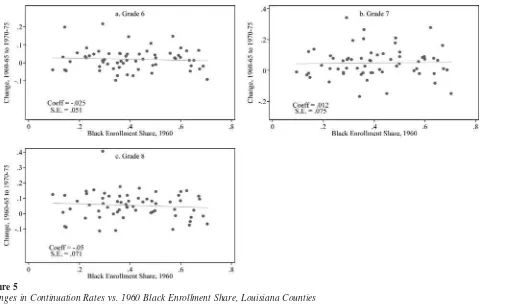
If there is no true dropping out among younger children and families with younger and older children migrate similarly, continuation rates for younger children can be used to assess whether mobility is correlated with black enrollment share.21Figure
5 show that changes in continuation rates and initial black enrollment share are not correlated for lower grades. Estimating Equation 2 with changes in the low grade continuation rates, the coefficients on initial black enrollment share are not signifi-cantly different from 0 for any of the grades or specifications. The results for lower grade continuation rates do not show evidence of differential mobility by black enrollment share, suggesting this is an appropriate method for measuring educational attainment in this context.
V. Results
A. Changes in Resources and Peers
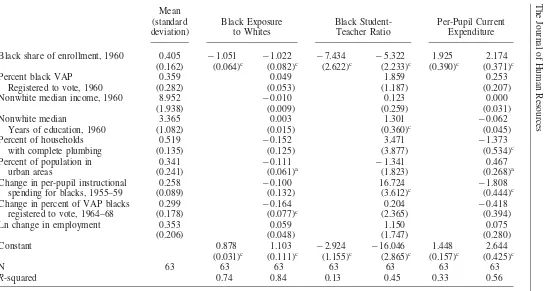
Table 1 shows the results of estimating Equation 2, with and without controls, with changes in black exposure to white, the black student-teacher ratio, and the change in per-pupil current expenditure for blacks as dependent variables. The estimates confirm that the results shown in Figure 3 are robust to including controls. The first column shows the mean and standard deviation for the control variables. The re-gression of the change in black exposure on1960fractionblackshows a strong
neg-The 10th grade continuation rate is the share of eighth graders who registered for tenth grade in the fall, so this is a proxy for the share whocompleted at leastninth grade, the 11th grade continuation rate proxies the share who completed at least 10th grade and so on.
19. To reduce noise in the data, the continuation rates plotted in Figure 4 are net of the average continuation rate for fifth through eighth grades. For example, the 12th grade net continuation rate isnetcontrate12⳱
t
The
Journal
of
Human
Resources
Figure 4
Trends in Black Educational Attainment in Louisiana from Administrative and Census Data
Reber
905
Figure 5
Changes in Continuation Rates vs. 1960 Black Enrollment Share, Louisiana Counties
The
Journal
of
Human
Resources
Mean (standard deviation)
Black Exposure to Whites
Black Student-Teacher Ratio
Per-Pupil Current Expenditure
Black share of enrollment, 1960 0.405 ⳮ1.051 ⳮ1.022 ⳮ7.434 ⳮ5.322 1.925 2.174
(0.162) (0.064)c (0.082)c (2.622)c (2.233)c (0.390)c (0.371)c
Percent black VAP 0.359 0.049 1.859 0.253
Registered to vote, 1960 (0.282) (0.053) (1.187) (0.207) Nonwhite median income, 1960 8.952 ⳮ0.010 0.123 0.000
(1.938) (0.009) (0.259) (0.031)
Nonwhite median 3.365 0.003 1.301 ⳮ0.062
Years of education, 1960 (1.082) (0.015) (0.360)c (0.045)
Percent of households 0.519 ⳮ0.152 3.471 ⳮ1.373 with complete plumbing (0.135) (0.125) (3.877) (0.534)c
Percent of population in 0.341 ⳮ0.111 ⳮ1.341 0.467 urban areas (0.241) (0.061)a (1.823) (0.268)a
Change in per-pupil instructional 0.258 ⳮ0.100 16.724 ⳮ1.808
spending for blacks, 1955–59 (0.089) (0.132) (3.612)c (0.444)c
Change in percent of VAP blacks 0.299 ⳮ0.164 0.204 ⳮ0.418 registered to vote, 1964–68 (0.178) (0.077)c (2.365) (0.394)
Ln change in employment 0.353 0.059 1.150 0.075
(0.206) (0.048) (1.747) (0.280)
Constant 0.878 1.103 ⳮ2.924 ⳮ16.046 1.448 2.644
(0.031)c (0.111)c (1.155)c (2.865)c (0.157)c (0.425)c
N 63 63 63 63 63 63 63
R-squared 0.74 0.84 0.13 0.45 0.33 0.56
Notes: Huber-White heteroskedasticity-adjusted robust standard errors in parentheses. a. Significant at the 10 percent level.
Reber 907
ative relationship between black enrollment share and black exposure to whites, with an estimated coefficient of -1.05; controls for preexisting characteristics have little effect on the coefficient. The second set of results show that a ten percentage point increase in 1960fractionblack is associated with an additional reduction in black student-teacher ratio of 0.74 (first column); the inclusion of controls reduces the estimates (in absolute value) by about a quarter. A ten percentage point increase in 1960fractionblackis associated with an additional increase in per-pupil current ex-penditure of about $200. (The standard deviation of black enrollment share is about 16 percentage points.)
B. Main Results: Continuation Rates for Older Grades
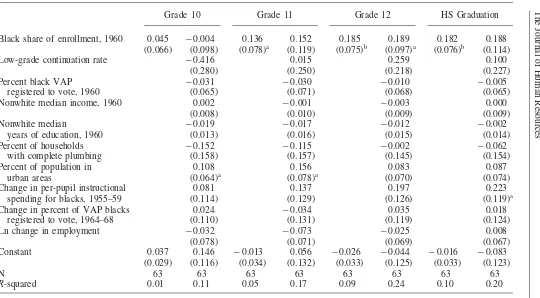
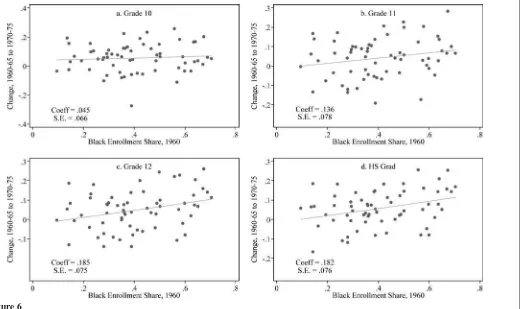
To test the hypothesis that the continuation rates rose differentially by 1960frac-tionblack, I estimate Equation 2 for the upper grades; I also plot the change in continuation rates against initial black enrollment share in Figure 6. The results, with and without controls are presented in Table 2. Figure 6 and the point estimates in Table 2 indicate that black educational attainment increased more in districts with higher 1960fractionblack. Without controls, the coefficients on 1960fractionblack indicate that a ten percentage point increase in 1960fractionblack was associated with a 1.4, 1.9, and 1.8 percentage point larger increase in the continuation rates for 11th grade, 12th grade, and high school graduation, respectively; the estimated co-efficients are statistically significantly different from zero at the 10 percent level for 11th grade and at the 5 percent level for 12th grade and high school graduation. The coefficient for the 10th grade continuation rate is relatively small and statistically insignificant. The controls reduce precision but do not substantially affect the co-efficient estimates.22 High black enrollment share districts saw larger increases in
educational attainment during the period of desegregation.
C. Timing
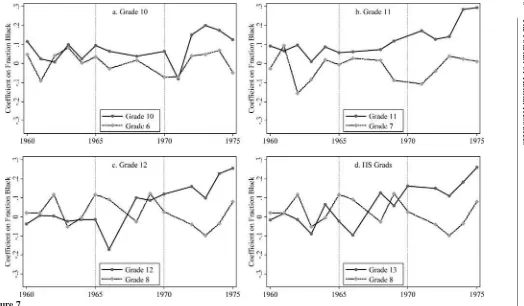
Closer examination of the timing suggests that the differential improvements in educational attainment among blacks in high black enrollment share districts were concentrated between 1967 and 1971, consistent with a causal effect on attainment of increased funding around the same time. The first panel of Figure 7 shows the results of estimating Equation 3 for the 10th grade continuation rate and plotting the interactions of1960fractionblackwith the year dummies. For comparison, I also plot the results for the sixth grade continuation rate (sixth grade registration divided by fourth grade registration two years prior). The remaining panels of Figure 7 show the results for the 11th and 12th grade continuation and high school graduation rates, with the relevant low-grade comparison groups. First, Figure 7 shows that for none of the younger grade continuation rates is a trend in the coefficients evident, con-firming that blacks’ mobility was not correlated with initial black enrollment share. Figure 7 also shows that the coefficient on black enrollment share in the predese-gregation period is close to zero for the upper grade continuation rates; that is, blacks
The
Journal
of
Human
Resources
Grade 10 Grade 11 Grade 12 HS Graduation
Black share of enrollment, 1960 0.045 ⳮ0.004 0.136 0.152 0.185 0.189 0.182 0.188
(0.066) (0.098) (0.078)a (0.119) (0.075)b (0.097)a (0.076)b (0.114)
Low-grade continuation rate ⳮ0.416 0.015 0.259 0.100
(0.280) (0.250) (0.218) (0.227) Percent black VAP ⳮ0.031 ⳮ0.030 ⳮ0.010 ⳮ0.005
registered to vote, 1960 (0.065) (0.071) (0.068) (0.065) Nonwhite median income, 1960 0.002 ⳮ0.001 ⳮ0.003 0.000
(0.008) (0.010) (0.009) (0.009) Nonwhite median ⳮ0.019 ⳮ0.017 ⳮ0.012 ⳮ0.002
years of education, 1960 (0.013) (0.016) (0.015) (0.014) Percent of households ⳮ0.152 ⳮ0.115 ⳮ0.002 ⳮ0.062
with complete plumbing (0.158) (0.157) (0.145) (0.154) Percent of population in 0.108 0.156 0.083 0.087
urban areas (0.064)a (0.078)a (0.070) (0.074)
Change in per-pupil instructional 0.081 0.137 0.197 0.223 spending for blacks, 1955–59 (0.114) (0.129) (0.126) (0.119)a
Change in percent of VAP blacks 0.024 ⳮ0.034 0.035 0.018
registered to vote, 1964–68 (0.110) (0.131) (0.119) (0.124) Ln change in employment ⳮ0.032 ⳮ0.073 ⳮ0.025 0.008
(0.078) (0.071) (0.069) (0.067) Constant 0.037 0.146 ⳮ0.013 0.056 ⳮ0.026 ⳮ0.044 ⳮ0.016 ⳮ0.083
(0.029) (0.116) (0.034) (0.132) (0.033) (0.125) (0.033) (0.123)
N 63 63 63 63 63 63 63 63
R-squared 0.01 0.11 0.05 0.17 0.09 0.24 0.10 0.20
Notes: Huber-White heteroskedasticity-adjusted robust standard errors in parentheses. a. Significant at the 10 percent level.
Reber
909
Figure 6
Changes in Continuation Rates vs. 1960 Black Enrollment Share, Louisiana Counties
The
Journal
of
Human
Resources
Figure 7
Trends in Correlation between Initial Black Enrollment Share and Continuation Rates by Grade
Notes: Author’s calculations. Each point represents the coefficient on 1960fractionblack from a regression of the continuation or high school graduation rate on
Reber 911
in higher and lower black enrollment share counties did not have systematically different continuation rates before desegregation.
The coefficient for the tenth grade continuation regressions increased around 1972, and for 11th grade continuation, it increased around 1969 or 1970. The coefficient for the 12th grade continuation and high school graduation rate regressions rose slightly earlier around 1968. The results are consistent with a larger increase in black continuation rates for high 1960fractionblackdistricts around the time of desegre-gation, when those districts experienced larger increases in per-pupil funding but smaller increases in exposure to whites.23
D. Assessing the Magnitude of the Effects
The results suggest that increased funding associated with desegregation improved educational attainment for blacks, but the magnitudes of the coefficients presented in Table 2 and 4 are not easily compared to the existing literature. I therefore provide two “back-of-the-envelope” calculations of the effects of school funding on educa-tional attainment implied by the estimates.24In this discussion, I assume that the
relationship between 1960 fraction black and attainment operated entirely through differential changes in per-pupil spending; that is, the causal effect of black exposure to whites is zero. This is a strong—but conservative—assumption. To the extent that there is also a positive effect of exposure to whites on attainment, this approach will underestimate the effect of spending on attainment. The estimates provide a useful benchmark for evaluating the results.
First, I estimate the elasticity of high school graduation rates with respect to school spending. I am not aware of existing literature estimating the cost of programs that increase high school graduation rates, however, so it is not clear with what this estimate should be compared. I therefore also conduct a simple cost-benefit analysis: I compare the net present value of additional wages induced by desegregation-related increases in school spending to the net present value of additional school spending for the affected cohorts.
To estimate the increase in high school graduation rates per additional dollar spent, I divide the coefficient on 1960fractionblack from the regression with the change in attainment as the dependent variable by that from the regression with the change in per-pupil current expenditure as the dependent variable. A $1,000 increase in funding (in 2007 dollars) during the period of desegregation was associated with a roughly ten percentage point increase in the black high school graduation rate.25
Average per-pupil current expenditure in the predesegregation period (1960–65) was $2,400, and the average high school graduation rate for predesegregation cohorts was 68 percent according to the 1980 Census. Thus, a 42 percent increase in
per-23. I test separately for trends in the coefficients on initial black enrollment share in the pre- and post-desegregation periods: I do not reject that all the coefficients for 1960 to 1964 are the same (no trend) for any grade. For the upper grades, the postdesegregation trend is statistically significant, as I reject equiva-lence of the coefficient on initial black enrollment share for 1965 to 1975.
24. See Hanushek (1986) and Card and Krueger (1996a, 1996b) for a summary of the existing literature on the effects of school spending on outcomes.
pupil current expenditure corresponded to a 15 percent increase in high school grad-uation rates or an elasticity of high school gradgrad-uation rate with respect to expenditure of 0.36.
To account for increases in educational attainment below high school graduation, I use the coefficients from the tenth, 11th, and 12th grade continuation rate and high school graduation rate regressions. For the average cohort in the “after” period, exposure to $700 of additional spending corresponded to 0.053 additional years of educational attainment. Estimates from the literature on returns to schooling suggest that an additional year of education raises wages by 8–12 percent; I use an inter-mediate value of 10 percent. According to the 1970 Census, black Louisianans be-tween the ages of 20 and 50 with 10–12 years of education (but no high school degree) had annual average wages around $9,700 (in CPI-adjusted 2007 dollars).26
Based on these assumptions and assuming a 5 percent discount rate, the net present value of additional wages surpasses the $700 increase in spending after 20 years in the labor force.27
The benefits of desegregation policy are potentially significantly underestimated, primarily because higher wages due to increased educational attainment were not the only benefits of the policy, and there may have been costs not captured here (for example, to whites). Still, the additional spending appears to have been “worth it.”
VI. Conclusion
The analysis presented above shows that, during the five years of the most intensive desegregation activity in Louisiana, districts with higher black en-rollment shares saw substantially larger increases in per-pupil funding. Blacks in those districts saw large reductions in student-teacher ratios as black-white school quality gaps closed but also smaller increases in exposure to whites. The finding that blacks in higher black enrollment share districts experienced significantly larger increases in educational attainment during this period suggests that the increased funding that came with desegregation was more important than the increased ex-posure to whites. The findings are consistent with earlier work by Boozer, Krueger, and Wolkon (1992), Guryan (2004), and Ashenfelter, Collins, and Yoon (2006) suggesting that desegregation improved educational attainment for blacks and con-tribute to the growing literature suggesting that the policies designed to equalize educational opportunities of blacks and whites around the middle of the century— including desegregation—contributed to improved outcomes for their intended ben-eficiaries.
A rough cost-benefit calculation suggests that the return to the additional years of schooling was likely larger than the additional cost incurred. However, this calcu-lation is far from a complete accounting of the potential costs and benefits of
de-26. This estimate includes blacks with 0 wages; the average wages among those who are working is nearly $15,000.
Reber 913
segregation. Evidence is mounting that education has beneficial effects on outcomes other than wages, in particular, health and criminality.28In addition, the quality of
education for blacks likely rose as well, so blacks who did not change their attain-ment also may have seen benefits. On the other hand, this study has not been able to account for the effects of desegregation on whites. Reber (Forthcoming) shows that funding and student-teacher ratios were “leveled up” to the level previously experienced by whites; this is suggestive that whites were “held harmless” in re-sources allocated to their schools, and we would not expect large effects on edu-cational attainment and quality for whites through that channel. Still, the overall effect of desegregation on whites is unknown.
Little is known about how desegregation affected school finances in other states, so it is difficult to assess whether the mechanism that operated in Louisiana to bring up school spending and black educational attainment after desegregation operated in other parts of the country. Margo (1990) estimates that Louisiana had one of the largest state-wide black-white school spending gaps among Southern states in 1950. This suggests that by the time of desegregation, other states may not have had as large a black-white quality gap to close, so there may have been less scope for improvement in blacks’ outcomes through the mechanisms shown here.
References
Alt, James. 1995. “Race and Voter Registration in the South.” InClassifying by Race, ed. Paul E. Peterson, 313–32. Princeton: Princeton University Press.
Armor, David J. 2002. “Desegregation and Academic Achievement.” InSchool
Desegregation in the 21st Century, ed. Christine H. Rossell, David J. Armor, and Herbert J. Walberg, 148–87. Westport, Conn.: Praeger Publishers.
Ashenfelter, Orley, William Collins, and Albert Yoon. 2006. “Evaluating the Role of Brown v. Board of Education in School Equalization, Desegregation, and the Income of African Americans.”American Law and Economics Review8(2):213–48.
Bond, Horace M. 1934. The Education of the Negro in the American Social Order. New York: Prentice-Hall.
Boozer, Michael A., Alan B. Krueger, and Shari Wolkon. 1992. “Race and School Quality since Brown v. Board of Education.”Brookings Papers on Economic Activity,
Microeconomics: 269–326.
Card, David, and Alan B. Krueger. 1992. “School Quality and Black-White Relative Earnings: A Direct Assessment.”Quarterly Journal of Economics107(1):151–200. ———. 1996a. “School Resources and Student Outcomes: An Overview of the Literature
and New Evidence from North and South Carolina.”Journal of Economic Perspectives
10(4): 31–50.
———. 1996b. “Labor Market Effects of School Quality: Theory and Evidence.” InDoes Money Matter? The Effects of School Resources on Student Achievement and Adult Success,ed. Gary Burtless, 97–140. Washington, D.C.: Brookings Institution.
Card, David, and Thomas Lemieux. 2001. “Dropout and Enrollment Trends in the Post-War Period: What Went Wrong in the 1970s?” InRisky Behavior Among Youths: An Economic Analysis, ed. Jonathan Gruber, 439–82. Chicago: University of Chicago Press.
Cascio, Elizabeth U., Nora E. Gordon, Ethan Lewis, and Sarah J. Reber. 2008. “From Brown to Busing,”Journal of Urban Economics64(2):296–325.
———. 2010. “Paying for Progress: Conditional Grants and the Desegregation of Southern Schools.”Quarterly Journal of Economics125(1):445–82.
Coleman, James S. 1966.Equality of Educational Opportunity Summary Report. Washington, D.C.: U.S. Dept. of Health, Education, and Welfare, Office of Education. Cook, Thomas, and others. 1984.School Desegregation and Black Achievement.
Washington, D.C.: U.S. Department of Education Office of Educational Research and Improvement, National Institute of Education.
Crain, Robert, and Jack Strauss. 1985. “School Desegregation and Black Occupational Attainments: Results from a Long-Term Experiment.” Baltimore: Center for Social Organization of Schools, Johns Hopkins University.
Currie, Janet, and Enrico Moretti. 2003. “Mother’s Education and the Intergenerational Transmission of Human Capital: Evidence from College Openings.”Quarterly Journal of Economics118(4):1495–1532.
Guryan, Jonathan. 2004. “Desegregation and Black Dropout Rates.”American Economic Review94(4):919–43.
Hanushek, Eric. 1986. “The Economics of Schooling: Production and Efficiency in Public Schools.”Journal of Economic Literature24(3):1141–77.
Lleras-Muney, Adriana. 2005. “The Relationship between Education and Adult Mortality in the United States.”Review of Economic Studies72(1):189–221.
Lochner, Lance, and Enrico Moretti. 2004. “The Effect of Education on Crime: Evidence from Prison Inmates, Arrests, and Self-Reports.”American Economic Review94(1):155– 89.
Margo, Robert A. 1990.Race and schooling in the South, 1880–1950: An Economic History. Chicago and London: University of Chicago Press.
Oreopoulos, Philip, Marianne E. Page, and Ann H. Stevens. 2006. “Does Human Capital Transfer from Parent to Child? The Intergenerational Effects of Compulsory Schooling.”
Journal of Labor Economics24(4):729–60.
Reber, Sarah J. Forthcoming. “From Separate and Unequal to Integrated and Equal? School Desegregation and School Finance in Louisiana.”Review of Economics and Statistics. Rivkin, Steven G. 2000. “School Desegregation, Academic Attainment, and Earnings.”
Journal of Human Resources35(2):333–46.
St. John, Nancy H. 1975.School Desegregation: Outcome for Children. New York: John Wiley and Sons.