2
nd
REPORT OF
THE MALAYSIAN REGISTRY
of
RENAL BIOPSY
2008
Sponsors:
Malaysian Society of Nephrology
The National Renal Registry is funded with grants from: The Ministry of Health Malaysia
AIN Medicare Baxter Healthcare Fresenius Medical Care
Roche
ii
December 2008
© National Renal Registry, Malaysia ISSN 1985-6989
Published by:
The National Renal Registry Malaysian Society of Nephrology Suite 1604, Plaza Permata No. 6, Jalan Kampar 50400 Kuala Lumpur Malaysia
Telephone. : (603) 4045 8636 Direct Fax : (603) 4042 7694 e-mail : [email protected]
Web site : http://www.msn.org.my/nrr
Cover illustration complimentary of Dr. Nik Hasimah Nik Yahya, HKL Important information:
This report is copyrighted. However it may be freely reproduced without the permission of the National Renal Registry. Acknowledgment would be appreciated. Suggested citation is:
Rosnawati Yahya, Wan Jazilah W I (Eds) Second Report of the Malaysian Registry of Renal Biopsy 2008 Kuala Lumpur 2010.
The National Renal Registry would like to thank the following:
All the nephrologists and staff of the participating hospitals
For their hard work and contribution,
The Ministry of Health, Malaysia
for support seen and unseen,
For their generous support: -
AIN MedicareBaxter Healthcare Fresenius Medical Care
Roche
The staff of the Clinical Research Centre
&
All who have in one way or another supported the National Renal
Registry.
iv
NRR Advisory Board Members 2008 to 2010
CHAIRMAN Dato’ Dr. Zaki Morad B Mohd Zaher
SECRETARIAT Lee Day Guat
MRRB Working Committee Members
Chairperson Dato’ Dr. Wan Sha’ariah Md Yusuf
Co-Chairperson Dr. Rosnawati Yahya
Clinical Registry Manager Lee Day Guat Clinical Research Assistant Suhazelini Ali
Choo Cheh Loo
CRC Technical Support Staff
Director Dr. Lim Teck Onn
Epidemiologist Dr. Jamaiyah Haniff
IT Manager Celine Tsai Pao Chien
Database Administrator Lim Jie Ying
Network Administrator Kevin Ng Hong Heng Adlan Ab Rahman Scott Huang Li Surin
Statistician Lena Yeap
Siti Haryanie Abdul Aziz
Webmaster Patrick Lum See Kai
Desktop Publisher Azizah Alimat
Sebastian Thoo Phew Seng
ABOUT MALAYSIAN REGISTRY OF RENAL BIOPSY
Renal biopsy remains the main investigation in the diagnosis of renal diseases. In addition, it plays a major role in determining the management and prognosis of parenchymal renal disease. The collection of demographic, clinical and laboratory data at the time of biopsy and the set up of a database are useful tools for studying renal parenchymal diseases.
The development of a renal biopsy registry in each country promotes many advantages and these include comparison in incidence of renal diseases, identification of different policies and practices in renal biopsy in different areas, linkage with other registries such as dialysis or transplant registry and identification of rare renal diseases. Thus, the registry is a source of epidemiological data and would provide useful information in the planning of health care and in organizing prospective clinical studies. The incidence of glomerular disease varies according to population, demographic characteristics, environmental factors, socio-economic status and the prevalence of infectious diseases. At present, there is limited information on the prevalence and incidence of glomerular disease, its potential disease burden and the temporal trend in Malaysia. Hence, the Malaysian Registry of Renal Biopsy (MRRB) was set up in 2005 to address this deficiency.
The MRRB collects information about patients who undergo renal biopsy in Malaysia. The MRRB is a new component of National Renal Registry (NRR), which has been operating the Malaysian Dialysis and Transplant Registry (MDTR) since 1993.
Objectives
The objectives of the MRRB registry are to:
1. Determine the disease burden attributable to glomerular disease (GD) by quantifying its incidence and prevalence, and its geographic and temporal trends in Malaysia.
2. Identify subgroups in the population at high risk of GD to whom preventive efforts should be targeted.
3. Identify potential causal and risk factors involved in GD. 4. Describe the clinical presentation and spectrum of GD.
5. Stimulate and facilitate basic, clinical and epidemiological research on GD. 6. Identify causes of allograft failure in our renal transplant population.
vi
Organization
The NRR organization is as follows: Owner
Source Data Providers Target groups or Users
Owner
The Malaysian Society of Nephrology (MSN) is the owner of this registry.
Sponsors
The MRRB is sponsored by the Malaysian Society of Nephrology (MSN) and the Ministry of Health, Malaysia.
NRR Advisory Committee
This is the committee established by the sponsors. The NRR Advisory Committee’s role is to ensure that the MRRB stay focused on its objectives and to assure its continuing relevance and justification.
MRRB Steering Committee
The MRRB Working Committee supervises its operations.
National Renal Registry office
The NRR coordinating office is the designated coordinating center. It coordinates the data collection among the Source Data Providers (SDPs). It collaborates with Clinical Research Centre of Hospital Kuala Lumpur that provides epidemiological and statistical support for MRRB.
Source Data Providers (SDP)
To participate in MRRB
Centres interested to participate in this registry please write in to NRR officially via post or email
The following documents need to be completed and returned to facilitate participation. • Centre Participation Self Reply Form
• Authorization Form
• Information Security Policy/User Agreement . One form per nominee as listed in the Authorization form. Users must have a personal mobile phone to received SMS authentication.
Upon receiving these documents, the centre shall be registered and each of the users of the MRRB shall be notified via their e-mail address.
Methodology
All patients from participating centres who undergo any kidney biopsy (native or graft) are to be enrolled into the registry.
viii
DATA CONTRIBUTING CENTRES FOR THIS REPORT
Centre Name Adult
Nephrology
Paediatric Nephrology
96 Hospital Angkatan Tentera Lumut √
Fan Medical Renal Clinic √
Ipoh Specialist Hospital √
KPJ Ampang Puteri Specialist Hospital √
KPJ Selangor Specialist Hospital, Shah Alam √
Kuala Lumpur Hospital √ √
Lam Wah Ee Hospital, Pulau Pinang √
Likas Hospital √
Melaka Hospital √
Metro Specialist Hospital, Sungai Petani √
Normah Medical Specialist Centre, Kuching √
Pulau Pinang Hospital √ √
Queen Elizabeth Hospital, Kota Kinabalu √
Raja Perempuan Zainab II Hospital, Kota Bharu √
Raja Permaisuri Bainun Hospital, Ipoh √
Sarawak General Hospital, Kuching √
Selayang Hospital √ √
Serdang Hospital √
Sultan Ismail Hospital, Pandan √
Sultanah Aminah Hospital, Johor Bharu √
Sultanah Bahiyah Hospital, Alor Star √
Sultanah Nur Zahirah Hospital, Kuala Terengganu √
Sunway Medical Centre √
Tengku Ampuan Afzan Hospital, Kuantan √ √
Tengku Ampuan Rahimah Hospital, Kelang √
Tuanku Ja'afar Hospital, Seremban √ √
Tung Shin Hospital, Kuala Lumpur √
CONTRIBUTING EDITORS
Chapter Title Authors Institutions
1 Overview of Renal Biopsy in Malaysia
Wan Sha’ariah Md Yusuf Tuanku Ja’afar Hospital Lee Ming Lee Tuanku Ja’afar Hospital
Lee Day Guat National Renal Registry
2 Primary Glomerulonephritis Sunita Bavanandan Kuala Lumpur Hospital
Lee Han Wai Queen Elizabeth Hospital
Lim Soo Kun University Malaya Medical Centre
3 Secondary
Glomerulonephritis
Rosnawati Yahya Kuala Lumpur Hospital Liew Yew Fong Penang Hospital
4 Lee Ming Lee Tuanku Ja’afar Hospital
Lim Yam Ngo Kuala Lumpur Hospital Lynster Liaw Pulau Pinang Hospital Susan Pee Sultan Ismail Hospital Wan Jazilah Wan Ismail Selayang Hospital Yap Yoke Chin Kuala Lumpur Hospital
5 Renal Allograft Biopsy Wong Hin Seng Selayang Hospital Paediatric Renal Biopsy
x
FOREWORD
FOREWORD
The second report of the Malaysian Registry of Renal Biopsy (MRRB) showed an increase in the number of centers reporting. This is gratifying especially as most of the new centers were form the Universities and the private sector. The first report was confined to centers from the Ministry of Health only. The addition of data from the new centers will hopefully give a more “national” representation of the pattern of glomerular diseases in the country. The ascertainment rate, however, has dropped in 2008 to 76%. Of the 1519 biopsies that were done, 1155 were reported. This is unfortunate as a large segment of useful information is missing. It is hoped that nephrologists will take some time off their busy schedule to report on the biopsies they did.
The pattern of primary and secondary glomerular diseases was similar to that seen in the first report. Any change in pattern in the short term is more likely to be the result of more centers reporting (eg more pediatric nephrology centers) or more biopsies being done than any real change in incidence of glomerular diseases. Facilities for doing renal biopsies are now available in all major hospitals in the country. However indications for biopsies may vary between practitioners and this to some extent affects the pattern observed. Thus the real “pattern” can only be seen after the registry has matured and achieve a high ascertainment rate and there is some consistency amongst practitioners on the indications for biopsy. Nephrotic syndrome remained the most common indication for doing renal biopsy in 2008 followed by asymptomatic urinary abnormalities.
Data from registries serve not only to indicate incidence/prevalence and clinical presentation of diseases but more importantly help guide clinical practice. Data from the Malaysian Dialysis and Transplant Registry (MDTR) have helped in the formulation of clinical practice guidelines on Renal Replacement Therapy in Malaysia along with results from clinical trials. It is hoped that with information accumulated in the MRRB, we could one day develop some practice guidelines on the management of glomerular disease. The registry will have to look at means of collecting more clinical data on outcome such as renal survival, complications of glomerular disease etc before we can embark on such a task. This year (2010) the funding for all registries by the Ministry of Health has been drastically reduced putting the long-term viability of many registries in peril. The National Renal Registry is seriously looking at measures to reduce costs and also to look for additional sources of income. It will endeavour to maintain all existing registries under its purview.
Dr Zaki Morad
CONTENTS
1
1.1 Introduction 2
1.2 Renal biopsies from the participating centres 2
1.2.1 Ascertainment rate of total biopsy performed 2
1.2.2 Type of renal biopsy performed 4
1.2.3 Number of renal biopsy done on each individual patient 5 1.2.4 Demographic distribution of renal biopsy (Native and Graft) 6
1.2.4.1 Age distribution 6
1.2.4.2 Gender distribution 8
1.2.4.3 Racial distribution 8
1.2.5 Renal biopsy report analysis 9
1.2.6 Histopathology specimen distribution to histopathology laboratories 10
1.3 Native kidney biopsy 13
1.3.1 Clinical Indications of renal biopsy 13
1.3.2 Histopathological diagnosis 13
1.3.3 Histopathology findings in common clinical presentation 16 1.3.3.1 Histopathological diagnosis in patients with nephrotic syndrome 16 1.3.3.2 Histopathological diagnosis in patients with urinary abnormalities 17 1.3.3.3 Histopathological diagnosis in patients with nephritic-nephrotic
syndrome 18
1.3.3.4 Histopathological diagnosis in patients with nephritic syndrome 19
1.3.3.5 Primary GN according to various age group 20
2.3 Focal Segmental Glomerulosclerosis 28
2.3.1 Introduction 28
2.4 Idiopathic Membranous Nephropathy 33
2.4.1 Introduction 33
2.4.2 Patient population and characteristics 33
2.4.3 Clinical presentation 34
xii
CHAPTER 3 SECONDARY GLOMERULONEPHRITIS 41
3.1 Introduction 42
3.2.5.3 Histopathological diagnosis by clinical presentation 49
3.2.6 Extra-renal involvement 50
3.2.6.1 American Rheumatological Association (ARA) criteria in lupus
nephritis 50
3.2.7.1 Patient survival in lupus nephritis 52
3.2.7.2 Renal survival in lupus nephritis 52
CHAPTER 4 PAEDIATRIC RENAL BIOBSY 53
4.1 Introduction 54
4.2 Number of patients and renal biopsies 54
4.2.1 Total number of patients and native renal biopsies 54
4.2.2 Number of patients from various hospitals 54
4.2.3 Number of native renal biopsies 54
CONTENT
(con’t)4.7.1 Renal histopathology diagnosis of children presenting with nephrotic
syndrome 58
4.7.2 The histopathological profile in different steroid response categories 58 4.8 Renal histopathology diagnosis of children presenting with nephritic syndrome 59
4.9 Causes of acute renal failure 59
4.10 Paediatric focal segmental glomerulosclerosis and minimal change disease 60 4.10.1 Characteristics of paediatric focal segmental glomerulosclerosis and minimal
change disease among children with steroid resistant nephrotic syndrome 60 4.10.2 Patient survival in focal segmental glomerulosclerosis and minimal change
disease 61
4.10.3 Renal survival of patient with focal segmental glomerulosclerosis and minimal
change disease 62
4.11 Paediatric lupus nephritis 63
4.11.1 Total number of patients and renal biopsies 63
4.11.2 Number of renal biopsy done on each individual patient with lupus 63 4.11.3 Patient characteristics of paediatric lupus nephritis 63
4.11.4 Extra renal manifestation of paediatric SLE 63
4.11.5 Classification of paediatric lupus nephritis 64
4.11.6 Patient survival in lupus nephritis 64
4.11.7 Renal survival of patient with lupus nephritis 64
xiv
CONTENT
(con’t)CHAPTER 5 RENAL ALLOGRAFT BIOPSY 69
5.1 Introduction 70
5.2 Number of renal allograft biopsy 70
5.2.1 Number of renal allograft biopsy by year 70
5.2.2 Number of renal allograft biopsy by year and site 70 5.2.3 Number of renal allograft biopsy by year and age group 72
5.3 Clinical presentation at biopsy 73
5.4 Timing of renal allograft biopsy 74
5.5 Renal allograft biopsy Procedure 75
5.5.1 Renal allograft Biopsy method 75
5.5.2 Number of passes 75
5.5.3 Number of glomeruli obtained on biopsy 76
5.5.4 Type of complications 76
5.6 Histological diagnosis 77
Appendix I Data management I Appendix II Analysis criteria and statistical methodology V
Appendix III Abbreviations IX
LIST OF TABLES
Page
Table 1.2.1 Total number of reported and unreported renal biopsies by centres,
2005-2008 2
Table 1.2.2 Distribution of reported native and graft renal biopsies by centres,
2005-2008 4
Table 1.2.3 (a) Distribution of native renal biopsy in patients by number of episodes 5 Table 1.2.3 (b) Distribution of renal allograft biopsy in patients by number of episodes 5 Table 1.2.4.1 (a) Age distribution of native renal biopsy, 2005-2008 6 Table 1.2.4.1 (b) Age distribution of renal allograft biopsy, 2005-2008 6 Table 1.2.4.1 (c) Age group distribution of reported renal biopsies by state, 2005-2008 7 Table 1.2.4.2 (a) Gender distribution of native renal biopsy, 2005-2008 8 Table 1.2.4.2 (b) Gender distribution of renal allograft biopsy, 2005-2008 8 Table 1.2.4.3 (a) Racial distribution of native renal biopsy, 2005-2008 8 Table 1.2.4.3 (b) Racial distribution of renal allograft biopsy, 2005-2008 8 Table 1.2.5 Number of glomeruli obtained at each biopsy by centres, 2005-2008 9 Table 1.2.6 (a) Distribution of biopsy specimens to histopathology laboratories by
participating centres, 2005-2008 10
Table 1.2.6 (b) Histopathology laboratories receiving renal biopsy specimens,
2005-2008 12
Table 1.3.1 (a) Indications for native renal biopsies, 2005-2008 13
Table 1.3.1 (b) Renal function at time of biopsy 13
Table 1.3.2 Histopathology of all native renal biopsies, 2005-2008 14 Table 1.3.3.1 Histopathological diagnosis in patients presenting with nephrotic
syndrome, 2005-2008 16
Table 1.3.3.2 Histopathological diagnosis in patients presenting with urine
abnormalities, 2005-2008 17
Table 1.3.3.3 HPE diagnosis in patients presenting with nephritic-nephrotic syndrome,
2005-2008 18
Table 1.3.3.4 Histopathological diagnosis in patients presenting with nephritic
syndrome, 2005-2008 19
Table 1.3.3.5 Primary GN according to the various age group, 2005-2008 20
Table 2.1 Primary Glomerulonephritis, 2005-2008 22
Table 2.2.2 (a) Demographic characteristics for MCD, 2005-2008 23
Table 2.2.2 (b) Age group at time of biopsy (years) for MCD, 2005-2008 23
Table 2.2.3 (a) Clinical presentation for MCD, 2005-2008 24
Table 2.2.3 (b) Presence of hypertension in MCD, 2005-2008 24
Table 2.2.3 (c) Renal function in MCD by year, 2005-2008 24
Table 2.2.3.1 Clinical presentation by age group for MCD, 2005-2008 25 Table 2.2.3.2(a) Clinical presentation by gender for MCD, 2005-2008 26
Table 2.2.3.2 (b) Renal function by gender for MCD, 2005-2008 26
Table 2.2.4 Renal function at presentation by age group for MCD, 2005-2008 27
Table 2.3.2 (a) Demographic characteristics for FSGS, 2005-2008 28
Table 2.3.2 (b) Age group at time of biopsy (years) for FSGS, 2005-2008 28
Table 2.3.3 (a) Clinical presentation for FSGS, 2005-2008 29
Table 2.3.3 (b) Hypertension in FSGS, 2005-2008 29
Table 2.3.3.1 (a) Clinical presentation by age group for FSGS, 2005-2008 30 Table 2.3.3.2 (a) Clinical presentation by gender for FSGS, 2005-2008 31
Table 2.3.4 Impaired renal function in FSGS by year, 2005-2008 32
xvi
LIST OF TABLES
(con’t)Page
Table 2.4.3 (a) Clinical presentation for IMN, 2005-2008 34
Table 2.4.3 (b) Hypertension in IMN, 2005-2008 34
Table 2.4.3 (c) Renal function in IMN, 2005-2008 34
Table 2.4.3.1 (a) Clinical presentation by age group for IMN, 2005-2008 35
Table 2.4.3.1 (b) Hypertension by age group for IMN, 2005-2008 35
Table 2.4.3.2 (b) Hypertension by gender for IMN, 2005-2008 36
Table 2.4.4.1 (a) Renal function at presentation by age group for IMN, 2005-2008 36 Table 2.4.4.2 Renal function at presentation according to gender for IMN, 2005-2008 37 Table 2.5.2 (a) Demographic characteristics of patients with IgA nephropathy,
2005-2008 37
Table 2.5.2 (b) Age group at time of biopsy (years) for IgA nephropathy, 2005-2008 38 Table 2.5.3 (a) Clinical presentation for IgA nephropathy, 2005-2008 38
Table 2.5.3 (b) Hypertension in IgA nephropathy, 2005-2008 39
Table 2.5.3.1 Clinical presentation by age group for IgA nephropathy, 2005-2008 39 Table 2.5.3.2 Clinical presentation by gender for IgA nephropathy, 2005-2008 39 Table 2.5.4.1 Renal function at presentation by age group for IgA nephropathy,
2005-2008 40
Table 2.5.4.2 Renal function at presentation according to gender for IgA nephropathy,
2005-2008 40
Table 3.1 Causes of secondary glomerulonephritis in adult, 2005-2008 42
Table 3.2.3 Clinical presentation by year, 2005-2008 43
Table 3.2.3.1 (a) Clinical presentation by age group, 2005-2008 44
Table 3.2.3.3 (a) Clinical presentations by histopathology in lupus nephritis, 2005-2008 46
Table 3.2.4.1 Renal function by age group in lupus nephritis, 2005-2008 47
Table 3.2.4.3 Renal function at presentation by histopathology, 2005-2008 48
Table 3.2.5 Histopathological diagnosis in lupus nephritis by year, 2005-2008 48
Table 3.2.5.1 Histopathological diagnosis by age group in lupus nephritis, 2005-2008 49
Table 3.2.5.2 Histopathological diagnosis by gender in lupus nephritis, 2005-2008 49
Table 3.2.5.3 Histopathological diagnosis by clinical presentation in lupus nephritis,
2005-2008 49
Table 3.2.6.1 ARA criteria in lupus nephritis, 2005-2008 50
Table 3.2.6.5 (a) Extra-renal involvement by gender, 2005-2008 51
Table 3.2.6.5 (b) Mucocutaneous involvement by gender in lupus nephritis, 2005-2008 51
Table 3.2.7.1 Patients survival in lupus nephritis 52
Table 3.2.7.2 Renal survival in lupus nephritis 52
Table 4.2.2 Number of patients from various hospitals 54
Table 4.2.3 Number of renal biopsies 54
Table 4.2.4 Distribution of native renal biopsy in patients by number of attempts 54
Table 4.3.1 Conclusive report 55
Table 4.3.2 Number of glomeruli obtained at each biopsy 55
Table 4.4.1 Gender and racial distribution 55
Table 4.5.1 Clinical presentation at biopsy 56
Table 4.5.2 (a) Renal function at biopsy 56
Table 4.5.2 (b) Renal impairment at biopsy 56
Table 4.5.3 Hypertension at biopsy 56
Table 4.6 Diagnosis of paediatric renal biopsies 57
Table 4.7.1 Renal histopathology diagnosis of children presenting with nephrotic
syndrome 58
LIST OF TABLES
(con’t)Page Table 4.8 Renal histopathology diagnosis of children presenting with nephritic
syndrome 59
Table 4.9 Causes of acute renal failure in children who underwent renal biopsy 59 Table 4.10.1 Clinical characteristics of children with steroid resistant nephrotic
syndrome 60
Table 4.10.2 Patient survival for focal segmental glomerulosclerosis and minimal
change disease 61
Table 4.10.3 Renal survival of patient with focal segmental glomerulosclerosis and
minimal change disease 62
Table 4.11.2 Distribution of renal biopsy in patient with lupus by number of
episodes / attempts 63
Table 4.11.4(a) Clinical presentation of paediatric lupus 63
Table 4.11.4(b) ARA criteria at presentation 63
Table 4.11.5 Classification of paediatric lupus nephritis 64
Table 4.11.6 Patients survival in lupus nephritis 64
Table 4.11.7 Renal survival of patient with lupus nephritis 64 Table 4.12 Causes of end stage renal disease in children who underwent renal
biopsy 65
Table 4.13.1 Risk factors for biopsy failure 65
Table 4.13.2 Frequency of complication 66
Table 4.13.3 Risk factors for complication 67
Table 5.2.1 Number of renal allograft biopsy, 2004-2008 70
Table 5.2.2 Number of renal allograft biopsy by centre, 2004-2008 71 Table 5.2.3 Renal allograft biopsy by year and age group, rate (per million
population), 2004-2008 72
Table 5.3 Indications for renal allograft biopsy, 2004-2008 73
Table 5.4 Timing of renal allograft biopsy, 2004-2008 74
Table 5.5.1 Biopsy method, 2004-2008 75
Table 5.5.2 Number of passes, 2004-2008 75
Table 5.5.3 Number of glomeruli obtained on biopsy, 2004-2008 76
Table 5.5.4 Type of complications, 2004-2008 76
xviii
LIST OF FIGURES
Page
Figure 1.3.3.5 Primary GN according to the various age group, 2005-2008 20 Figure 2.2.2 (b) Age at time of biopsy (years) for MCD, 2005-2008 23
Figure 2.2.3 (a) Clinical presentation for MCD, 2005-2008 24
Figure 2.2.3.1 (b) Hypertension by age group for MCD, 2005-2008 25 Figure 2.2.3.2 (b) Impaired renal function by gender for MCD, 2005-2008 26 Figure 2.2.3.2 (c) Hypertension by gender for MCD, 2005-2008 26 Figure 2.2.4 Renal function at presentation by age group for MCD, 2005-2008 27 Figure 2.3.2 (b) Age at time of biopsy (years) for FSGS, 2005-2008 28
Figure 2.3.3 (a) Clinical presentation for FSGS, 2005-2008 29
Figure 2.3.3.1 (a) Clinical presentation by age group for FSGS,2005-2008 30 Figure 2.3.3.1 (b) Hypertension by age group for FSGS, 2005-2008 30 Figure 2.3.3.2 (a) Clinical presentation by gender FSGS, 2005-2008 31 Figure 2.3.3.2 (b) Hypertension by gender for FSGS, 2005-2008 31 Figure 2.3.4.1 Impaired renal function at presentation by age group for FSGS,
2005-2008 32
Figure 2.3.4.2 Renal function at presentation according to gender for FSGS, 2005-2008 33 Figure 2.4.2 Age at time of biopsy (years) for IMN, 2005-2008 33
Figure 2.4.3 (a) Clinical presentation for IMN, 2005-2008 34
Figure 2.4.3.1 Clinical presentation by age group for IMN 2005-2008 35 Figure 2.4.3.2 (a) Clinical presentation by gender for IMN, 2005-2008 36 Figure 2.4.4.1 (a) Renal function at presentation by age group for IMN, 2005-2008 36 Figure 2.4.4.1 (b) Impaired renal function by age group for IMN, 2005-2008 36 Figure 2.5.2 (b) Age at time of biopsy (years) for IgA nephropathy, 2005-2008 38 Figure 2.5.3 (a) Clinical presentation for IgA nephropathy, 2005-2008 39 Figure 2.5.4.1 Renal function at presentation by age group for IgA nephropathy,
2005-2008 40
Figure 2.5.4.2 Renal function at presentation according to gender for IgA nephropathy,
2005-2008 40
Figure 3.2.4.2 Renal function by gender in lupus nephritis, 2005-2008 47 Figure 3.2.6.2 ARA criteria in lupus nephritis by age group, 2005-2008 50 Figure 3.2.6.3 ARA criteria in lupus nephritis by gender, 2005-2008 50 Figure 3.2.6.4 ARA criteria in lupus nephritis by histopathology, 2005-2008 50 Figure 3.2.6.5 (a) Extra-renal involvement by gender in lupus nephritis, 2005-2008 51 Figure 3.2.6.5 (b) Mucocutaneous involvement by gender in lupus nephritis, 2005-2008 51 Figure 3.2.7.1 Patients survival in lupus nephritis, 2005-2007 52
Figure 3.2.7.2 Renal survival in lupus nephritis, 2005-2007 52
Figure 4.10.2 Patient survival by focal segmental glomerulosclerosis and minimal
change disease 61
Figure 4.10.3 Renal survival by focal segmental glomerulosclerosis and minimal change 62
Figure 4.11.6 Patient survival in lupus nephritis 64
Figure 4.11.7 Renal survival of patient with lupus nephritis 64
Figure 5.2.1 Number of renal allograft biopsy, 2004-2008 70
Figure 5.2.3 Renal allograft biopsy by year and age group, rate per million population
2004-2008 72
Figure 5.4 Timing of renal allograft biopsy, 2004-2008 74
Figure 5.5.1 Biopsy method, 2004-2008 75
Figure 5.5.2 Number of passes, 2004-2008 75
Figure 5.5.3 Number of glomeruli obtained on biopsy, 2004-2008 76
Figure 5.5.6 Histological diagnosis, 2004-2008 77
xx
REPORT SUMMARY
CHAPTER 1: OVERVIEW OF RENAL BIOPSY IN MALAYSIA
The second MRRB report included data from MOH centers as well as from universities and private hospitals. Universities and private hospitals contributed data to MRRB from 2008.
• Total of 33 centers contributed data in 2008. There were an additional 11 new centers. • The first report was exclusively from 23 MOH centers only.
• Renal biopsies performed in MOH centers from 2005-2008 was also updated. • 1519 renal biopsies were performed in 2008 and of these, 1155 were reported.
• The ascertainment rate was 92.2%, 91.05 %, 92.9% and 76.03% for the years 2005, 2006, 2007 and 2008 respectively.
• Average ascertainment rate for the years 2005 – 2008 was 86.5%. • 89.4 % of renal biopsies in 2008 were reported in native biopsies.
• 83% of native biopsies were done in patients older than 15 years old and in this group 91.8% of the biopsies were done in patients less than 55 years of age.
• There were more females than males (ratio 3:2) due to the higher number of females amongst patients biopsied for lupus nephritis.
• 869 (23%) of the biopsies from 2005 to 2008 yielded less than 10 glomeruli.
• 38 (1%) of biopsies were classified as missing. The histopathological reports were not submitted to MRRB.
• 47.6% histopathology slides were read by pathologists in the same hospital and 52.4 % were sent to be read by pathologists in another hospital.
• Main indications for native kidney biopsies were nephrotic syndrome (46%) and urinary abnormalities (28%).
• 54 % had normal renal function and 32% had impaired renal function. Data was missing for 14%.
CHAPTER 2: PRIMARY GLOMERULONEPHRITIS
The commonest primary GN reported was Minimal Change Disease (MCD) followed by Focal Segmental Glomerulosclerosis (FSGS).
Minimal change disease
• Accounted for 33% of total primary GN
• Mean age at the time of biopsy was 29.1 ± 12.8 years. • Male to female ratio was 2:1.
• Nephrotic syndrome was the most common clinical presentation. • Twenty percent had e-GFR < 60 ml/min/1.73 m2 at time of biopsy • There was a higher risk of renal impairment with increasing age. Focal Segmental Glomerulosclerosis (FSGS)
• Accounted for 30% of total primary GN.
• Mean age at the time of biopsy was 32.5 ± 13.5 years. • Male to female ratio was 1.3:1.
Idiopathic Membranous Nephropathy (IMN) • Accounted for 11% of total primary GN.
• Mean age at the time of biopsy was 45.3 + 14.7 years. • Male to female ratio was 1.3:1.
• Nephrotic syndrome was the most common clinical presentation. • Thirty-seven percent had e-GFR < 60 ml/min/1.73 m2 at time of biopsy. • There was a higher risk of renal impairment with increasing age
IgA nephropathy
• Accounted for 19% of total primary GN.
• Mean age at the time of biopsy was 33.8 ± 12.5 years. • Male to female ratio was 0.9:1.
• Asymptomatic urine abnormalities was the most common clinical presentation, followed by nephritic syndrome.
• Forty-six percent had e-GFR < 60 ml/min/1.73 m2 at time of biopsy.
• Males tend to have worse renal function at presentation compared to females.
CHAPTER 3: SECONDARY GLOMERULONEPHRITIS
The commonest secondary GN reported was lupus nephritis. Diabetic nephropathy was the second commonest glomerular disease reported.
Lupus nephritis
• Accounted for 86% of total secondary GN.
• Mean age at the time of biopsy in adult lupus nephritis was 30.3 ± 10.4 years. • Male to female ratio was 6.9:1.
• Urine abnormality (38%) was the commonest clinical presentation followed by nephrotic syndrome (30%).
• The commonest histopathological finding was WHO or ISN/RPS class IV or IV+V (59%).
• There was no clear correlation between histopathological findings and clinical presentation. However, class IV or class IV+V were more likely to present with symptomatic renal disease. • The prevalence of hypertension was higher in class IV or class IV +V
• The prevalence of impaired kidney function correlated with histopathological findings. Class IV was more likely to have impaired renal function.
• About 2/3 of cases with lupus nephritis fulfilled 4 or more American Rheumatological Association (ARA) criteria at presentation.
• Fulfilling the ARA criteria does not predict the severity of renal lesion.
xxii
CHAPTER 4: PAEDIATRIC RENAL BIOPSY
This chapter reports on renal biopsy in children less than 15 years of age and the summary details the report for the years 1999 -2008.
• 809 renal biopsies were performed in 755 children. • Majority of biopsies were performed in MOH hospitals.
• 770 (95.2%) were assessed to be adequate. The success rate is comparable to reports from Thailand, UK and Japan.
• 621(77.2%) yielded more than 10 glomeruli. • 51.9% were performed in girls.
• Nephrotic syndrome (52.9%) was the most frequent clinical presentation.41.8% of the diagnosis on biopsy was FSGS and minimal change disease in 28.7%.
• The commonest biopsy finding for nephritic syndrome was post-infectious glomerulonephritis (36.3%).
• Overall, in terms of diagnosis on biopsies for the paediatric age group, lupus nephritis was the commonest finding in 24.8%, followed closely by FSGS ( 24.6%) and MCD accounted for 17.27%. • There were no difference in terms of age at presentation, race, gender, urine albumin excretion
and creatinine clearance in children with FSGS and minimal change disease at biopsy. • There was no difference in patient survival for FSGS and minimal change disease.
• There was however definite poorer renal survival, 92.4 % and 84.6% at 3 and 5 years for the FSGS group. Renal survival for the MCD group was at 95.9% at both 3 and 5 years.
• Commonest biopsy finding for the lupus group was class IV and Class V + IV (64.2%) • Renal survival for the lupus group was 97.1 % at both 3 and 5 years.
• The complication rate for renal biopsy was 5.4%. The most common complication was bleeding which occurred in 4.1 %.
CHAPTER 5: RENAL ALLOGRAFT BIOPSY
This chapter reports on renal allograft biopsy and the summary details the report for the years 2004 -2008.
• The number of renal allograft biopsies doubled over the last 5 years despite a decreased in the number of new transplant recipients.
• This was largely contributed by an increase in participating centres reporting to MRRB. • 90% of renal allograft biopsies were performed in 5 centers in Klang valley.
• The biopsies were usually performed in the age group 15 to 54 years. • Acute and chronic allograft dysfunction was the commonest indications.
• Chronic allograft dysfunction has assumed more importance in recent years. This was supported by a 5 fold increase in renal biopsies performed for this reason. (10 % in 2004 to 47% in 2008) • In addition, there was a marked increase in the number of renal allograft biopsies performed after
one year post transplant. (35% in 2004 and 55% in 2008)
• 96% of biopsies were performed under real time ultrasound guidance. • 97% of biopsies were not associated with any complications.
• The histological diagnosis on biopsy in order of importance was acute rejection (49%), acute tubular necrosis (16%) calcineurin inhibitor toxicity (15%) and chronic allograft nephropathy. (15%)
2nd Report of the
Malaysian Registry of Renal Biopsy 2008
OVERVIEW OF RENAL BIOPSY IN MALAYSIA
CHAPTER 1
Overview Of Renal Biopsy In Malaysia
Wan Sha’ariah Md Yusuf
Lee Ming Lee
OVERVIEW OF RENAL BIOPSY IN MALAYSIA
2nd Report of the Malaysian Registry of Renal Biopsy 2008
2
1.1 Introduction
The first Malaysian Registry of Renal Biopsy (MRRB) report was published in 2009. The report provided data of renal biopsy performed and reported for year 2005 to 2007 from most of the centres providing nephrology services in the Ministry of Health Malaysia (MOH). Since 2008, the MRRB had invited participation from non MOH nephrologists and renal physicians. Thus the second MRRB report will include data from MOH centres, universities and private hospitals. Renal biopsies performed in MOH centres from 2005-2007 which were previously reported will also be updated and reported in this second MRRB report.
1.2: Renal biopsies from the participating centres
1.2.1 Ascertainment rate of total biopsy performed
From 2005 to 2008, a total of 22 centres (15 adult and 7 paediatric) from the Ministry of Health (MOH) submitted data to the MRRB. Eleven additional non MOH centres from the army, universities and private hospitals also contributed data since 2008. These participating centres will be identified by their centre identification number.
In 2005, a total 784 renal biopsies were performed and of these, 723 were reported. In 2006, 1028 renal biopsies were performed and 936 were reported. In 2007, 1037 renal biopsies were performed and of these 963 were reported. In 2008, 1519 renal biopsies were performed and of these 1155 were reported. This gives an ascertainment rate of 92.2% for 2005, 91.1% for 2006, 92.9% for 2007 and 76.0% for 2008. The average ascertainment rate for 2005-2008 was 86.5% (Table 1.2.1).
Table 1.2.1: Total number of reported and unreported renal biopsies by centres, 2005 – 2008
2nd Report of the
Malaysian Registry of Renal Biopsy 2008
OVERVIEW OF RENAL BIOPSY IN MALAYSIA
OVERVIEW OF RENAL BIOPSY IN MALAYSIA
2nd Report of the Malaysian Registry of Renal Biopsy 2008
4
1.2.2 Type of renal biopsy performed
As expected, majority of the biopsies reported were from native kidneys: 90.2% in 2005, 87.4% in 2006, 87.1% in 2007 and 89.4% in 2008. The rest were from graft kidneys (Table 1.2.2).
Table 1.2.2: Distribution of reported native and graft renal biopsies by centres, 2005-2008
2nd Report of the
Malaysian Registry of Renal Biopsy 2008
OVERVIEW OF RENAL BIOPSY IN MALAYSIA
1.2.3: Number of renal biopsy done on each individual patient
The data captured in MRRB is year based. New biopsies and patients biopsied before 2005 were included. The number of biopsy episode/attempt per patient is recorded accordingly.
In the native biopsy group, from 2005 to 2008, 3193 patients had renal biopsy done. 2776 patients had renal biopsy for the first time, 355 patients had biopsy done twice, 54 patients had biopsy done thrice and 8 patients had four or more biopsy done on them. Therefore about 13.1% of patients had a repeat native biopsy done (Table 1.2.3(a)).
In the allograft biopsy group; over the same period, 312 patients underwent a graft biopsy. 193 patients had biopsy done once, 84 patients had biopsy done twice, 21 patients had biopsy done thrice and 14 patients had biopsy done four times or more (Table1.2.3 (b)). As expected, there was a higher rate of repeat graft biopsies (38.1%).
Table 1.2.3(a): Distribution of native renal biopsy in patients by number of episodes
Native 2005 2006 2007 2008 Total
n % n % n % n % n
1st episode 519 85 673 87 692 87 892 88 2776
2nd episode 78 13 93 12 77 10 107 11 355
3rd episode 10 2 5 1 24 3 15 1 54
>4th episode 1 0 1 0 3 0 3 0 8
Total patient 608 100 772 100 796 100 1017 100 3193
Table 1.2.3 (b): Distribution of renal allograft biopsy in patients by number of episodes
Graft 2005 2006 2007 2008 Total
n % n % n % n % n
1st episode 31 72 57 70 51 60 54 53 193
2nd episode 10 23 18 22 23 27 33 32 84
3rd episode 2 5 5 6 6 7 8 8 21
>4th episode 0 0 2 2 5 6 7 7 14
OVERVIEW OF RENAL BIOPSY IN MALAYSIA
2nd Report of the Malaysian Registry of Renal Biopsy 2008
6
1.2.4: Demographic distribution of renal biopsy (Native and Graft)
1.2.4.1: Age distribution
Eighty three percent of native biopsies were done in patients older than 15 years old and in this group, 91.8% of the biopsies were done in patients less than 55 years age. Very few (7%) biopsies were done in patients older than 55 years old (Table 1.2.4.1 (a)).
In the graft biopsy group, 95% were done in patients older than 15 years old and of these, 89.2% were in the age group of 15 to less than 55 years. Only 10% of the graft biopsies were done in those above 55 years of age (Table 1.2.4.1(b)).
For adults (age >15years old) the highest number of renal biopsy was reported in Wilayah Persekutuan (WP) Kuala Lumpur (25%), followed by Selangor (22%) and Sabah (13%). In the paediatric group (age <15 years old), the highest number of renal biopsy were reported in WP Kuala Lumpur (28%), followed by Johor (23%) and Selangor (15%) (Table 1.2.4.1(c)).
Table 1.2.4.1(a): Age distribution of native renal biopsy, 2005-2008
Age group 2005 2006 2007 2008 Total
Table 1.2.4.1(b): Age distribution of renal allograft biopsy, 2005-2008
2
Table 1.2.4.1 (c): Age group distribution of reported renal biopsies by state, 2005-2008
OVERVIEW OF RENAL BIOPSY IN MALAYSIA
2nd Report of the Malaysian Registry of Renal Biopsy 2008
8
1.2.4.2: Gender distribution
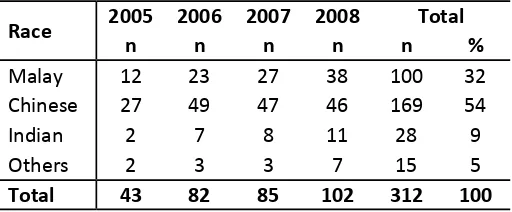
As in the first MRRB report, in the native renal biopsy group, there were more females compared to males (ratio 3:2). This was probably due to the higher number of females among the patients biopsied for SLE (Table 1.2.4.2(a)). However, in the graft biopsy group, there were more males (ratio 2:1)(Table 1.2.4.2 (b)). This is consistent with the trend of male predominance amongst the transplant patients as reported in the 16th Report of The Malaysian Dialysis and Transplant Registry.
Table 1.2.4.2(b): Gender distribution of renal allograft biopsy, 2005-2008 kidney biopsy, majority were Malays (56%), followed by Chinese (26%)(Table
2nd Report of the
Malaysian Registry of Renal Biopsy 2008
OVERVIEW OF RENAL BIOPSY IN MALAYSIA
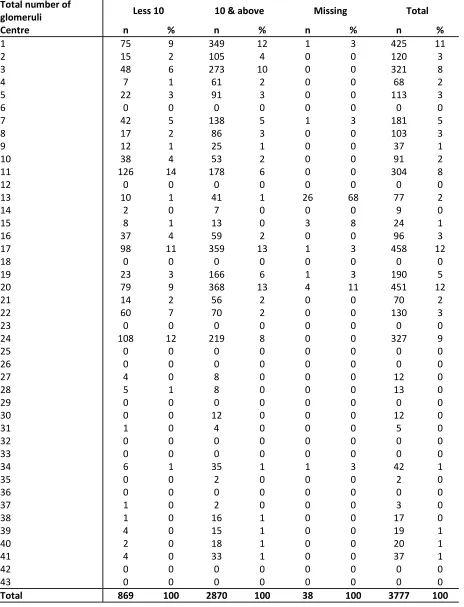
1.2.5: Renal biopsy report analysis
A total of 3777 renal biopsies were performed and reported from 2005 to 2008. There were 869 (23%) of the biopsies yielded less than 10 glomeruli, which our pathologists felt was the minimum number of glomeruli required to label a biopsy as adequate. 38(1%) biopsies were classified as missing because the histopathology reports were not submitted to MRRB. The remaining 76.0% reported 10 or more glomeruli.
O
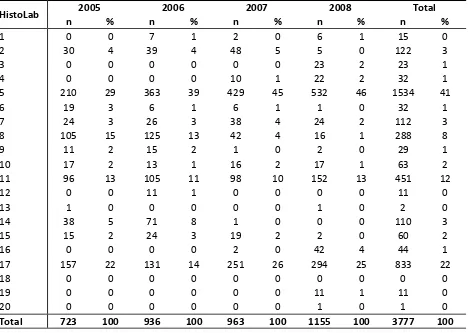
1.2.6: Histopathology specimen distribution to histopathology laboratories
As shown in Table 1.2.6, not all biopsies performed at the centres were read by the local histo-pathologists. A number of the renal biopsy specimens were sent to other centres for processing and reporting. A total of 47.6% of HPE slides were read locally and 52.4% were sent to another laboratory (Table 1.2.6 (a)).
The histopathology laboratories were coded by a number (Table1.2.6 (b)).
Table 1.2.6(a): Distribution of biopsy specimens to histopathology laboratories by participating centres, 2005-2008
Centre
Local histopathology laboratories Outside histopathology laboratories
2
Table 1.2.6(a): Distribution of biopsy specimens to histopathology laboratories by participating centres, 2005-2008 (cont.)
Centre
Local histopathology laboratories Outside histopathology laboratories
OVERVIEW OF RENAL BIOPSY IN MALAYSIA
2nd Report of the Malaysian Registry of Renal Biopsy 2008
12
Table 1.2.6(b): Histopathology laboratories receiving renal biopsy specimens, 2005-2008
HistoLab 2005 2006 2007 2008 Total
n % n % n % n % n %
1 0 0 7 1 2 0 6 1 15 0
2 30 4 39 4 48 5 5 0 122 3
3 0 0 0 0 0 0 23 2 23 1
4 0 0 0 0 10 1 22 2 32 1
5 210 29 363 39 429 45 532 46 1534 41
6 19 3 6 1 6 1 1 0 32 1
7 24 3 26 3 38 4 24 2 112 3
8 105 15 125 13 42 4 16 1 288 8
9 11 2 15 2 1 0 2 0 29 1
10 17 2 13 1 16 2 17 1 63 2
11 96 13 105 11 98 10 152 13 451 12
12 0 0 11 1 0 0 0 0 11 0
13 1 0 0 0 0 0 1 0 2 0
14 38 5 71 8 1 0 0 0 110 3
15 15 2 24 3 19 2 2 0 60 2
16 0 0 0 0 2 0 42 4 44 1
17 157 22 131 14 251 26 294 25 833 22
18 0 0 0 0 0 0 0 0 0 0
19 0 0 0 0 0 0 11 1 11 0
20 0 0 0 0 0 0 1 0 1 0
2nd Report of the
Malaysian Registry of Renal Biopsy 2008
OVERVIEW OF RENAL BIOPSY IN MALAYSIA
1.3: Native kidney biopsy
1.3.1: Clinical Indications of renal biopsy
The main indications for native kidney biopsies were nephrotic syndrome (46%) followed by urinary abnormalities (28%) (Table 1.3.1 (a)). A total of 1818 (54%) patients had normal renal function at time of biopsy, 32% had impaired renal function and for the rest, renal function was either not available or unknown at time of biopsy (Table 1.3.1 (b)).
Table 1.3.1(a): Indications for native renal biopsies, 2005-2008
Clinical presentations 2005 2006 2007 2008 Total
n % n % n % n % n %
Table 1.3.1(b): Renal function at time of biopsy
Renal function 2005 2006 2007 2008 Total
In the native kidney biopsy group, the three most common primary glomerulonephritis (GN) reported were focal segmental glomerulosclerosis (FSGS) (33%), minimal change disease (33%) and IgA nephropathy (17%). Membranous nephropathy only comprises 9% of the total primary GN subgroup (Table 1.3.2).
O
Table 1.3.2: Histopathology of all native renal biopsies, 2005-2008
Type Histopathological diagnosis 2005 2006 2007 2008 Total
2
Table 1.3.2: Histopathology of all native renal biopsies, 2005-2008 (cont.)
Type Histopathological diagnosis 2005 2006 2007 2008 Total
OVERVIEW OF RENAL BIOPSY IN MALAYSIA
2nd Report of the Malaysian Registry of Renal Biopsy 2008
16
1.3.3: Histopathology findings in common clinical presentation
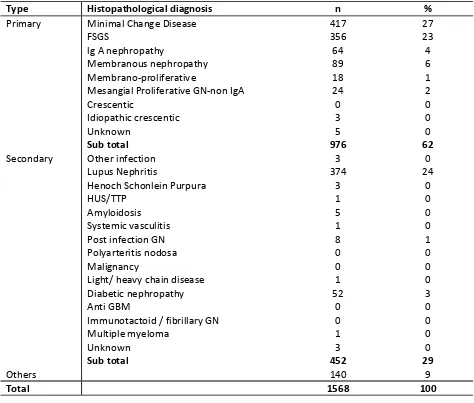
1.3.3.1: Histopathological diagnosis in patients with nephrotic syndrome
In patients presenting with nephrotic syndrome, the commonest histopathology reported was minimal change (27%), followed by lupus nephritis(24%) and focal segmental glomerulosclerosis (23%) (Table 1.3.3.1).
Table 1.3.3.1: HPE diagnosis in patients presenting with nephrotic syndrome, 2005-2008
Type Histopathological diagnosis n %
Primary Minimal Change Disease 417 27
FSGS 356 23
2nd Report of the
Malaysian Registry of Renal Biopsy 2008
OVERVIEW OF RENAL BIOPSY IN MALAYSIA
1.3.3.2: Histopathological diagnosis in patients with urinary abnormalities
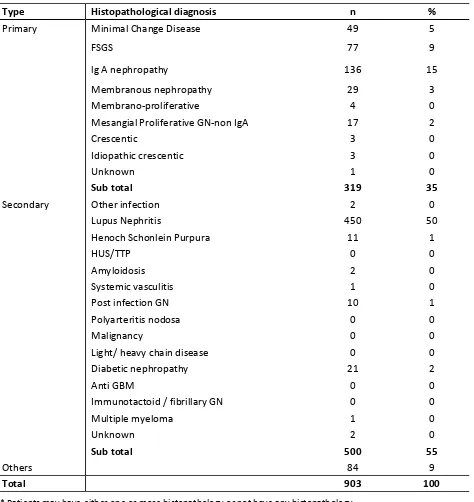
In patients presenting with urinary abnormalities, IgA (15%) was the commonest histopathology reported in the primary GN group; while the most common secondary GN was lupus nephritis (50%) (Table1.3.3.2).
Table 1.3.3.2: HPE diagnosis in patients presenting with asymptomatic urine abnormalities, 2005-2008
Type Histopathological diagnosis n %
Primary Minimal Change Disease 49 5
FSGS 77 9
OVERVIEW OF RENAL BIOPSY IN MALAYSIA
2nd Report of the Malaysian Registry of Renal Biopsy 2008
18
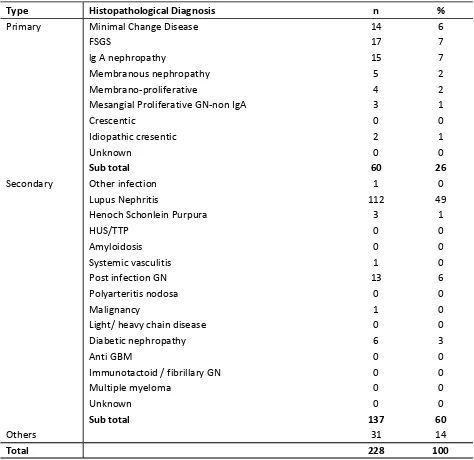
1.3.3.3: Histopathological diagnosis in patients with nephritic-nephrotic syndrome
In patients presenting with Nephritic-nephrotic syndrome the common histopathology among the primary GN were IgA (7%) and FSGS (7%) and among the secondary GN was lupus nephritis (49%) (Table 1.3.3.3).
Table 1.3.3.3: HPE diagnosis in patients presenting with nephritic-nephritic, 2005-2008
Type Histopathological Diagnosis n %
Primary Minimal Change Disease 14 6
FSGS 17 7
2nd Report of the
Malaysian Registry of Renal Biopsy 2008
OVERVIEW OF RENAL BIOPSY IN MALAYSIA
1.3.3.4: Histopathological diagnosis in patients with nephritic syndrome
In patients presenting with acute nephritic syndrome, the commonest GN is lupus nephritis (48%) Table 1.3.3.4).
Table 1.3.3.4: HPE diagnosis in patients presenting with nephritic syndrome, 2005-2008
Type Histopathological Diagnosis n %
Primary Minimal Change Disease 16 6
FSGS 25 9
OVERVIEW OF RENAL BIOPSY IN MALAYSIA
2nd Report of the Malaysian Registry of Renal Biopsy 2008
20
1.3.3.5 Primary GN according to various age group
FSGS was the commonest GN in the <15 year age group(45%) followed by minimal change disease(36%). In adults between 25 ≤ 55 years old, minimal change disease(34%) and FSGS(30.5%) were the two commonest GN. The commonest GN in the 15- 25 year age group was minimal change disease (46%). In patients above 55 years of age, the commonest primary GN was membranous nephropathy (33.0%) (Table 1.3.3.5).
Table 1.3.3.5: Primary GN according to the various age group, 2005-2008
Histopathological <15 15 ≤ 25 25 ≤ 35 35 ≤ 45 45 ≤ 55 55 ≤ 65 ≥ 65 Total
Figure 1.3.3.5: Primary GN according to the various age group, 2005-2008
Primary GN by age group
<15 15-<25 25-<35 35-<45 45-<55 55-<65 >=65
2nd Report of the
Malaysian Registry of Renal Biopsy 2008
PRIMARY GLOMERULONEPHRITIS
CHAPTER 2
Primary Glomerulonephritis
Sunita Bavanandan
Lee Han Wei
PRIMARY GLOMERULONEPHRITIS
2nd Report of the Malaysian Registry of Renal Biopsy 2008
22
2.1 Introduction
This chapter covers the main primary glomerulonephritis that were reported to the MRRB from the years 2005-2008.
Minimal change disease is the commonest secondary glomerulonephritis in adult contributing 33% of all primary glomerulonephritis in Malaysia. This was followed by focal segmental glomerulosclerosis which contributed about 30% of cases. Ig A nephropathy (19%) is the third commonest primary glomerulonephritis. Idiopathic membranous nephropathy contributed only 11% of all biopsy proven primary glomerulonephritis. The other types of primary glomerulonephritis are relatively uncommon (Table 2.1).
Table 2.1: Primary Glomerulonephritis, 2005-2008
Histopathological Diagnosis 2005 2006 2007 2008 Total
n % n % n % n % n %
2.2: Minimal change disease
2.2.1: Introduction
Minimal change disease (MCD) is typically characterized by normal appearing glomeruli by light microscopy and the absence of complement or immunoglobulin deposits by immunofluorescence microscopy. Glomerular size is usually normal by standard methods of light microscopy, although enlarged glomeruli may be observed.
2nd Report of the
Malaysian Registry of Renal Biopsy 2008
PRIMARY GLOMERULONEPHRITIS
2.2.2: Patient population and characteristics
A total of 389 cases of minimal change disease were reported in 2005-2008. The mean age of the patients at the time of biopsy was 29.1 ± 12.8 with a clear predominance in second and third decades of life. The frequencies of age groups 15 to <25, and 25 to <35 were 51% and 23% respectively, which is 74% when combined. However, it is important to bear in mind that children with steroid responsive nephrotic syndrome are usually not biopsied, hence the actual incidence of minimal change disease in the paediatric age group is under-represented. The diagnosis of minimal change disease is relatively rare after 55 years of age and our reported frequency was only about 6% in this age group.
There is a higher incidence of minimal change disease in males, with a ratio of 2:1 in the four-year registry data (overall 66% as compared to 34% in the female group (Table 2.2.2 (a)).
In terms of racial distribution, there was no predilection of any particular ethnic group. The racial group distribution in Malay, Chinese and Indian was 60%, 17% and 6% (Table 2.2.2 (a)). This pattern of distribution reflects the ethnic composition of patients admitted to public hospitals.
Table 2.2.2(a): Demographic characteristics for MCD, 2005-2008
Demographic Characteristics n =389 %
Age (years) 29.1 ± 12.8
Table 2.2.2 (b): Age group at time of biopsy (years) for MCD, 2005-2008 Age group
Figure 2.2.2 (b): Age at time of biopsy (years) MCD, 2005-2008
PRIMARY GLOMERULONEPHRITIS
2nd Report of the Malaysian Registry of Renal Biopsy 2008
24
2.2.3: Clinical presentation
The mean level of 24 hours urine protein was 6.4 ± 5.1g/day. Nephrotic syndrome, as expected, was the most common presentation (81%). Other presentations were asymptomatic urine abnormality (10%), nephritic syndrome (3%) and nephritic-nephrotic syndrome (3%) (Table & Figure 2.2.3(a)).
Majority of blood pressures were normal during presentation (88%) (Table 2.2.3(b)).
Most patients do not have any documented renal impairment, 58% have eGFR ≥ 90 ml/min/1.73m2 while 23% have eGFR between 60 to 89 ml/min/1.73m2. One fifth of patients have significant renal impairment (eGFR less than 60 ml/min/1.73m2) (Table 2.2.3 (c)).
Table 2.2.3 (a): Clinical presentation for MCD, 2005-2008
Clinical Presentations 2005 2006 2007 2008 Total
n % n % n % n % n %
Table 2.2.3 (c): Renal function in MCD by year, 2005-2008
2nd Report of the
Malaysian Registry of Renal Biopsy 2008
PRIMARY GLOMERULONEPHRITIS
2.2.3.1: Clinical presentation by age
Nephrotic syndrome consistently predominates as the clinical presentation throughout all age groups (Table 2.2.3.1). However, the presence of hypertension increases with increasing age (Figure 2.2.3.1(b)).
Table 2.2.3.1: Clinical presentation by age group for MCD, 2005-2008
Clinical Presentations
15- <25 25-<35 35-<45 45-<55 55-<65 > 65 Total
n % n % n % n % n % n % n %
Asymptomatic urine
abnormality 18 9 10 11 7 16 3 10 2 13 0 0 40 11
Nephritic syndrome 5 3 5 6 1 2 1 3 0 0 1 17 13 3
Nephrotic syndrome 164 82 75 82 35 76 27 87 12 74 4 66 317 81 Nephritic-Nephrotic
syndrome 10 5 0 0 1 2 0 0 0 0 1 17 12 3
Missing 2 1 1 1 2 4 0 0 2 13 0 0 7 2
Total 199 100 91 100 46 100 31 100 16 100 6 100 389 100
PRIMARY GLOMERULONEPHRITIS
2nd Report of the Malaysian Registry of Renal Biopsy 2008
26
2.2.3.2: Clinical presentation by gender
There are basically no differences between genders in terms of clinical presentation and renal function at presentation (Table 2.2.3.2 (a & b)). Both genders have relatively well preserved with renal function with less than 20% have eGFR < 60 ml/min/1.72 m2 (Figure 2.2.3.2 (b)). The prevalence of hypertension was higher in female than male (13% vs. 7%) (Figure 2.2.3.2(c)).
Table 2.2.3.2 (a): Clinical presentation by gender for MCD, 2005-2008
Clinical Presentations Male Female
n % n % gender for MCD, 2005-2008
2nd Report of the
Malaysian Registry of Renal Biopsy 2008
PRIMARY GLOMERULONEPHRITIS
2.2.4: Renal function at presentation
About three-quarter of patients below 35-years-old have well-preserved renal function (eGFR >60ml/ min/1.73m2). This is in contrast to the older age group, e.g. those aged above 55 years where 50-84 % have already suffered significant renal impairment (eGFR < 60ml/min/1.73m2) on presentation (Table & Figure 2.2.4).
Table 2.2.4: Renal function at presentation by age group for MCD, 2005-2008
eGFR
(ml/min/1.73m2)
15 ≤ 25 25 ≤ 35 35 ≤ 45 45 ≤ 55 55 ≤ 65 ≥ 65 Total
n % n % n % n % n % n % n %
>90 137 69 58 64 15 33 10 32 4 25 0 0 224 58
60-89 35 18 18 20 20 43 10 32 4 25 1 17 88 23
30-59 22 11 11 12 7 15 10 32 3 19 4 67 57 15
15-29 5 3 3 3 1 2 1 3 3 19 0 0 13 3
<15 0 0 1 1 3 7 0 0 2 13 1 17 7 2
Total 199 100 91 100 46 100 31 100 16 100 6 100 389 100
PRIMARY GLOMERULONEPHRITIS
2nd Report of the Malaysian Registry of Renal Biopsy 2008
28
2.3: Focal Segmental Glomerulosclerosis
2.3.1: Introduction
Focal segmental glomerulosclerosis is defined on histologic criteria by segmental capillary obliteration with increased mesangial matrix deposition, intra-capillary hyaline deposits and focal adhesions of the capillary tuft to Bowman’s capsule.
2.3.2: Patient Population and Characteristics
A total of 355 cases of FSGS were reported in our four-year registry data. The mean age at the time of biopsy was 32.5 ± 13.5 (Table 2.3.2 (a)). The first three decades of life were the predominant age groups in this type of renal disease. After the age of 55, the frequency rate was only 8% compared to other age groups (Table & Figure 2.3.2 (b)). FSGS was slightly more common in males (57%) compared to females (43%) (Table 2.3.2(a)). The distribution according to ethnicity was 62% in Malays, 16% in Chinese, 7% in Indians and 15% in others (Table 2.3.2(a)).
Table 2.3.2 (a): Demographic characteristics for FSGS, 2005-2008
Demographic Characteristics n=355 %
Age (years) 32.5 ± 13.5
Table 2.3.2 (b): Age group at time of biopsy (years) for FSGS, 2005-2008 Age group
Figure 2.3.2 (b): Age at time of biopsy (years) for FSGS, 2005-2008
0
2nd Report of the
Malaysian Registry of Renal Biopsy 2008
PRIMARY GLOMERULONEPHRITIS
2.3.3: Clinical Presentation
The mean level of 24 hours urine protein was 4.6±3.7g/day. Nephrotic syndrome was the most common reported clinical presentation (65%). Other reported presentations were asymptomatic urine abnormal-ity (21%), nephritic syndrome (6%) and nephritic-nephrotic syndrome (3%) (Table & Figure 2.3.3(a)).
The majority of patients (79%) have normal blood pressure during the initial presentation (Table 2.3.3 (b)).
Table 2.3.3 (a): Clinical presentation for FSGS, 2005-2008
Clinical Presentations 2005 2006 2007 2008 Total
n % n % n % n % n %
Asymptomatic urine abnormality 10 16 19 18 17 20 28 28 74 21
Nephritic syndrome 4 7 5 5 5 6 6 6 20 6
Nephrotic syndrome 43 70 76 72 56 64 57 56 232 65
Nephritic-Nephrotic syndrome 1 2 0 0 6 7 4 4 11 3
Missing 3 5 6 6 3 3 6 6 18 5
Total 61 100 106 100 87 100 101 100 355 100
Figure 2.3.3 (a): Clinical presentation for FSGS, 2005-2008
Table 2.3.3 (b): Hypertension in FSGS, 2005-2008
Hypertension n %
Present 63 18
Absent 281 79
Missing 11 3
PRIMARY GLOMERULONEPHRITIS
2nd Report of the Malaysian Registry of Renal Biopsy 2008
30
2.3.3.1: Clinical presentation by age
Nephrotic syndrome consistently predominates as the clinical presentation throughout all age groups particularly in the very young (below 25 years) and those above 55 (Table & Figure 2.3.3.1(a)). years. The prevalence of hypertension increases with increasing age (Figure 2.3.3.1(b)).
Table 2.3.3.1 (a): Clinical presentation by age group for FSGS, 2005-2008
Age group (years)
15 ≤ 25 25 ≤ 35 35 ≤ 45 45 ≤ 55 55 ≤ 65 > 65 Total
n % n % n % n % n % n % n %
Asymptomatic urine
abnormality 18 14 33 34 16 27 5 13 2 12 0 0 74 21
Nephritic syndrome 6 5 9 9 3 5 1 3 1 6 0 0 20 6
Nephrotic syndrome 100 76 49 49 36 59 26 67 14 82 7 78 232 65 Nephritic-Nephrotic
syndrome 4 3 3 3 1 2 3 8 0 0 0 0 11 3
Missing 3 2 5 5 4 7 4 9 0 0 2 22 18 5
Total 131 100 99 100 60 100 39 100 17 100 9 100 355 100
Figure 2.3.3.1 (a): Clinical presentation by age group for FSGS, 2005-2008
2nd Report of the
Malaysian Registry of Renal Biopsy 2008
PRIMARY GLOMERULONEPHRITIS
2.3.3.2: Clinical presentation by gender
From the 4 years of collected data, nephrotic syndrome appears more common in males and more females present as asymptomatic urine abnormality (Table & Figure 2.3.2 (a)). There was no difference in the prevalence of hypertension in both genders (Figure 2.3.3.2(b)).
Table 2.3.3.2 (a): Clinical presentation by gender for FSGS, 2005-2008
Clinical Presentations
Male Female
n % n %
Asymptomatic urine
abnormality 30 16 44 29
Nephritic syndrome 11 5 9 6 Nephrotic syndrome 147 72 85 56 Nephritic-Nephrotic
syndrome 8 4 3 2
Missing 7 3 11 7
Total 203 100 152 100
Figure 2.3.3.2 (a): Clinical presentation by gender for FSGS, 2005-2008
PRIMARY GLOMERULONEPHRITIS
2nd Report of the Malaysian Registry of Renal Biopsy 2008
32
2.3.4: Renal function at presentation
About 59% have normal or well-preserved renal function (eGFR >60 ml/min/1.73m2) on presentation. There were 21% of cases with eGFR range of 30-59 ml/min/1.73m2, 11 % were 15-29 ml/min/1.73m2 and 5% were <15 ml/min/1.73m2 (Table 2.3.4).
Table 2.3.4: Impaired renal function in FSGS by year, 2005-2008 eGFR
2.3.4.1: Renal function at presentation by age
There was a higher risk of renal impairment with increasing age (Table & Figure 2.3.4.1)
Table 2.3.4.1: Renal function at presentation by age group for FSGS, 2005-2008
eGFR
2nd Report of the
Malaysian Registry of Renal Biopsy 2008
PRIMARY GLOMERULONEPHRITIS
2.3.4.2: Renal function at presentation by gender
There were basically no differences between genders in terms of renal function.
Table 2.3.4.2: Renal function at presentation according to gender for FSGS, 2005-2008
eGFR
Figure 2.3.4.2: Renal function at presentation according to gender for FSGS, 2005-2008
2.4: Idiopathic Membranous Nephropathy (IMN)
2.4.1. Introduction
Membranous nephropathy is characterised by subepithelial immune deposits with spikes and thickening of the basement membrane.
2.4.2. Patient population and characteristics
Over the four-year period from 2005-2008, 125 cases of Idiopathic membranous nephropathy (IMN) were reported to the registry. The mean age at biopsy was 45.3 + 14.7, with a range between 19 and 80.8 years (Table & Figure 2.4.2).
Overall, there were slightly more males than females. The racial distribution was 44% in Malays, 40% in Chinese, 6 % in Indians and 10% in others (Table 2.4.2).
Table 2.4.2: Demographic characteristics for IMN, 2005-2008
Demographic characteristics n=125 %
PRIMARY GLOMERULONEPHRITIS
2nd Report of the Malaysian Registry of Renal Biopsy 2008
34
2.4.3: Clinical presentation
The majority of patients (70%) presented with overt nephrotic syndrome. The median level of proteinuria was 3.5 g/day with a range from 0.3- 19.8 g/day. Asymptomatic urinary abnormalities, nephritic-nephrotic syndrome, and nephritic syndrome were found in 22%, 3% and 2% respectively (Table & Figure 2.4.3(a)). Hypertension was found in 21% of cases (Table 2.4.3 9(c)) and 37% presented with eGFR< 60mls/min (Table 2.4.3(c)).
Table 2.4.3 (a): Clinical presentation for IMN, 2005-2008
Clinical Presentations 2005 2006 2007 2008 Total
n % n % n % n % n %
Figure 2.4.3 (a): Clinical presentation for IMN, 2005-2008
Table 2.4.3 (b): Hypertension in IMN, 2005-2008
Hypertension n %
Present 26 21
Absent 97 78
Missing 2 2
Total 125 100
2nd Report of the
Malaysian Registry of Renal Biopsy 2008
PRIMARY GLOMERULONEPHRITIS
2.4.3.1: Clinical presentation by age
Nephrotic syndrome remained the commonest clinical presentation across all age groups, and older patients were less likely to be biopsied for asymptomatic urinary abnormalities (Table & Figure 2.4.3.1 (a)). Comparison with respect to incidence of hypertension is limited by the relatively smaller numbers of patients at both extremes of age.
Table 2.4.3.1(a): Clinical presentation by age group for IMN, 2005-2008 Age group
(years)
15 ≤ 25 25 ≤ 35 35 ≤ 45 45 ≤ 55 55 ≤ 65 > 65 Total
n % n % n % n % n % n % n %
Asymptomatic urine
abnormality 3 27 6 21 4 18 5 18 10 45 0 0 28 22
Nephritic syndrome 0 0 0 0 0 0 2 7 1 5 0 0 3 2
Nephrotic syndrome 7 64 21 75 17 74 19 68 10 45 13 100 87 70 Nephritic-Nephrotic syndrome 1 9 0 0 1 4 2 7 0 0 0 0 4 4
Missing 0 0 1 4 1 4 0 0 1 5 0 0 3 2
Total 11 100 28 100 23 100 28 100 22 100 13 100 125 100
Figure 2.4.3.1 (a): Clinical presentation by age group for IMN, 2005-2008
Table 2.4.3.1(b): Hypertension by age group for IMN, 2005-2008 Hypertension
15 ≤ 25 25 ≤ 35 35 ≤ 45 45 ≤ 55 55 ≤ 65 >65 Total
n % n % n % n % n % n % n %
Present 3 27 4 14 4 17 3 11 8 36 4 31 26 21
Absent 8 73 24 86 18 78 24 86 14 64 9 69 97 78
Missing 0 0 0 0 1 4 1 4 0 0 0 0 2 2
PRIMARY GLOMERULONEPHRITIS
2nd Report of the Malaysian Registry of Renal Biopsy 2008
36
2.4.3.2: Clinical presentation by gender
There were no significant differences in gender with respect to clinical presentation.
Figure 2.4.3.2 (a): Clinical presentation by gender for IMN, 2005-2008
2.4.4: Renal function at presentation
2.4.4.1: Renal function at presentation by age
Majority of cases (62%) had eGFR > 60 ml/min/1.73m2 at presentation. There were 27 % of cases with eGFR range of 30-59 ml/min/1.73m2, 8% in the 15-29 ml/min/1.73m2 and 3% in the < 15 ml/min/1.73m2 (Table & Figure 2.4.4.1 (a)). The proportion of patients with eGFR < 60 ml/min/1.73m2. Increase with age (Figure 2.4.4.1 (b)).
Table 2.4.4.1(a): Renal function at presentation by age group for IMN, 2005-2008 eGFR
Figure 2.4.4.1 (a): Renal function at presentation by age group for IMN, 2005-2008
2nd Report of the
Malaysian Registry of Renal Biopsy 2008
PRIMARY GLOMERULONEPHRITIS
2.4.4.2: Renal function at presentation by gender
Males appear to have worse renal function. Up to 44% of male vs. 31% of females has eGFR < 60 ml/ min/1.73m2 at presentation (Table 2.4.4.2).
Table 2.4.4.2: Renal function at presentation according to gender for IMN, 2005-2008 eGFR
2.5: Ig A Nephropathy (IgAN)
2.5.1: Introduction
IgAN is defined by the predominant deposition of IgA in the glomerular mesangium although light microscopic appearances and clinical features can vary considerably due to the various patterns of histopathologic injury found in this glomerulonephritis.
2.5.2: Patient population and characteristics
Two hundred and twenty-three cases of IgA nephropathy were reported to the registry over the 3-year period of data collection. The mean age at biopsy was 33.8 ± 12.5 years and majority of the cases (81%) were between ages 15 to 45 years (Table & Figure 2.5.2 (b)). As suggested in the previous report, there is slight female preponderance in our cohort (53% vs. 47%), which is contrary to what has been reported in the literature. The ethnic distribution was Malays (51%), followed by Chinese (28%) and Indians (8%) (Table 2.5.2(a)).
Table 2.5.2(a): Demographic characteristics of patients with IgA nephropathy, 2005-2008
Demographic Characteristics n=223 %