i
ACKNOWLEDGEMENTS
The National Eye Database (NED) would like thank each and everyone who have directly or
indirectly contributed to the success of the National Eye Database.
In particular we would like to thank the following:
1. Ophthalmologists, heads of MOH Ophthalmology Departments, doctors in-charge, site
coordinators mainly optometrists and paramedics at all the 36 MOH hospitals with
ophthalmology service and resident optometrists at district hospitals without ophthalmologists.
Thank you for being the source data providers for NED. The success of NED depends on you.
2. Staff Nurse Teng Kam Yoke, NED clinical registry manager at Registry Coordinating Centre.
3. The Division of Research and Technology Support, Ministry of Health, for financial support.
4. Information Technology Personnel; Ms Lim Jie Ying and Mr Sebastian Thoo.
5. Database administrator; Ms Amy R Porle, Web application programmer; Mr Abdul Malik Bin
Tanjeng and Graphics Designer; Mr Azizi Bin Abd Rahman.
6. Clinical Data Management Personnel; Ms Teo Jau Shya and Ms Huziana.
7.
Statistician; Puan Tassha Hilda bt Adnan dan Cik Nadiah Sa’at.
8. Malaysian Society of Ophthalmology, Malaysia Medical Association Foundation, and Alcon
Laboratories Sdn Bhd for providing financial support.
Last but not least, the Director-General of Health for the permission to publish this report.
Thank you.
ii
NED STEERING COMMITTEE MEMBERS 2014
Advisor
Dr Nor Fariza Ngah
Head of Service, Department of Ophthalmology, Hospital Selayang
Chairperson
Dr Mohamad Aziz Salowi
Department of Ophthalmology, Hospital Selayang
Members
Dr Goh Pik Pin
Clinical Research Centre, Ministry of Health
Dr Elias Hussein
Department of Ophthalmology, Hospital Selayang
Dr Zuraidah Mustari
Department of Ophthalmology, Hospital Sultanah Nur Zahirah
Prof Dr Abdul Mutalib Othman
Department of Ophthalmology, Universiti Sultan Zainal Abidin
Dr Zaharidah Abd Kadir
Department of Ophthalmology, Hospital Sultan Abdul Halim
Puan Che Rohani
Cawangan Kualiti & Penyelidikan, Bahagian Sains Kesihatan
Bersekutu, Putrajaya
Secretariat Teng Kam Yoke
iii
ABOUT NATIONAL EYE DATABASE
Introduction
The National Eye Database (NED) is an eye health information system supported by MOH. It is a
clinical database consisting of six patient registries and a monthly ophthalmology service census. The
patient registries are Cataract Surgery Registry, Diabetic Eye Registry, Contact Lens-Related Corneal
Ulcer Surveillance, Glaucoma Registry, Retinoblastoma Registry, and Age Related Macular
Degeneration Registry. The source data producers are eye care providers, currently from the public.
Information collected, both clinical and epidemiological, are very useful in assisting the MOH,
Non-Governmental Organizations, private healthcare providers and industry in the planning, evaluation
and continuous improvement of eye care services, leading to prevention and control of blindness in
the nation.
Vision
An accessible eye health information.
General Objectives of the National Eye Databases
1.
To establish and maintain a web based eye health information system on natural history of
visual threatening eye diseases, which are of public health importance. The information is useful
in the planning and evaluation of eye care service.
2.
To determine the effectiveness of treatment, both clinical outcomes and cost, and to identify
factors influencing outcomes. This serves the needs of outcome assessment.
3.
To provide information necessary to evaluate ophthalmology services through census and key
performance indicators, as well as on safety or harm of products and services used in the
treatment of a disease. This contributes to continuous quality initiative.
4.
To evaluate the accessibility and equity in health care provision. This information enhances
accountability.
5.
To provide a mean of prompt and wide dissemination of epidemiological and clinical information
through web such as real time registries reports and notification of epidemic of contact
lens-related corneal ulcer. This is essential for public health advocacy.
6.
To stimulate and facilitate research on eye diseases.
CATARACT SURGERY REGISTRY
iv
Objectives
1.
To determine the frequency, distribution and practice pattern of cataract surgery in
Malaysia.
2.
To determine the outcomes and factors influencing outcomes of cataract surgery.
3.
To evaluate cataract surgery services based on rate of posterior capsular rupture,
post-operative infection, post-post-operative visual outcome and induced astigmatism.
4.
To stimulate and facilitate research on cataract and its management.
RETINOBLASTOMA REGISTRY
Retinoblastoma registry collects data on the pattern of clinical presentation, mode of treatment and
outcome of patients with retinoblastoma seen at ophthalmology clinics with paediatric ophthalmology
service. The main SDP is Hospital Kuala Lumpur.
Objectives
1.
To determine the incidence and distribution of retinoblastoma in different states in Malaysia.
2.
To determine the ethnic-specific prevalence of retinoblastoma in Malaysia.
3.
To study characteristics of RB patients in terms of clinical presentation and stage of disease
based on International Intraocular Retinoblastoma Classification.
4.
To evaluate types of treatments and monitor treatment trends.
5.
To evaluate treatment outcomes including complications related to treatment.
MONTHLY OPHTHALMOLOGY SERVICE CENSUS
Since 2002, Ophthalmology Service of MOH has been collecting annual census from all the hospitals
with ophthalmology departments. Data include essential service census and key performance
indicators for ophthalmology service. There are 13 sections in the census return, namely out-patients,
inpatients, major eye operations, cataract service, diabetic service, glaucoma service, and optometry
service, and subspecialty services which include vitreoretinal, corneal, paediatric ophthalmology,
oculoplasty, medical retinal, and a public health ophthalmology, and data on training records and
prevention of blindness activities. Data are entered monthly by staff at sites via on-line data entry.
Heads of ophthalmology department can view their own and othe
r hospitals’ real
-time reports.
Objectives
1.
To evaluate service output in all ophthalmology departments.
2.
To study trends in service output and service patterns.
3.
To get baseline and norm from services provided by MOH ophthalmology departments.
4.
To determine norm and set standards for performance indicators for centres which differ in
v
OUTREACH PROGRAMME CENSUS
Ministry of Health (MOH) is the biggest provider of ophthalmology service in the country including
the outreach activities. However, data for these activities conducted by all the Ophthalmology
Departments are not readily available and most are not properly documented.
Due to the increasing number of cataract surgeries performed in MOH facilities, the existence of the
mobile and the satellite cataract services and the expansion in the outreach activities, these data
need to be compiled and organised both at the central and departmental level. These data can
possibly be analysed and be used for the improvement of ophthalmology outreach services in the
country.
Data collected include details of activity, total number of individual screened by age and disease,
total number of referral to ophthalmologist and optometrists, total number of cataract surgeries done
and the updated number of eye trained paramedics.
Objectives
1.
To compile data pertaining to outreach activities by all ophthalmology department in the
country.
2.
To update the number of Primary Eye Care and Ophthalmic Post Basic staff available in the
country.
3.
To study the patients’ demography in the outreach activities
4.
To study the eye disease workload in the outreach activities
5.
To study the cataract surgery workload in the outreach activities
KEY PERFORMANCE INDICATOR
The Ministry of Health (MOH) launched the implementation of Key Performance Indicators (KPIs) in
February 2008 with the aim to assess the overall performance of services provided by Clinical
Departments in MOH. The MOH Ophthalmology Service has identified KPIs which measure clinical
performance of core ophthalmology service such as out-patient service, cataract surgery and diabetic
eye screening.
vi
MEASUREMENT INDICATOR STANDARD
PI
1
Percentage of patients with waiting time of ≤ 90 minutes to see the doctor at specialist clinic
≥ 80% of the patients are seen within ninety (90) minutes
PI 2
KPI
1
Percentage of diabetic patients who were given an appointment for first consultation within 6 weeks
≥ 80% of the patients are given an appointment for First Consultation within 6 weeks
PI
3
Percentage of patients with waiting time of within 16 weeks for cataract surgery
≥ 80% of patients have appointment given for cataract surgery within 16 weeks
PI 4
KPI
2 NIA
Rate of infectious endophthalmitis following cataract surgery (2 cases per 1000 operations)
< 0.2% (2 cases per 1000
Percentage of patients with post-operative visual acuity of 6/12 or better within 3 months following cataract surgery in patients without ocular co-morbidity (850 cases 1000
Cancellation rate of patients listed for cataract surgery under local Anaesthesia
≤ 10% cancellation
PI
7
Number of mortality/morbidity audits/ meetings conducted in the Department (in 6 months)
At least 6 times in 6 months
Note:
PI=Performance Indicator
KPI=Key Performance Indicator
NIA=National Indicator Approach
ADVERSE INCIDENT REPORTING
–
INTRAOCULAR LENS DEFECT
Intraocular lens may have defect during the manufacturing process and implantation into the
patients’ eyes. This ranges from the production of IOL, packaging, distribution, insertion to when
the IOL is already implanted into the patients’ eyes.
This defect may range from manufacturing defect such as no IOL in the box or fracture of haptics
or optics. It may also be in the form of deposits on the IOL or opacification detected weeks to
years after surgery. All these defects will contribute directly to the pa
tients’ visual outcome. Some
defects may require explantation and results in distress to both the patients and the surgeons. The
cost for explantation of an opacified IOL also has to be borne by the patient and eye care
providers.
vii
Objectives
1.
To identify any common defect in IOL
2.
To detect cases with IOL opacification
3.
To study the patients’ characteristics in developing IOL opacification
4.
To study the patient’s outcome following treatment if any
ADVERSE INCIDENT REPORTING
–
SUSPECTED POST OPERATIVE INFECTIOUS
ENDOPHTHALMITIS
This is a complication which can occur following any intraocular surgery. Although uncommon,
once occurred, it may lead to the loss of vision and possible loss of the eye itself. It is a
devastating complication both to the patient, the care provider and the health system as the
treatment is costly the outcome after treatment can be uncertain. Therefore prevention of disease
and surveillance of an outbreak is important. Data in CSR shows a decreasing percentage of
endophthalmitis occurrences following cataract surgery among patients in the Ministry of Health
(MOH) over the years. This is possibly due to the use of prophylactic antibiotics and the general
improvement in technique and care in cataract surgery. However, it is imperative to monitor this
complication closely due to the increasing number of cataract surgeries performed in MOH
facilities, the existence of the mobile and the satellite cataract services and also the expansion in
the outreach activities throughout the countries. Monitoring is also essential to prevent outbreak.
Data collected include demography, possible risk factors, mode of treatment and the outcome
following treatment.
Objectives
1.
To detect outbreak and therefore exercise the necessary measure to control disease
spread
2.
To identify its risk factors or any common risk factors among cases
3.
To study the patients’ characteristics in
developing post-operative infectious
endophthalmitis
4.
To study the patient’s outcome following treatment
CUSUM- OPHTHALMOLOGY
Cataract surgery is the most common procedure done in ophthalmology departments. The procedure
is quite consistent and outcome is measured by visual acuity. Cataract surgery outcome depends
greatly on surgeons’ skill. With advancement in technology and intraocular lens implantation, good
visual outcome is almost certain among patients without pre-existing ocular co-morbidity. Hence,
monitoring and evaluating surgeons’ competency, especially trainees’ performance, are essential in
ensuring standard of care.
viii
Methods of the National Eye Database
The National Eye Database
is designed as a cohort study. It is an online clinical database hosted at
the Association of Clinical Registry Malaysia website at
www.acrm.org.my/ned. Its protocol was
approved by the Medical Research Ethical Committee of MOH on 2
ndSeptember 2008 (reference
number NMRR 08-552-1707) and is accessible at the NED website.
Data collection and data entry are done at SDP sites. Data are collected either using case report
forms (CRF) which are later entered into the web application, or are directly entered into the web
application during the course of clinical work.
Data management using data query are set in the web application to reduce inconsistency,
out-of-range or missing values. Authorised staff at each SDP is given passwords to perform data entry.
Individual SDP reports and aggregated reports based on cumulative data of all SDPs are available
real-time at NED website. These reports are only accessible by heads of department,
doctors-in-charge and site coordinators via authorised password. The web reports are descriptive analysis of
data which have been entered. Annual statistical report will be produced based on data collected for
a specific year. The statistical reports will be published yearly and distributed to users in MOH
divisions and units, all the ophthalmology departments, universities, other relevant public agencies
and non-governmental organisations.
ix
NED Organization
Organisation Chart
Governance /Advisory Board (MOH, public, university, private ophthalmologist) Steering Committee
(Ophthalmologists Optometrists)
Source Data Producers (Heads of Department (Site Co-Investigator)
Doctor s in charge Site Coordinators)
Users
( SDP, MOH, Universities, NGO, Industry Public)
Registry Coordinating Centre (Public health ophthalmologist / epidemiologist
Clinical Registry manager Research Assistant
IT personnel Statistician ) Sub committee/expert panels
•Registry PI/Co-PI
•Independent data monitoring
•Outcome evaluation
•Data access & Publication
•Medical writing
x
NED SOURCE DATA PROVIDERS
LIST OF SITE COORDINATOR FOR 2015
NORTHERN ZONE
No.
SDP
Verified Site
Coordinator
Emails
1.
Hospital Kangar
Roslinda bt Rahman
[email protected]
2.
Hospital Sultanah
Bahiyah
Arni Rehny Ahmad
Rakhli
[email protected]
3.
Hospital Sungai Petani
Juliana Md Desa
[email protected]
4.
Hospital Pulau Pinang
Fazrul Azwan Bin Jaafar
Sidek
Dr Lee Cheng Imm
[email protected]
5.
Hospital Bukit
Mertajam
Norehan Abdul Rani
[email protected]
6.
Hospital Ipoh
Norhazwani Azhar
Dr Wong Wai Kuan
[email protected]
7.
Hospital Taiping
Suzzana Abdul Karim
[email protected]
8.
Hospital Teluk Intan
Sharifah Ayuni Ahmad
Dr Nor Aqidah Kamri
-
9.
Hospital Sri Manjung
Marizah Abd Rahman
[email protected]
10.
Hospital Kulim
Mai Rafa’ah M. Azhar
Dr Kalatheran Saishoo
[email protected]
[email protected]
11.
Hospital Langkawi
Nurul Amirah Mahmud
Zuhudi
-
EASTERN ZONE
No.
SDP
Verified Site
Coordinator
Emails
1.
Hospital Kuantan
Noor Azhari bin Ahmad
[email protected]
2.
Hospital Temerloh
Norhanim bt Ahmad
[email protected]
3.
Hospital Kuala
Terengganu
Azlin Azira Ahmad
[email protected]
4.
Hospital Kota Bharu
Rossaidah binti
Mustapa
[email protected]
5.
Hospital Kuala Krai
Nurulain Mat Zin
[email protected]
6.
Hospital Kemaman
Siti Shuhada Mohamad
Moha
-
7.
Hospital Kuala Lipis
Syahidah Zulkifli
[email protected]
8.
Hospital Machang
Rossaidah binti
Mustapa
[email protected]
9.
Hospital Pasir Puteh
Rossaidah binti
Mustapa
xi
10.
Hospital Pasir Mas
Rossaidah binti
Mustapa
[email protected]
11.
Hospital Setiu
Siti Noraini Ghazali
-
12.
Hospital Tanah Merah
Rossaidah binti
Mustapa
[email protected]
CENTRAL ZONE
No.
SDP
Verified Site
Coordinator
Emails
1.
Hospital Kuala Lumpur
Intan Khusiah Abd
Rahman
-
2.
Hospital Putrajaya
Nur Hafizah Mat Jalil
[email protected]
3.
Hospital Selayang
Nurul Aini Yusoff
-
4.
Hospital Klang
Nik Mazniah Nik Mohd
Zin
[email protected]
5.
Hospital Serdang
Fadhilah Mohd Hilmi
[email protected]
6.
Hospital Sungai Buloh
Nik Nawwar N. M.
Fahmi
Dr Salmah Kamal
Albakri
[email protected]
7.
Hospital Ampang
Noriah binti Abdullah
[email protected]
8.
Hospital Seremban
Sharifah Suzaini Syed
Kuning
-
9.
Hospital Kuala Pilah
Nazura Selamat
[email protected]
SOUTHERN ZONE
No.
SDP
Verified Site
Coordinator
Emails
1.
Hospital Melaka
Eryanti Md Omar
[email protected]
2.
Hospital Johor Baru
Nora Norzareen Abdul
Razak
Dr Nachammai
Ramasamy
[email protected]
3.
Hospital Muar
Roziana Sumardi
[email protected]
4.
Hospital Batu Pahat
Noor Aida Sapiee
[email protected]
5.
Hospital Sultan Ismail
Nursalinah bt Adam
[email protected]
6.
Hospital Kluang
Fatimah Zahara Abdul
Rahim
[email protected]
7.
Hospital Segamat
Nurfadhilah Abd Hamid
[email protected]
xii
No
SDP
Verified Site
Coordinator
Emails
1.
Hospital Umum
Sarawak
Nazirin bin Arshad
[email protected]
2.
Hospital Sibu
Nor Sabrina Sulaiman
Dr Nur Reza Mohd
Nohur
-
3.
Hospital Bintulu
Akmarina Rosnan
[email protected]
4.
Hospital Miri
Haizan Farah
Hamzah
[email protected]
5
Hospital Sarikei
Hawa Mustafa
Dr Oo Kok Tian
[email protected]
6.
Hospital Mukah
Muhd. Ihsan Bin
Abdul Ghani
-
7.
Hospital Sri Aman
Mohamad Akmal
Azemi
-
SABAH
No
SDP
Verified Site
Coordinator
Emails
1.
Hospital Queen
Elizabeth
Valentinus George
-
2.
Hospital Duchess Of
Kent
Muhammad Iqbal
Basri
-
3.
Hospital Tawau
Norhidayah Mohd
Zulkifli Hashim
-
4.
Hospital Keningau
Sit Jo Anne
Dr Chew Chia Chee
-
5.
Hospital Likas
Muhammed Danial A
Razak
xiii
FOREWORD
Beginning 2014, all Ophthalmology Departments in the Ministry of Health (MOH) are required to
appoint a dedicated Medical Officer (MO) to overview
data entry for National Eye Databae (NED). The
implementation is being done in stages. These MOs need to ensure completeness of ascertainment
for all variables captured in various registries and department service/census and to monitor data
entry and data quality particular Cataract Surgery Registry.
Although in some departments, data entry and data quality monitoring have been done by the
Optometrists and Paramedics with some success, there are constraints in terms of time. While a
dedicated medical officer not only can monitor accuracy and completeness of data in the NED,
he/she will eventually use the data collected for improvement of service and to write article for
publication.
In view of the projected surplus of MO in MOH, it is proposed that these MOs be appointed by rotation.
This approach is not only appropriate and relevant but will expose all MOs to NED and in
management early in their career as Ophthalmologists.
Sarawak General Hospital and Selayang Hospital which have appointed dedicated MO to do the task
have shown positive outcomes where data quality and completeness of data entry of both NED and
department’s service census have improved.
xiv
ABBREVIATION
ADED
Advanced Diabetic Eye Disease
NED
National Eye Database
AMD
Age related Macular Degeneration
NPDR
Non Proliferative Diabetic
Retinopathy
CAI
Carbonic Anhydrase Inhibitor
NPL
No Perception Of Light
CF
Counting Finger
OT
Operating Theatre
CLRCU
Contact Lens-Related Corneal Ulcer
PCO
Posterior Capsule Opacification
CSMO
Clinically Significant Macular Odema
PCR
Posterior Capsule Rapture
CMO
Cystoid Macular Oedema
PDR
Proliferative Diabetic Retinopathy
CSR
Cataract Surgery Registry
Phaco Phacoemulsification
DER
Diabetic Eye Registry
PL
Perception Of Light
DM
Diabetes Mellitus
PI
Principal Investigator
DR
Diabetic Retinopathy
RB
Retinoblastoma
ECCE
Extracapsular Cataract Extraction
RCC
Registry Coordinating Centre
FU
Follow Up
SD
Standard Division
HM
Hand Movement
SDP
Source Data Producers
HPT
Hypertension
VA
Visual Acuity
ICCE
Intracapsular Cataract Extraction
VR
Vitreoretinal Surgery
IOL
Intraocular Lens
ZD
Zonular Dialysis
xv
LIST OF CONTENTS
ACKNOWLEDGEMENTS……….………
..
……….………
i
NED STEERING COMMITTEE MEMBERS
………...………..……
ii
ABOUT NED
DATABASE………
..
………...
... iii
NED ORGANIZAT
ION……….………..
... ix
NED SOURCE DATA
PROVIDERS………….………..………..
x
FOREWORD………..
……… x ii i
ABBREVIATIONS
………..………
xiv
LIST OF CONTENTS
………
… … .
x v
LIST OF TABLES………..……….……… xvii
LIST OF FIGURES………
.
………
... xx
EXECUTIVE
SUMMARY………...
... xxiii
REPORT OF SUMMARY
………
... xxiv
CHAPTER 1 : CATARACT SURGERY 2013………..
…….…….
1
1.1 STOCK AND
FLOW………...
... 2
1.2
CHARACTERISTICS OF PATIENT………..
6
1.2.1
Patient demography………..
...6
1.2.2
Medical history………
…….…….
7
1.2.2.1 Systemic co-
morbidity……….
…..……..
7
1.2.2.2
Causes of cataract……….
8
1.2.2.3
First or Fellow Eye Surgery………..
9
1.2.2.4
Past Ocular Surgery of the Operated Eye……….
10
1.2.2.5 Preexisting Ocular Co-
morbidity………
…………
11
1.2.2.6 Pre-
operative Vision………
…..……..
13
1.2.2.7
Target Refractive Power………1
6
1.3
CATARACT SURGICAL PRACTICES………
……….
... 19
1.3.1
Number Of Cataract Surgery by SDP………..
19
1.3.2
Number Of Cataract Surgery by
month………...
... 19
1.3.3
Number Of Cataract Surgery Registered to CSR by State………...
... 20
1.3.4
Surgeon Status………...
... 21
1.3.5
Duration of Surgery………
………..
25
1.3.6
Distribution of Cataract Surgery Performed Under Day Care Setting
………..
………..
25
1.3.7
Distribution of Types of Cataract Surgery……….
29
1.3.8
Distribution of Combined Surgery………
………..
34
1.3.9
Anaesthesia in Cataract Surgery………
36
1.3.10
Intraocular Lens Implantation………...
... 55
1.4 INTRA-
OPERATIVE COMPLICATIONS………...
57
xvi
1.4.2
Intra-operative
Complications by Type of Surgery………...
59
1.4.3
Intra-
operative Complications by Combined Surgery……….
63
1.4.4
Intra-
operative Complications by Types of Local Anaesthesia………..
65
1.4.5
Intra-
operative Complications by Surgeon Status………
.
………..
65
1.4.6
PCR………...
... 69
1.4.7
PCR by Type of Cataract Surgery………..
74
1.5
CATARACT SURGERY OUTCOME……….
75
1.5.1
Post-
operative Complications………
.
………..
….…….
75
1.5.1.1 Post-operative
Infectious Endophthalmitis……….
75
1.5.1.2 Unplanned Return to Operating Theatre (OT)
………..…………..
81
1.5.1.3 Post-operative Follow-
up Period………
………..
82
1.5.2
Post-
operative Visual Acuity……….
………..
83
1.5.2.1 Post-operative Visual Acuity (
All Eyes) ………
………..
83
1.5.2.2 Post-operative Visual Acuity (Eyes without Ocular Co-
morbidity)…...
………..
87
1.5.2.3 Post-operative Visual Acuity 6/12 or Better Among Eyes
without Ocular Co-
morbidity………
..
………..
91
1.5.3
Reasons for No record of Visual
Acuity………...
... 97
1.5.4
Factors Contributing to Post-operative Refracted Visual Acuity of
Worsen than 6/12………...
………..
98
1.5.5
Actual or residual Refractive Power ( Spherical Equivalent )……….. ……
.. 100
CHAPTER 2 : M
ONTHLY OPHTHALMOLOGY CENSUS……….
……..
1 1 0
2.1
Number of ophthalmology departments which have census returns………..
………
. 110
2.2
Number of out-
patient visits at ophthalmology clinics………...
………..
110
2.3
Number of inpatients admitted to
eye wards………..
………..
111
2.4
Number of ocular operations performed……….
………..
111
2.5
Number
of cataract surgeries performed by ECCE and phacoemulsification……..
………..
112
2.6
Trend of cataract surgeries performed by ECCE and phacoemulsification
………..
112
2.7
Diabetic patients seen at ophthalmology clinics………
………..
113
2.8
Number of vitreoretinal surgeries performed at hospitals with
vitreoretinal surgeons………
………..
113
2.9
Number of refractio
ns performed at ophthalmology clinics………..
………..
114
2.10
Number of patients with low vision assessments………..
………..
114
xvii
LIST OF TABLES
Table 1.1(a)
:
Stock and Flow
………..…….
2
Table 1.1(b)
:
Ascertainment for MOH Hospitals
………...………
2
Table 1.1(c)
:
Ascertainment for CSR by SDP
……….………
3
Table 1.2.1
:
Age and Gender Distributions
……….……….………
6
Table 1.2.2.1
:
Distribution of Systemic Co-Morbidity
………..………….
7
Table 1.2.2.2
:
Causes of Cataract
………...…………
8
Table 1.2.2.3
:
First or Fellow Eye Surgery
………...……….
9
Table 1.2.2.4
:
Past Ocular Surgery of the Operated Eye
……….……
10
Table 1.2.2.5
:
Distribution of Pre-existing Ocular Co-Morbidity
……….…
11
Table 1.2.2.6 : Distribution of Pr.e-Operative Vision
……….….
13
Table 1.2.2.7(a) :
Distribution of Target Refractive Power
……….….
16
Table 1.2.2.7(b) :
Distribution of Target Refractive Power (exclude age 0-5 yrs)
……….
16
Table 1.2.2.7(c) :
Distribution of Target Refractive Power
………...……...
17
Table 1.2.2.7(d) :
Distribution of Target Refractive Power (exclude age 0-5 yrs)
………
18
Table 1.3.1
:
Range of Cataract Surgery Registered by SDP per year
Census versus CSR 2002-2013
………...………
19
Table 1.3.2
:
Number of Cataract Surgery by Month
………
19
Table 1.3.4
:
Surgeon Status
……….
21
Table 1.3.4.1
:
Surgeon Status for Phacoemulsification surgery
………..
21
Table 1.3.4.2
:
Surgeon Status for ECCE
……….……
21
Table 1.3.4(a) :
Specialist by SDP
………..
22
Table 1.3.4(b) :
Gazetting Specialist by SDP
……….………
23
Table 1.3.4(c) :
Medical Officer by SDP
……….…
24
Table 1.3.5(a) :
Duration of Surgery by Types of Cataract Surgery in minutes
…………..…..
25
Table 1.3.5(b) :
Duration of Surgery by Surgeon Status
……….
25
Table 1.3.6(a) :
Distribution of Cataract Surgery Performed Under Day Care Setting
..…….
26
Table 1.3.6(b) :
Distribution of Cataract Surgery (Excluding Children and
Combined Surgery) Performed as Day Care by SDP
……….
27
Table 1.3.7(a) :
Distribution of Types of Cataract Surgery
……….
29
Table 1.3.7(b) :
Distribution of Types of Cataract Surgery by SDP
………
31
Table 1.3.7(c) :
Distribution of Phacoemulsification by SDP
……….
32
Table 1.3.7(d) :
Distribution of ECCE by SDP
………
33
Table 1.3.8(a) :
Distribution of Combined Surgery all SDP
……….
34
Table 1.3.8(b) :
Distribution of Combined Surgery by SDP
………
35
Table 1.3.9.1(a) :
Types of Anaesthesia all SDPs
………
36
Table 1.3.9.2(a) :
Types of Anaesthesia all SDPs and more 50yrs
………
37
Table 1.3.9.1(b) :
Types of Anaesthesia by SDPs
………..
38
xviii
Table 1.3.9.1(c) :
Types of Local Anaesthesia by SDPs
……….……….
40
Table 1.3.9.2(c) :
Types of Local Anaesthesia by SDPs and 50yrs above
…….……….…
41
Table 1.3.9.1(d) :
Types of Local Anaesthesia by SDPs Excluding Combined Surgery
…...….
42
Table 1.3.9.2(d) :
Types of Local Anaesthesia by SDPs 50yrs above and
Excluding Combined Surgery
…….……….……….
44
Table 1.3.9.1(e) :
Subtenon Anaesthesia by SDPs
………..…………
45
Table 1.3.9.2(e) :
Subtenon Anaesthesia by SDPs and 50yrs
………
46
Table 1.3.9.1(f) :
Topical Anaesthesia by SDPs
……….
47
Table 1.3.9.2(f) :
Topical Anaesthesia by SDPs and 50yr
………
48
Table 1.3.9.1(g) :
Types of Sedation in Eyes Given Local Anaesthesia by SDPs
………
49
Table 1.3.9.2(g) :
Types of Sedation in Eyes Given Local Anaesthesia and
age 50yrs above by SDPs
………
50
Table 1.3.9.1(h) :
Oral Sedation Alone by SDPs
……….
51
Table 1.3.9.2(h) :
Oral Sedation Alone and Age 50yr Above by SDPs
………
52
Table 1.3.9.1(i) :
Intravenous Sedation Alone by SDPs
………
53
Table 1.3.9.2(i) :
Intravenous Sedation Alone and Age 50yr above by SDPs
………
54
Table 1.3.10(a) :
Intraocular Lens Implantation
……….…
55
Table 1.3.10(b) :
Distribution of IOL Placement by SDP
………
56
Table 1.4.1(a) :
Distribution of Type of Intra-operative Complications
……….
57
Table 1.4.1(b) :
Distribution of Type of Intra-operative Complications
–
Posterior Capsule Rupture
……….………
58
Table 1.4.2(a) :
Intra-operative Complications by Types of Cataract Surgery
…..….………
59
Table 1.4.2(b) :
Distribution of Types of Intra-operative Complications
by Specific Types of Cataract Surgery
……….………
60
Table 1.4.2(c) :
Distribution of Types of Intra-operative Complications by SDP
……...…..….
61
Table 1.4.2(d) :
Distribution of Types of Intra-operative Complications in
"Phaco Converted to ECCE" by SDP
……….……….
62
Table 1.4.3(a) :
Distribution of Intra-operative Complications by Any Combined Surgery
.…
63
Table 1.4.3(b) :
Distribution of Intra-operative Complications by
Specific Combined Surgery
……….……….
63
Table 1.4.3(c) :
Distribution of Intra-operative Complications when
Combined with Filtering Surgery
……….
64
Table 1.4.3(d) :
Distribution of Intra-operative Complications when
Combined with VR Surgery
……….…….
64
Table 1.4.4
:
Intra-operative Complications by Types of Local Anaesthesia
………….…..
65
Table 1.4.5(a)(i) :
Percentage of Intra-operative Complications by Surgeon Status
……….….
65
Table1.4.5(a)(ii) :
Percentage of Intra-operative Complications by
Surgeon Status for Phacoemulsification
………
67
Table 1.4.6 (i) :
PCR by SDP
……….………...
69
xix
Table 1.4.7
:
PCR by Type of Cataract Surgery
……….………
74
Table 1.5.1
:
Distribution of Cataract Surgery with Post-operative
Complication Record
……….
75
Table 1.5.1.1(a) :
Post-operative Infectious Endophthalmitis
………
75
Table 1.5.1.1(b) :
Time from Surgery to Diagnosis of Post-operative
Infectious Endophthalmitis
……….………
80
Table 1.5.1.2(a) :
Unplanned Return to OT
………
81
Table 1.5.1.2(b) :
Reasons for Unplanned Return to OT
………
81
Table 1.5.1.2(c) :
Time from Surgery to Unplanned Return to OT
…….………
82
Table 1.5.1.3(a) :
Median Follow-up Period for Eyes with Unaided Vision
(in weeks) by Types of Surgery
…….………
82
Table 1.5.1.3(b) :
Median Follow-up Period for Eyes with Refracted Vision
(in weeks) by Types of Surgery
……….………
83
Table 1.5.2.1
:
Post-operative Visual Acuity, All Eyes
………
83
Table 1.5.2.2
:
Post-Operative Visual Acuity for Eyes without Ocular Co-morbidity
….……
87
Table 1.5.2.3(a) :
Post-operative Visual Acuity 6/12 or Better for Eyes without
Ocular Co-morbidities by Types of Surgery
……….………
91
Table 1.5.2.3(b) :
Post-operative Refracted Visual Acuity 6/12 or Better in Eyes without
Ocular Co-morbidities by Complications and Types of Surgery
……….……
93
Table 1.5.2.3(c) :
Post-operative Refracted Visual Acuity 6/12 or Better in Eyes without
Ocular Co-morbidities by Surgeon Status and Types of Surgery
………….
93
Table 1.5.2.3(d) :
Post-operative Refracted Visual Acuity 6/12 or Better for Patients without
Ocular Co-morbidities by SDP and Types of Surgery
…….……….
95
Table 1.5.3
:
Reasons for No Records of Visual Acuity
………
97
Table 1.5.4(a) :
Factors Contributing to Post-operative Refracted VA of Worse than
6/12 in All Eyes
……….……….……….
98
Table 1.5.4(b) :
Factors Contributing to Post-operative Refracted VA of Worse than
6/12 in Eyes without Preexisting Ocular co-morbidity
……….………
99
Table 1.5.5(a) :
Distribution of Target and Actual Refractive Power in ECCE and Phaco
…
100
Table 1.5.5(b) :
Percentage Distribution of Target and Actual Refractive Power in
ECCE and Phaco
……….
101
Table 1.5.5(c) :
Difference in Target and Actual Refractive Power for Patients
who had Phacoemulsification Only
………
104
Table 1.5.5(d) :
Percentage of
Difference in Target and Actual Refractive Power
within ±1.0D by SDP
………
107
Table 1.5.5(e) :
Post-operative visual acuity and week of outcome notification
………
108
xx
LIST OF FIGURES
Figure 1.1(a)
:
Stock and flow
………...3
Figure 1.1(c)
:
Ascertainment for CSR by SDP in 2013
………4
Figure 1.2.1
:
Age Distribution
……….7
Figure 1.2.2.1 :
Percentage of Patients with Specific Ocular Co-
morbidity……….8
Figure 1.2.2.4 :
Percent Distribution of Past Ocular Surgery of the Operated Eye
…………10
Figure 1.2.2.5 :
Percent Distribution of Eyes with Diabetic Retinopathy,
Glaucoma or Lens-
induced Glaucoma……….12
Figure 1.2.2.6(a) : Distribution of Pre-Operative Vision (Unaided/presenting and refracted
)…13
Figure 1.2.2.6(b) : Distribution of Pre-Operative Vision (Unaided)
………15
Figure 1.2.2.6(c) :
Distribution of Pre-Operative Vision (Refracted),
………..15
Figure 1.3.2
:
Number of Cataract Surgeries by Month
….……….20
Figure 1.3.3
:
Number of Cataract Surgery Registere
d to CSR by State……….20
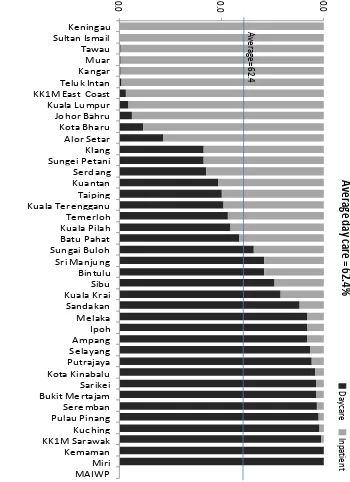
Figure 1.3.6(a) :
Distribution of Cataract Surgery Performed as Day Care by
SDP, CSR 2013
………28
Figure 1.3.6(b) :
Distribution of Cataract Surgery Performed as Day Care and In-patient
by SDP (Excluding Surgery Done in Children and Combined
Surgery)…...28
Figure 1.3.6(c) :
Distribution of Cataract Surgeries Performed as Day Care all SDPs
(Excluding Surgery Done in
Children and Combined Surgery)……….29
Figure 1.3.7
:
Distribution of Phacoemulsification, ECCE and Phaco Converted
to ECCE
……….30
Figure 1.3.8(a) :
Distribution of Specific Combined Surgery
………...34
Figure 1.3.9
: Types of Ana
esthesia all SDPs………..37
Figure 1.3.10
:
Intraocular
Lens Implantation……….57
Figure 1.4.1
:
Distribution of Specific Type of Intra-
operative Complications………..58
Figure1.4.2
:
Intra-operative Complications by Types of Cataract Surgery
………59
Figure 1.4.5 (i) : Percentage Distribution of Intra-operative Complications (All Surgery)
by Surgeon Status
………....67
Figure 1.4.5 (ii) : Percentage Distribution of Intra-operative Complications
(in Phacoemulsification)
by Surgeon Status……….…68
Figure 1.4.6(a)(i) : PCR by SDP (all surgeries), CSR 2013-Bar Chart
……….……72
Figure1.4.6(b)(ii) : PCR by SDP (Phaco only), CSR 2013-Bar Chart
………..72
Figure 1.4.6(c)(i) :
PCR by SDP (all surgeries), CSR 2013-
Radar Chart ………73
Figure1.4.6(d)(ii) : PCR by SDP (Phaco only), CSR 2013-Radar Chart
………..73
Figure 1.4.7
:
P
CR by Type of Cataract Surgery……….74
Figure 1.5.1.1(a) : Rate of Post-operat
ive Infectious Endophthalmitis………..75
Figure1.5.1.1(b-i) : Post-operative Infectious Endophthalmitis, by SDP CSR 2007
……….76
Figure1.5.1.1(b-ii) :
Post-operative Infectious Endophthalmitis, by SDP CSR 2008
……….76
Figure1.5.1.1(b-iii) :
Post-operative Infectious Endophthalmitis, by SDP CSR 2009
……….76
xxi
Figure1.5.1.1(b-v) : Post-operative Infectious Endophthalmitis, by SDP CSR 2011
……….77
Figure1.5.1.1(b-vi) :
Post-operative Infectious Endophthalmitis, by SDP CSR 2012
……….77
Figure1.5.1.1(b-vii) :
Post-operative Infectious Endophthalmitis, by SDP CSR 2013
……….78
Figure1.5.1.1(c-i) :
Post-operative Infectious Endophthalmitis, by SDP CSR 2007
……….78
Figure1.5.1.1(c-ii) :
Post-operative Infectious Endophthalmitis, by SDP CSR 2008
……….78
Figure1.5.1.1(c-iii) :
Post-operative Infectious Endophthalmitis, by SDP CSR 2009
……….79
Figure1.5.1.1(c-iv) :
Post-operative Infectious Endophthalmitis, by SDP CSR 2010
……….79
Figure1.5.1.1(c-v) :
Post-operative Infectious Endophthalmitis, by SDP CSR
2011……….79
Figure1.5.1.1(c-vi) :
Post-operative Infectious Endophthalmitis, by SDP CSR 2012
……….80
Figure1.5.1.1(c-vii) :
Post-operative Infectious Endophthalmitis, by SDP CSR 2013
……….80
Figure 1.5.1.2 :
Reasons for Unpla
nned Return to OT………..82
Figure 1.5.2.1(a) : Percent Distribution of Post-operative Unaided and
Refracted Visual
Acuity………84
Figure 1.5.2.1(b) : Post-operative Unaided and Refracted Visual Acuity by
Visual Cate
gory for All Eyes………86
Figure 1.5.2.2(a) :
Post-Operative Visual Acuity for Eyes without Ocular Co-morbidity
……….88
Figure 1.5.2.2(b) : Post-operative Visual Acuity by Visual Category for Eyes
without Ocular Co-
morbidity………90
Figure 1.5.2.3(a) : Post-operative Visual Acuity 6/12 or Better for Eyes
without Ocular Co-morbidities by ECCE and Phaco
………...92
Figure 1.5.2.3(b) : Post-operative Refracted Visual Acuity 6/12 or Better in Eyes without
Ocular Co-morbidities by Surgeon Status and Types of Surgery
……...…….93
Figure 1.5.2.3(c) :
Post-operative Refracted Visual Acuity 6/12 or Better for Patients
without Ocular Co-morbidities by
SDP and All Surgeries………….………...96
Figure 1.5.2.3(d) : Post-operative Refracted Visual Acuity 6/12 or Better for Patients
without Ocular Co-morbidities by SDP f
or Phacoemulsification………..……96
Figure 1.5.2.3(e) : Post-operative Refracted Visual Acuity 6/12 or Better for Patients
without Ocular Co-morbiditi
es by SDP for ECCE………97
Figure 1.5.4
:
Factors Contributing to Post-operative Refracted VA of Worse
than 6/12 in All Eyes……….99
Figure 1.5.5(a) :
Percentage Distribution of Actual Refractive Power
in ECCE and Phaco
……….………103
Figure 1.5.5(b) :
Difference in Target and Actual Refractive Power for Patients who
had Phacoemulsification Only………...106
Figure 2.1
:
Number of out-patient visits at ophthalmology clinics
……….110
Figure 2.2
:
Number of inpatients admitted to eye wards.
………..111
Figure 2.3
:
Number of ocular o
perations* performed………..111
Figure 2.4
: Number of cataract surgeries, ECCE and phacoemulsification performed..112
xxii
Figure 2.7 : Number of vitreoretinal surgeries performed at hospitals with
vitreoretinal surgeons………..113
Figure 2.8
:
Number of refractions performed at ophthalmology clinics
………114
Figure 2.9
: Number of patients with low vision assessments
……….114
Figure 2.10
:
Number of premature infants screened for retinopathy of prematurity
xxiii
EXECUTIVE SUMMARY
Throughout the years of Cataract Surgery Registry, there are similar patient related issues which
have to be addressed. They include the increasing number of patients with Hypertension and
Diabetes Mellitus and low percentage of patients who had fellow eye cataract surgery. While
peri-operative management of blood pressure and blood sugar will ensure good visual outcome, creating
patient awareness on the need for fellow eye surgery so as to achieve good binocular vision is also
important.
It is encouraging to see an increasing number of patients operated as daycare, with almost 2/3 of
patients. Besides, proportion of patients operated using Phaco technique has increased remarkably
from 81.1% in 2012 to 85.1% in 2013
Although the number of cataract surgery performed at MOH hospitals has increased throughout the
years, there is a decrease in proportion of phaco among cataract surgery done by the medical officers.
As there is significant backlog of cataract blindness as seen in 2014 National Eye Survey, the MOH
needs to strategize approaches to increase cataract surgery rate but also have training to enhance
medical officers’ skill in performing phaco so as to improve quality of care and good visual outcome
for patients.
xxiv
REPORT SUMMARY
CATARACT SURGERY REGISTRY
1.
Stock and Flow
The number of SDP increased from 25 SDPs in 2002 to 41 SDPs in 2013 onwards.
The total number of cataract surgery registered to CSR increased from 12798 in 2002 to 37150 in
2013.
The CSR ascertainment slightly reduced from 94.5% to 94.3% in 2013.
2.
Characteristics of Patients
The mean age of patients at the time of cataract surgery was 65.7 in 2013. This age was younger
than data published by the Swedish cataract surgery register (74 years old).
Up to 1/3 of patients presented within the age group of 65-74 years old (39.3% in 2013).
The proportion of patients with systemic co-morbidity increased from 56.8% in 2002 to 74.8% in
2013.
There was an increase in the proportion of patients presented for cataract surgery who had
hypertension (from 35.4% in 2002 to 60.1% in 2013) and diabetes mellitus (from 28.9% in 2002 to
43.3% in 2013).
Senile cataract was the commonest cause of primary cataract (99.2 % in 2013).
Trauma was the commonest cause for secondary cataract (58.9% in 2013).
The proportion of patients who returned for cataract surgery in the fellow eye remained the same
from 2002 to 2012, i.e. only one third (35.1% in 2013).
Majority of the eyes had no prior ocular surgery (97.4% in 2013).The commonest prior ocular
surgery was vitreoretinal surgery (1.0% in 2013).
One third of the eyes had ocular morbidity (40.6% in 2013). The commonest ocular
co-morbidity was diabetic retinopathy in any forms (10.6% in 2013).
About half of the eyes had unaided vision in the category of 2/60-NPL (44.3% in 2013).
Refraction was not done in more than 2/3 of the eyes (77.3% in 2013).
Bimodal pattern of pre-operative vision was consistently observed over the years with one peak at
the range between 6/18 to 6/36 and another peak at CF-HM.
xxv
3.
Cataract Surgery Practice Patterns
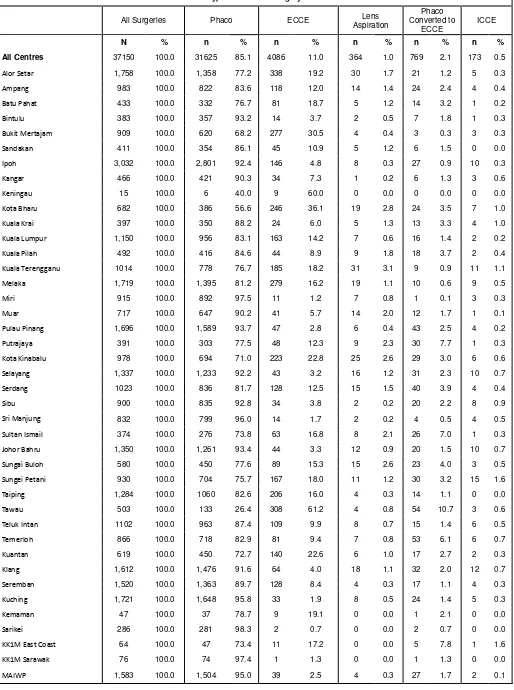
The number of cataract surgery performed by SDPs varied. In 2013, out of the 41 SDPs, 13
performed less than 500 surgeries, 13 performed between 501 to 1000, and 15 performed more
than 1000 cataract surgeries a year.
Selangor (5 SDPs), Perak (4 SDPS)and Sarawak (5 SDPS), performed higher number of cataract
surgeries compared to other state.
More than 2/3 of the cataract surgery was performed by specialists (88.5% in 2013).
The percentage of cataract surgery done by medical officers is decreasing (both phaco and
ECCE)
The median duration taken to do a cataract surgery was 25 min for phaco and 45 min for ECCE
in 2013.
Though there is an increasing trend for day care surgery, from 39.3% in 2002 to 62.4% in 2012,
the percentage varied among SDPs. In 2013, 1 SDP did not perform any cataract surgery under
day care, 13 SDPs performed less than 50.0%. Only 14 SDPs performed more than 90.0% of
cataract surgery as day care.
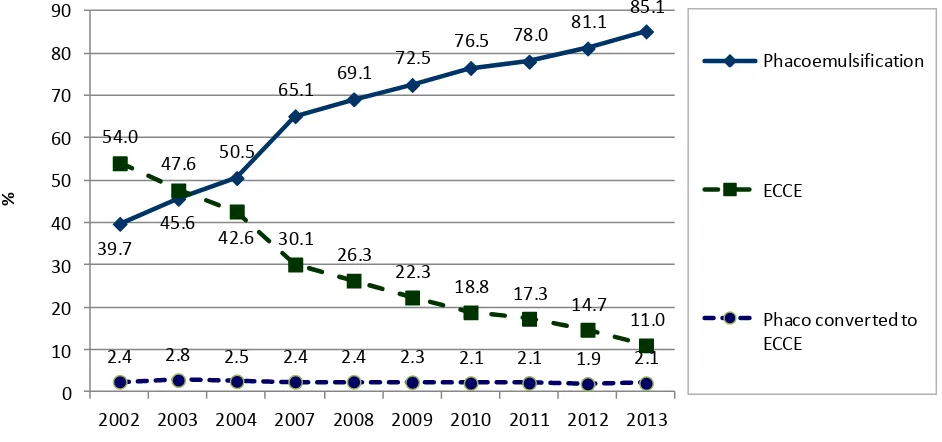
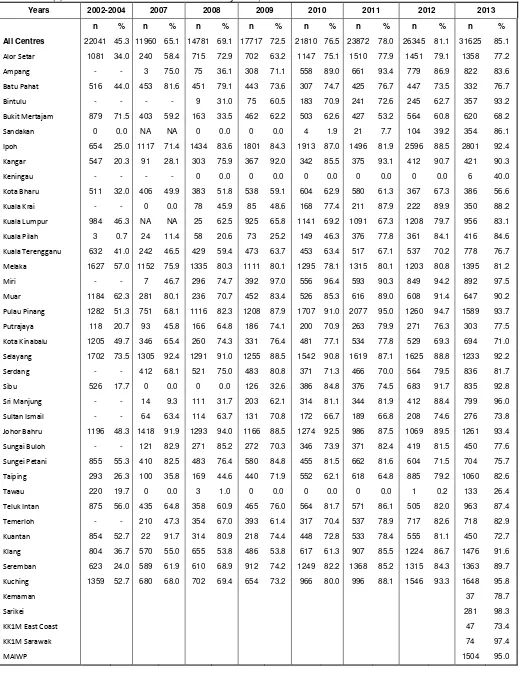
Phaco was the preferred method of cataract surgery and the proportion increased from 39.7% in
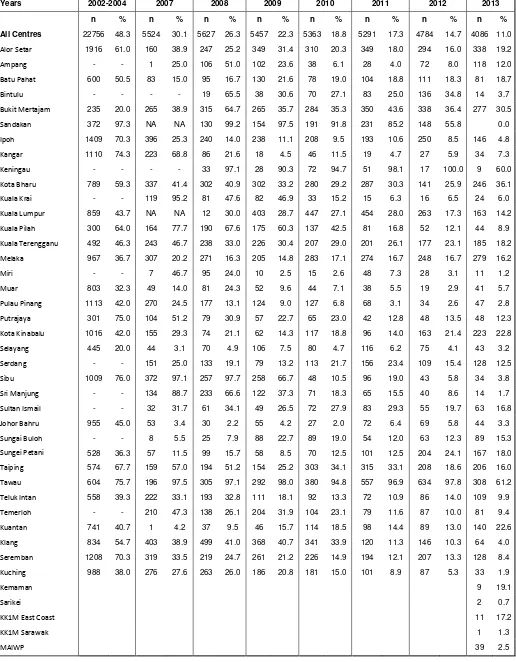
2002 to 85.1% in 2013. Percentage of ECCE decreased from 54.0% in 2002 to 11.0% in 2013.
The preferred IOL material was acrylic and non-foldable type.
The percentage of phaco converted to ECCE was 2.1% in 2013. It remained the same over the
years.
Among combined surgery, VR surgery was the highest, while filtering surgery and pterygium
surgery showed a decreasing trend.
Majority of cases were done under local anaesthesia (93.2% in 2013). The preferred type of local
anesthesia was topical (64.2% in 2013).
The use of topical anesthesia has increased from 11.7% in 2002 to 64.2% in 2013.
The use of retrobulbar anesthesia has decreased from 25.9% in 2002 to 1.5% in 2012.
There is a decrease in the use of oral sedation (33.3% in 2002 to 64.2% in 2013).
Majority of the patient operated had IOL implantation (98.4% in 2013). Among these patients who
had IOL, 96.3% had posterior chamber IOL.
4.
Intra-operative Complications
The percentage of intra-operative complication increased from 5.2% in 2012 to 5.4% in 2012
PCR was maintained at 2.7% in 2013.
Intra-op complication was seen among 49.8% of patients who had phaco converted to ECCE and
39.3% who had ICCE in 2013.
xxvi
5.
Cataract Surgery Outcome
In average, more than 85.0% of patient registered to CSR had cataract surgery outcome data.
The percentage of patients with post-operative endophthalmitis increased from 0.04% in 2012 (13
patients) to 0.08% in 2013 (27 patients).
The percentage of patients with unplanned return to OT showed a decreasing trend, 0.30% in
2013.
Iris prolapse showed a decreasing trend but wound dehiscence, high post- operative IOP and IOL
related problem demonstrated an increasing trend. IOL related problem demonstrated otherwise
In eyes without ocular co-morbidity, less than 50.0% of eyes had post-op unaided visual acuity
6/12 or better and the patterns were consistent over the years. With refraction, more than 80.0%
achieved post-op vision 6/12 or better (81.0% in 2002, 89.0% in 2003, 90.0% in 2004, 84.0% in
2007, 88.0% in 2008, 90.9% in 2009, 92.0% in 2010, 92.4% in 2011, 92.6% in 2012 and 93.3% in
2013). This observation suggested that poor post- op unaided vision was due to refractive error
and patients’ vision could be improved with glasses.
Patients who had phaco had better post-op visual outcome when compared to other type of
surgeries. 94.5% of phaco patients had refracted vision of 6/12 or better in 2013 as compared to
ECCE (83.0%), phaco convert to ECCE (77.9%), lens aspiration (85.4%) and ICCE (80.0%).
Post-op visual outcome improved over the years. Refracted visual outcome of 6/12 or better
among phaco patient improved from 87.0% in 2002 to 94.25% in 2013 and among ECCE patients
from 78.0% in 2002 to 83.0% in 2013.
In all type of surgeries, visual outcome became less favourable when there were intra-operative
complications.
The post-op visual outcomes within 1 week to 3 months was better in eyes with IOL implantation
compared to non IOL, in eyes with foldable IOL and IOL made of acrylic.
The main contributing factor for eyes with post-operative refracted VA worse than 6/12 was
pre-existing ocular co-morbidity followed by high astigmatism and posterior capsule opacification.
When patients with preexisting ocular co-morbidity were excluded from analysis, high astigmatism
followed by preexisting ocular co-morbidity (not detected preoperatively) were the major causes of
poor visual outcome.
In 2013, the mean difference between target and actual refraction was -0.3D for all eyes, -0.6D for
phaco eyes, and -0.9D for ECCE eyes. Thus, eyes which had undergone ECCE had more
myopic shift than eyes which had phaco.
In 2013, there was disparity between the targeted and the actual refraction. 30.9% of eyes had a
different in target and actual refraction of between 0 and -0.5D, and 23.7% had a different of
between 0 to +0.5D.
1
CHAPTER 1
CATARACT SURGERY REGISTRY 2013
Contributing Editors
Mohamad Aziz Salowi
Goh Pik Pin
Nor Sharina Yusof
Adlina Abdul Rahim
2
CHAPTER 1: CATARACT SURGERY REGISTRY
1.1 STOCK AND FLOW
The number of CSR source data provider (SDP) continued to increase over the years; from 25 SDPs in 2002 to 41
SDPs in 2013. The number of cataract surgeries being registered to CSR also increased from 12798 in 2002 to 37150
in 2013.
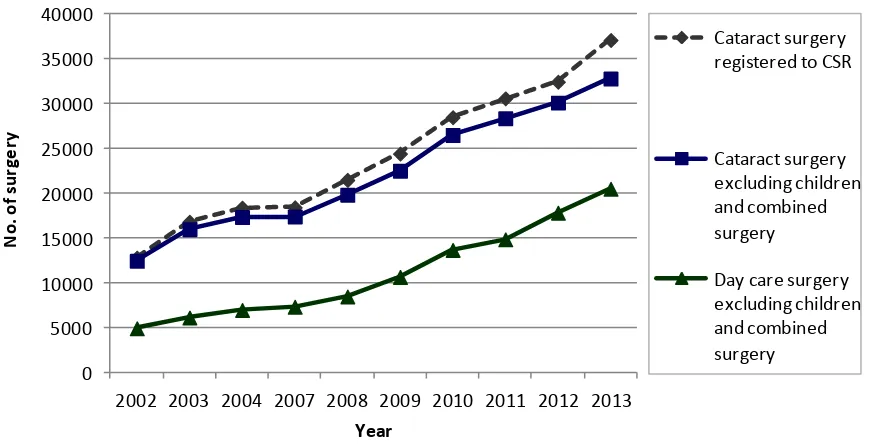
From 2002-2004, CSR was a paper-based registry. During this period, there was a decrease in the percentage of
eyes with visual outcome recorded in CSR. When the web-based registry was introduced in 2007, there was an
increasing trend of this percentage.
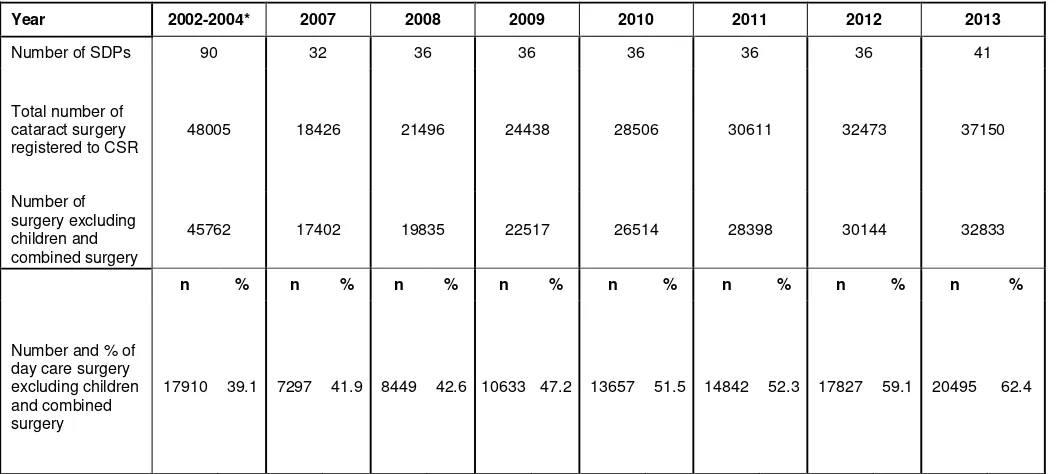
Table 1.1(a): Stock and Flow
Year 2002-2004* 2007 2008 2009 2010 2011 2012 2013
No. of SDP - 32 36 36 36 36 36 41
Total no. of cataract surgery registered to CSR
48005 18426 21496 24438 28506 30611 32473 37150
n % n % n % n % n % n % n % n %
Cataract surgery with visual outcome records
33423 69.2 15786 85.7 19063 88.7 20590 84.3 24521 86.0 27219 88.9 28589 88.0 33063 89.0
*2002, 2003 and 2004 included private centre and University Hospital
Table 1.1(b): Ascertainment for MOH Hospitals, CSR 2002-2013
Year 2002-2004 2007 2008 2009 2010 2011 2012 2013
Total number of cataract surgery performed at MOH Hospitals (Source: MOH census returns)
49698 22051 25393 26274 29873 32099 34363 39389
Total number of cataract surgery performed at MOH hospitals and registered to CSR
46127 18426 21496 24438 28506 30611 32473 37150
3
Figure 1.1(a): Stock and flow
Table 1.1(c): Ascertainment for CSR by SDP in 2013
Ascertainment
2002
2003
2004
2007
2008
2009
2010
2011
2012
2013
N
o.
Year
4
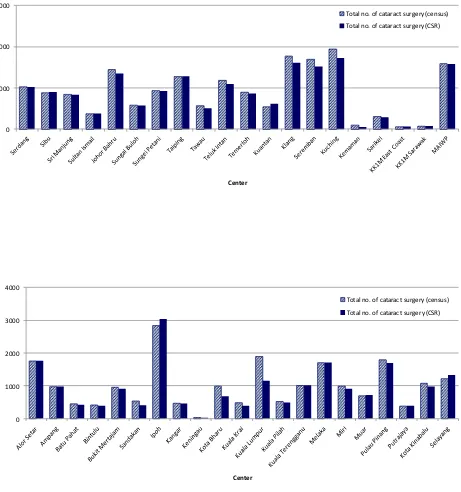
Figure 1.1(c): Ascertainment for CSR by SDP in 2013
0
5
Figure 1.1(c): Ascertainment for CSR by SDP in 2013
0 1000 2000 3000 4000
Center
Total no. of cataract surgery (census)
Total no. of cataract surgery (CSR)
0 1000 2000 3000
Center
6
1.2 CHARACTERISTICS OF PATIENT
1.2.1
Patient Demography
The mean age for patients presented for cataract surgery was 65. A larger percentage of patients presented within the
age group of 65-74 years old except for the year 2007 (75-84 years old). There was no marked gender difference over
the years.
Table 1.2.1: Age and Gender Distributions, CSR 2002-2013
Year 2002-2004* 2007 2008 2009 2010 2011 2012 2013
Total number of
cataract surgery 48005 18426 21496 24438 28506 30611 32473 37150
7
Figure 1.2.1: Age Distribution, CSR 2002-2013
1.2.2
Medical history
1.2.2.1 Systemic co-morbidity
The common systemic co-morbidity encountered in patients who came for cataract surgery were hypertension,
diabetes mellitus, ischemic heart disease and renal failure The overall percentage of such patients showed an
increasing trend over the years. The percentages of patients with hypertension and diabetes mellitus were increasing.
Table 1.2.2.1: Distribution of Systemic Co-Morbidity, CSR 2002-2013
Year 2002-2004 2007 2008 2009 2010 2011 2012 2013
No of patients (N) 48005 18426 21496 24438 28506 30611 32473 37150
Percentage of patients with any systemic co-morbidity
58.6 67.5 68.7 71 70.6 72 72.4 74.8
Percentage of patients with specific systemic co-morbidity
n % n % n % n % n % n % n % n %
1. Hypertension 18362 38.3 8630 46.8 10932 50.9 13050 53.4 15630 54.8 17238 56.3 18655 57.5 22327 60.1 2. Diabetes Mellitus 14630 30.5 6869 37.3 8188 38.1 9556 39.1 11598 40.7 12778 41.7 13635 42.0 16073 43.3 3. Ischaemic Heart
Disease 4468 9.3 1668 9.1 2037 9.5 2294 9.4 2441 8.6 2515 8.2 2565 7.9 3026 8.1 4. Renal Failure 865 1.8 461 2.5 624 2.9 679 2.8 804 2.8 814 2.7 822 2.5 1021 2.7 5. Cerebrovascular
accident 445 0.9 0 0 29 0.1 305 1.2 302 1.1 380 1.2 352 1.1 444 1.2
6. COAD/Asthma 2531 5.3 798 4.3 955 4.4 1039 4.3 1024 3.6 1088 3.6 1104 3.4 1340 3.6 7. Others 4205 8.8 1399 7.6 1974 9.2 2460 10.1 2891 10.1 3538 11.6 3916 12.1 5766 15.5
Number or percentage may be more than total or 100% as patients might have more than one systemic co-morbidity
0
2000
4000
6000
8000
10000
12000
14000
16000
<1
1-14
15-24
25-34
35-44
45-54
55-64
65-74
75-84
>=85
N
o.