NEW APPROACHES IN HAVY DUTIES INDUSTRIAL PROCESSES MONITORING BY USING SMART SENSORS
Mircea Ris¸teiu, Ioan Ilean˘a and Simona Duma
Abstract. The paper is focused on researching the new ways of control-ling and monitoring the complex equipments from heavy industries as mining industry is. Based of the newest technologies in the area of sensors and com-munication systems we have tested wireless sensors systems connected to the general communication networks as Internet and Intranet. We propose ultra low power sensors systems
Keywords: process monitoring, smart sensors, Zigbee technology, 1. Introduction. Targeted industrial processes.
A big challenge for control and monitoring process in any industry is the measurement setup. Any approach, from designing, implementing, until use in situ, as measurement-based modeling or control asks for very reliable and accurate data. The main difficulties in reaching this issue are related to the industrial process structure. For instance, in the mining industry, the basic machines and systems include:
• Bucket wheel and bucket chain excavators
• Mobile transfer conveyors, belt conveyors and steep/curved belt convey-ors
• Tripper cars and transport crawlers • Spreaders and cross-pit spreaders • Mobile and semi-mobile crushers • Surface Miners
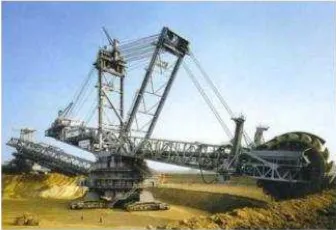
Figure 1: Tipical view of a mining excavator
The bucket wheel excavator’s actual process of digging is realized by com-bining continuous rotation of the boogie-wheel in the vertical plane with the arrow’s movement in the horizontal plane (figure 1).
As a result of the drive’s performances, characteristics of the soil, and inequality of digging resistances on the spoons, the bucket wheel excavator is subject to a number of external loads with a dynamic random character of change. As a consequence, the vital parts of the excavator’s structure and of its driving systems are exposed to changeable load, which, when it exceeds critical values, causes damage and delay in the work of the entire system. The total machine (excavator plus loading unit) has a service weight of 5,730t and has been designed for a theoretical capacity (bulk material) of 11,000m3
/h. Parallel to the erection the bucket wheel gearbox (SRG) of 3 x 630kW was dismantled and an intensive inspection and technical analysis by experts was performed.
2. The parameter classes of reliability calculation for the excavator
The problem outlined, explains the time and money factors that are in-volved in changing an excavator bucket, and how a system that could minimize down time of the excavator would be beneficial, to both operator and down time of the machine.
out of the excavator cab to check the direction that the boom/arm needs to move for exact alignment of the holes. This poses a fundamental safety issue as:
• the operator is getting out of a 60 ton (approx.) excavating machine with the engine ticking over, so there is potential for the machine to move and possibly cause human injury.
• the operator is having to climb out of the machine down ladders, in most cases standing on the caterpillar tracks of the excavator, which can be slippery.
• some operators will lean into the excavator to make small adjustments to the arm position, pushing the direction levers, whilst standing on the tracks outside the cab.
Based of the practice experience we follow sets of parameters: a. Predictive Maintenance Defined
• Emergency vs. Preventive vs. Predictive Maintenance • Steps toward a Predictive Approach
• The Spectrum of Predictive Maintenance Methods • The Physics of Failures and the Mortality of Machinery • Bearing Life vs. Force Relationship
• Dynamic Load Ratings of Bearings Related to Actual Forces
b. Vibration Measurement and Engineering Limits • Vibration Terms and Units of Measurement • The Machinery Vibration Severity Chart • Bearing Failure Detection
• Determining Vibration Limits
c. Vibration Analysis • Sweep Filter
• Vibration Analysis using Overall Readings • The Time and Frequency Domain
• Vibration Spectrums • FFT
• Sources of Vibration Frequencies
• Calculating Potential Machine Train Frequencies • Envelopes and Bands
• The Troubleshooting Process
d. Correcting Machine Imbalance • Causes of Machine Imbalance • Units of Imbalance
• Simple ”No Phase” Balancing Method
Our paper is intending to focus on predictive analysis. In this idea we want to monitor the vibrations in different parts of a excavator.
into a number of equal classes. The number of classes is chosen so that the character of the classified criterion of the process is more clearly identified.
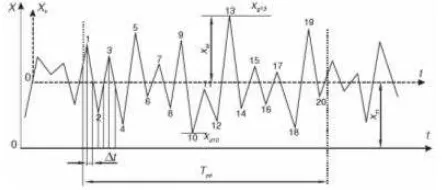
For discretization and defining of the torque values, the digital procedure is used, which comprises determination the accidental functionX =f(t) value in equal time intervals ∆t. Discretization step can be determined from the relation:
∆t = 1/(4.6)·fmax (1)
[image:5.612.185.406.243.338.2]where fmax- maximal frequency of process oscillation.
Figure 2: Records of accidental discretization
As figure 2 proves, many sets of data have to be recorded and processed. The ODYSSEYT M
Spatial Position Measurement Technology (Leonhard E. Bernold, Gordon K. Lee) proposed a complex data monitoring system for radioactive waste.
3. Bucket - wheel excavator proposed measurement parameters
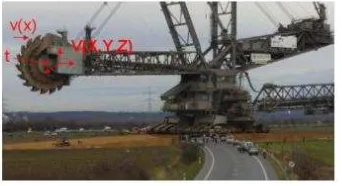
Martin GOERRES (2000) established for the bucket- wheel excavator, the main stability and control sets of parameters. From the proposed list we have decided to evaluate some important parameters. For this paper approach we decided to control (figure 3):
- the three-axes vibration from the main bucket- wheel head -V(X, Y, Z); - cutting system vibration - v(x);
- axes temperature - t;
Figure 3: Parameters measured position
driving power of bucket wheel 500 kW, cutting height 26m, excavation depth 5 m, number of buckets 14, 5 voltage levels, 12 automation systems.
On the other hand, the electrical parameters related to the bucket- wheel head are also extremely important (Dragan Milˇci´c, Slobodan Miladinovi´c). The excavator production and efficiency are analyzed in accordance with this second set of parameters. For this reason, we proposed to measure around five electrical motors:
- 5 current levels - i1−i5; - 5 voltage levels - u1−u5;; - 5 thermal regime - t1−t5;.
3. Measuring set-up for proposed sets of parameters
In this section we will describe de proposed measuring system method. The entire measuring system is based on a wireless network (WN) setup. The WN is working as measuring node based on Zigbee technology (WNN).
ZigBee is a PAN technology based on the IEEE 802.15.4 standard. Unlike Bluetooth or wireless USB devices, ZigBee devices have the ability to form a mesh network between nodes. This technique allows the short range of an individual node to be expanded and multiplied, covering a much larger area. One ZigBee network can contain more than 65,000 nodes (active devices). The network they form in cooperation with each other may take the shape of a star, a branching tree or a net (mesh). That means that each node uses little power. The ZigBee Alliance is not pushing a technology; rather it is providing a standardized base set of solutions for sensor and control systems.
the analog circuitry to be very simple and very tolerant towards inexpensive implementations.
- The media access control (MAC) layer was designed to allow multiple topologies without complexity. The power management operation doesn’t re-quire multiple modes of operation. The MAC allows a reduced functionality device (RFD) that needn’t have flash nor large amounts of ROM or RAM. The MAC was designed to handle large numbers of devices without requiring them to be “parked”.
[image:7.612.127.470.260.502.2]- The network layer has been designed to allow the network to spatially grow without requiring high power transmitters. The network layer also can handle large amounts of nodes with relatively low latencies.
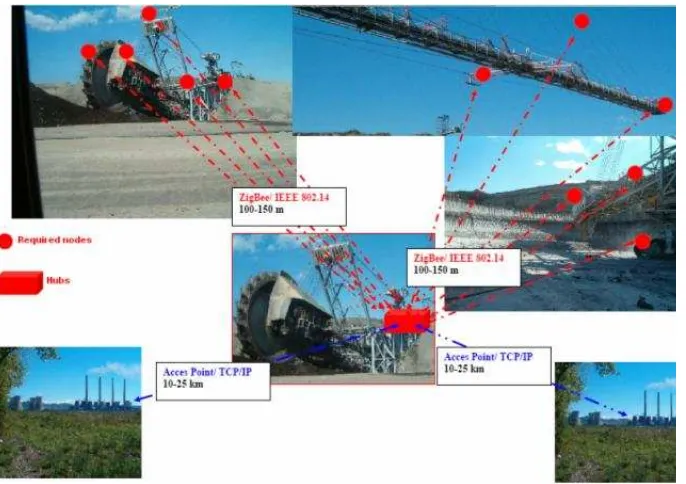
Figure 4: Typical integration of the Zigbee measuring setup into an commu-nication system
Some typical ZigBee/IEEE 802.15.4 general characteristics: • Dual PHY (2.4GHz and 868/915 MHz);
• Data rates of 250 kbps (@2.4 GHz), 40 kbps (@ 915 MHz), and 20 kbps (@868 MHz);
• Optimized for low duty-cycle applications (¡0.1%);
• CSMA-CA channel access, yields high throughput and low latency for low duty cycle devices like sensors and controls;
• Low power (battery life multi-month to years); • Multiple topologies: star, peer-to-peer, mesh;
• Addressing space of up to: 18,450,000,000,000,000,000 devices (64 bit IEEE address); 65,535 networks;
• Optional guaranteed time slot for applications requiring low latency; • Fully hand-shaked protocol for transfer reliability;
• Range: 100m typical (5-500m based on environment).
Because of dispatching facilities demands, we propose to integrate Zigbee network into general company intranet. For this issue, we use:
- Zigbee components (full function devices, Zigbee coordinators, Zigbee routers)- all with own power;
- Intranet hub with power supply from existent excavator power, with TCP/IP protocol;
- Internet Access Point (2.4 GHz) with power supply from existent exca-vator power and TCP/IP protocol.
They are many Zigbee developers, and for our purpose we have used a National Instrument brand.
The list of the used devices is:
- Measurement Modules: (AI – voltage measurement +/-10V, current(4-20mA), DIO digital TTL lines, CNT 32-bit counter, WN-RLY relay);
- Coordinator Modules (WN-Ethernet, WN-USB);
From the software point of view we have used two variants. The reason for using this is related to licensing and the demand for web-based developments.
First way of software development is based of: - LabVIEW 8.0 or 8.20 FDS;
- WN LabVIEW Driver.
The WN LabVIEW driver is installed inC :\W N E\Driver\LV800. The LabVIEW driver contains the following classes of VIs: Connect/Disconnect wireless connection between the PC and the WN measurement node. Any Lab-VIEW application that sends commands to a WN measurement node starts with a call to WN Connect.vi and ends with a call to WN Disconnect.vi;-functions that control measurement nodes. These Disconnect.vi;-functions are specific to the different measurement nodes, and therefore should be used accordingly (WN AIRead.vi, WN CurrentRead.vi, WN DIOReadPort.vi, WN DIOWrite Port.vi, WN DIOConfigure.vi, WN DIOReadLine.vi, WN DIOWriteLine.vi, WN CNTStart, WN CNTRead, WN CNTStop, WN RLYSe), functions that add and configure new measurement nodes (WN AddNode, WN DeleteAllNodes, WN DeleteNode, WN LoadConfiguration, WN SaveConfiguration).
The second approach is based of using only LabVIEW drivers into own pro-gramming development through a client- server application based of MySQL database. The main reason of using this software controlling approach based of the clients diversity.
The main advantages of web-based network measurements consist of in-formation scalability, server side generation of outputs, running the model outputs from external application elements and device.
On the other hand, many industrial applications have rich experience in building Security Constrain Unit Commitments- SCUC (Electrical Indepen-dent System Operation, Refinery and Petroleum Industry, Water Manage-ment, Waste Recycling and Services ManageManage-ment, Data Login, Analysis and Monitoring).
5. Client-server application for Zigbee networks
possibility of calling/running Java classes and functions without Java Virtual Machine running on the client side application, we have decided to use it as a powerful tool for a required HMI.
In between of the hSCRIP Ti tag:
hscripttype=′′text/ecmascript′′i h![CDAT A[. . .]]i h/scripti
of the SVG file we place the function scripts which are called by the standard events (onmousemove, onload) or built event by the user (onrepeat).
This example is used for building a user interaction with the SVG object when a mousemove event is occurred. After the function is executed, the function results are used by the SVG for displaying the results (move rectangle with the id=”r” along (x, y) with the decrement of fixed display units).
[image:10.612.186.407.309.489.2]By the same way, other objects as Java functions are built (statistical, Fourier Transformer, connection to the server, database connecting, data file reading).
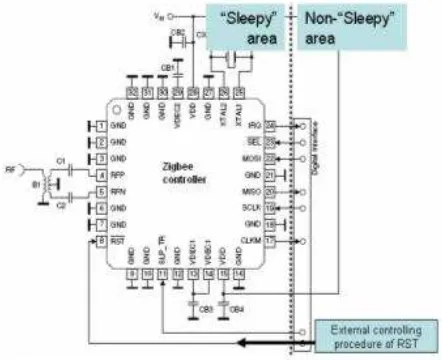
Figure 5: External control of the sleep mode
Because of the Zigbee requirements for power saving, in our approach we need external control of sleep function (Patrick Kinney - 2004, Thierry Gayraud - 2006). This decision is against energy saving for ZIGBEE devices because we need external control over de RESET terminal of the controller (figure 5). Usually, the electrical parameters of a device are:
• TRX OFF = 1.7 mA • RX ON = 16 mA
• BUSY TX = 17 mA (max. PTX)
In this web-based model, as a discrete event approach, two different kind of “clocks” could be used. First method of establishing the timing is by using the system tack. This is not user controlled and facilitates the client-server operations, and for real-time statistics. The main routine for establishing these is:
<scripttype=′′text/ecmascript′′><![CDAT A[
/**
*Updates the clock’s hands. */
function updateTime(){ //get the current time
var now=new Date(); var s=now.getSeconds(); var ms=now.getMilliseconds(); ms+=s*1000;
var min=now.getMinutes(); s+=min*60;
var h=now.getHours(); min+=h*60;
. . . .
window.setTimeout(”updateTime()”,100); }
]]></script>
The shown script consists of defining a public general function update-Time() which call the system Date() for extracting the time (hours, minutes, seconds, milliseconds). Then these Date() components are used for different model operations. updateTime (seconds) which will control for instance the reading of a text file each second.
<?xmlversion=′′1.0′′?>
<!DOCT Y P EsvgP U BLIC′′−//W3C//DT DSV G1.0//EN′′
′′http://www.w3.org/T R/2001/REC−SV G−20010904/DT D/
svg10.dtd′′>
<svgwidth=′′1200′′height=′′ 800′′viewBox=′′0−17014001300′′>
...
<recty =′′ −400′′width=′′ 10′′height=′′ 10′′f ill =′′red′′><animate
attributeN ame=′′x′′values=′′0; 1′′dur =′′0.2s′′repeatCount=′′ indef inite′′
onrepeat=′′advance(evt)′′/></rect>
<script><![CDAT A[ ...
function advance(evt)
{if ( window.svgDocument == null )
svgDocument = evt.target.ownerDocument;
var text = svgDocument.getElementById(”text”).firstChild; ...
N5.removeChild(N5.getChildNodes().item(0)); ...
d=(Math.random()*100+50)* num1/10; ...
svgItem = svgDocument.createElement(”rect”); svgItem.setAttribute(”id”, ”a1” + count); ...
svgDocument.getElementById(”world2”).appendChild(svgItem2); }
]]></script>
The script shows the interaction between the SVG file and DATA object. An user object is animated with a user value (animation duration is 0.2s in our approach because of sample constrains in vibration measurement session) and when the animation is repeated, a Java function is called (advance(evt)). The function advance(evt) is used to process some user operations inside of the DATA object of SVG:
• running a random standard function and returning the value after some operations are executed;
• creating a new SVG item (rectangle); • setting up one of its attribute;
• appending this child element to the SVG parent.
6. Conclusion
It will be a powerful instrument which has to be used by the consumer, offering him the facility of: facilitating engineering level model integration into force simulated environments with component repository building blocks; de-veloping tools and interfaces to rapidly configure models into distributed feder-ation from mobile devices; defining meta-model with data structures needed to maintain semantic consistency between models; exposing interfaces in legacy simulation systems to fully leverage their capabilities; remote controlling deci-sion making system.
References
[1] Dragan Milˇci´c, Slobodan Miladinovi´c, Calculation of the structural ele-ments of the bucket wheel excavator working wheel transmission, UDC 621.879. 48:62-233.3
[2] Dale S. Boucher, Jim Richard, Report on the construction and testing of a bucket wheel excavator, P3N 1L1
[3] Mircea Risteiu, Herbert ten Thij, Web- based Object Oriented Modeling, Athene 2005, Greek Central Library
[4] Guofu Ding Zhongyan Qian Shuangxia Pan, Active Vibration Control of Excavator Working Equipment with ADAMS, 2000 International ADAMS User Conference
[6] The WN family of Wireless Nodes, User Manual - Version 1.5
[7] Tom Savu, Ret¸ele Wireless de tip ZigBee pentru m˘asur˘ari ¸si automa-tiz˘ari
[8] Thierry Gayraud (2006), Architectures Architectures et protocoles de communication pour les r´eseaux de capteurs, Journ´ee Mod´elisation & Simu-lation des Micro Syst`emes de Puissance et de D´etection Club des Affili´es du LAAS, 15 Mars 2006
[9] M. Engjom, AN032 SRD regulations for license-free transceiver opera-tion in the 2.4 GHz band
[10]ZigBee Application Development API, Jenic Reference Manual JN-RM-2014
[11] Philip Levis, Nelson Lee, TOSSIM: A Simulator for TinyOS Networks
[12] Chris Otto & Emil Jovanov, An Implementation of the WBAN Health Monitoring Protocol for ZigBee Compliant TinyOS Messaging, May 2006
[13] Leonhard E. Bernold, Gordon K. Lee (1996)Design-integrated-excavation, 1996, Department of Civil Engineering Mechanical & Aerospace Engineering
[14] Patrick Kinney (2004),ZigBee Technology: Wireless Control that Sim-ply Works, IEEE 802.15.4 Task Group.
Authors: Mircea Ri¸steiu
”1 Decembrie 1918” University of Alba Iulia N. Iorga, no.11-13, Alba Iulia, 510009, Romania email: [email protected]
Ioan Ilean˘a
”1 Decembrie 1918” University of Alba Iulia N. Iorga, no.11-13, Alba Iulia, 510009, Romania email: [email protected]
Simona Duma
Engineering Department