Environmental effects on the quality of two wheat
genotypes: 1. quantitative and qualitative variation of
storage proteins
E. Triboi
a,*, A. Abad
b, A. Michelena
b, J. Lloveras
b, J.L. Ollier
a, C. Daniel
aaStation d’Agronomie INRA,12A
6enue du Bre´zet,63039Clermont-Ferrand,France
bUni
6ersitat de Lleida-IRTA,Alcalde Ro6ira Roure177,25198Lleida,Spain
Received 8 June 1999; received in revised form 19 January 2000; accepted 14 April 2000
Abstract
A new method of sequential extraction of proteins followed by quantitative and qualitative determination by reverse-phased high-performance liquid chromatography (RP-HPLC) was used to analyse the effect of environmental conditions (3N fertilisation rates, two varieties, two sites and two growing seasons) on quantitative and qualitative variation of wheat storage proteins. The results showed thatNsupply (fertilisation and site) was the most important environmental factor affecting protein content and composition. The most important effect was quantitative: the total protein, protein unit and subunit contents increased with the supply of nitrogen to the grain. As grain protein increased, the gliadin and glutenin contents and the gliadin to glutenin ratio increased. Gliadin showed a higher correlation with total protein content than glutenin. In the variety Rinconada, glutenin content was higher than that in Bancal. As total glutenin increased, both high and low-molecular weight (HMW and LMW) fractions increased and their ratio (HMW/LMW) did not change significantly, despite a slope of LMW subunits two times greater (0.69) than that of HMW fractions (0.31). The quantity of each HMW subunit (RP-HPLC peak) increased with total HMW-glutenin, but their relative percentage increased for some peaks and decreased for others. The composition of the HMW subunit was more stable in Bancal than in Rinconada. This general pattern of variation was also characteristic of the LMW subunit. Concerning gliadin composition we noted that the content of different gliadin monomers (RP-HPLC peaks) or pools of monomers (a-, b-,g-,v-gliadin) increased with total gliadin content. The proportion of certain peaks was stable whereas the contribution of other peaks was related to the variation in gliadin content and depended on the variety. © 2000 Elsevier Science B.V. All rights reserved.
Keywords:Environment; Protein composition; Gliadin composition; Glutenin composition
www.elsevier.com/locate/eja
Abbre6iations:HMW-GS, high molecular weight glutenins; LMW-GS, low molecular weight glutenins; PC, protein content (%);
QNG, quantity of N per grain (mg N grain−1).
* Corresponding author. Tel.: +33-473-624424; fax: +33-473-624457. E-mail address:[email protected] (E. Triboi).
E.Triboi et al./Europ.J.Agronomy13 (2000) 47 – 64 48
1. Introduction
Wheat protein content and baking quality, highly depend on genotypic and environmental factors and it is recognised that variation in protein content and composition significantly modify wheat quality. (Rousset et al., 1985; Bietz, 1988; Borghi et al., 1995).
Many studies have been conducted in an at-tempt to explain wheat quality variation as a function of genetic variation in protein composi-tion. The major storage proteins in wheat are the gliadins and glutenins. Gliadins are subdivided into a, b, g and v units and glutenins into low and high molecular weight (LMW-GS and HMW-GS). The genetic control and the relation-ships between gluten protein composition and quality characteristics are better and better under-stood (Shewry et al., 1989; Colot, 1990; Halford et al., 1992; Gupta and MacRitchie, 1994; Popineau et al., 1994; Weegels et al., 1996; Fido et al., 1997; Martinant et al., 1998; Metakovsky and Branlard, 1998).
With regard to environmental effects several previous studies reported, at different levels of investigation, some variations in protein composition:
the amino-acids composition (g aa/100 g proteins) varies with the N content of the grain (Mosse et al., 1985; Triboi et al., 1990; Bulman et al., 1994; Boila et al., 1995);
the quantity of N and S in the grain increases with N content, but the N/S ratio decreases: this reflects a change in the ratio between protein with lower sulphur content such as certain gliadins and higher sulphur proteins such as glutenins (Byers and Bolton, 1979; Triboi et al., 1990; MacRitchie and Gupta, 1993);
the gliadin/glutenin ratio increases with the quantity of N in the grain (Terce-Laforque and Pernollet, 1982; Triboi et al., 1990; Triboi and Leblevenec, 1995);
the concentration of some gliadin bands, mea-sured by electrophoresis and densitometry, changes with the variation in N supply to the grain (Brandlard and Triboı¨, 1983).
Progress in analytical technology and particu-larly in RP- and SE-HPLC has enabled a better understanding of the effects of protein composi-tion (Marchylo et al., 1989; Lookhart, 1997). As electrophoresis, HPLC not only separates differ-ent gliadin and glutenin subunits but also quantifies individual or pooled subunits. How-ever, this technique has been used in few studies and quantitative determination of protein units and subunits and their relationships with quality have seldom been described (Marchylo et al., 1989; Seilmeier et al., 1990; Sutton et al., 1990; Kolster et al., 1991; Sutton, 1991; Wiesser et al., 1994). Subsequently, the quantitative changes can be accompanied by qualitative changes reflected in the ratios between different components (Triboi and Triboı¨-Blondel, 1998; Daniel et al., 1998a,b). Changes in the ratios between different protein units and subunits have rarely been signalled, and the effects on the technological properties have often not been established.
Generally, two aspects can be considered in the research on environmental effects:
1. the change in grain composition and particu-larly in the quantity and quality of proteins; 2. the relationship between protein changes and
quality parameters.
This paper deals with the first aspect: the effect of environmental conditions (N fertilisation rate, site and growing season) on the quantitative and qualitative variation of wheat glutenin and gliadin units and subunits. A new method of sequential extraction of proteins followed by quantitative determination by RP-HPLC was performed in order to analyse the qualitative changes induced by quantitative variations and to establish the relationships between different protein units and subunits for modelling purposes.
2. Materials and methods
2.1. Field experiments
(1994 – 1995 and 1995 – 1996). The soil at Bell.lloc was a deep silty-clay-loam with a high N content and 2.9% organic matter. The soil at Torregrossa was a sandy-loam with a low N content and 1.9% organic matter. Surface irrigation was applied from stem extension (stage 31 Zadoks) until the formation of kernels (Zadoks 70), three times during the growing season with an approximate total of 2000 m3/h. Rinconada and Bancal are
alternative types of wheat without need for ver-nalisation. The HMW-GS composition is 1, 7+8, 5+10 for Rinconada and 7+9, 5+10 for Bancal.
The experimental design was a split-plot ran-domised complete-block with four replicates. The main plots consisted of wheat cultivars, while the subplots were subjected to three N fertilisation treatments, 0, 100 and 200 kg/ha. Only two field replicates were used in this study, hence 48 sam-ples (two replicates, three N, two varieties, two sites, two years) were analysed for protein composition.
2.2. Sequential extraction of protein
The sequential extraction of protein of whole grain flour was used (Marion et al., 1994; Nicolas et al., 1997). Albumin-globulin was extracted from 833 mg of ground wheat with 25 ml buffer A (0.05 M sodium phosphate pH 7.8, 0.05 M NaCl) for 1 h at 4°C. Samples were centrifuged at 18 000 rpm for 20 min at 4°C. Amphyphilic proteins were extracted from the previous residue with 25 ml of 2% (w/v) Triton X-114 in buffer A, for 1 h at 4°C. After centrifugation (18 000 rpm for 20 min at 4°C), gliadin was extracted from the residue with 25 ml of 70% (v/v) aqueous ethanol for 1 h at 20°C. To obtain glutenin, after centrifu-gation the residue was extracted overnight with 25 ml of buffer B (0.05 M di-sodium tetraborate pH 8.5, 2% (v/v) b-mercaptoethanol, 8 M urea and 1 g/l glicyne) at 20°C. Samples were centrifuged at 18 000 rpm for 20 min. An amount of 3.5 ml of the supernatant was alkylated with 4-vinylpyridine. After alkylation, 3.5 ml of 2-propanol was used to precipitate polysaccharides. Samples were centrifuged at 18 000 rpm for 20 min. Glutenin was in the supernatant.
2.3. RP-HPLC of gliadin and glutenin
The gliadin and glutenin composition of the supernatants was analysed by RP-HPLC Kontron 422/425 system, with a Nucleosil C18 column (300 A, , 5 mm, 30 nm, 250×4.6 mm) at 50°C with a C18 gard column (300 A, , 410 mm).
Two eluants were used: (A) water containing 60% (v/v) acetonitrile and 0.07% (v/v) trifl-uoroacetic acid (TFA); (B) water containing 0.1% (v/v) TFA.
For the gliadin analysis the gradient was: 0 – 1.22 min — 41.7% (A), 8 min — 46.2% (A), 65 min — 83.0% (A), 69 min — 100% (A). The glutenin gradient was: 0 – 6 min — 41.7% (A); 46 min — 66.7% (A); 66 min — 91.7% (A); 67 min — 100% (A). For both analyses, the flow rate was 1.0 ml/min and the injection volume was 75 ml. Detection was at 220 nm with Shimadzu SPD6A. Each class of glutenin was quantified by inte-gration of chromatogram areas, between 29 and 36% of acetonitrile for HMW-GS and between 36 and 51% for LMW-GS. Kontron data system 450-MT2 software was used to integrate the chro-matograms, which were standardised and whose peaks were numbered as shown in Figs. 1 and 2. For each subunit and peak, protein content was expressed as the amount (area, mV/min) per mg of flour or as a proportion (%) of the total gliadin and glutenin unit and subunit area. Total glutenin and gliadin were calculated as the total chro-matogram area (mV/min) per mg of flour.
3. Results
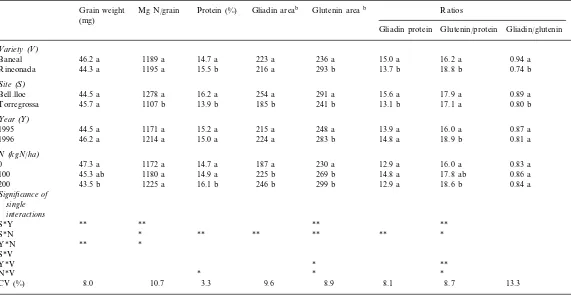
3.1. Grain weight (GW), protein content (% PC) and quantity per grain (QNG)
GW have a coefficient of variation (CV) of 8% (Table 1). N fertilisation (N) was the main factor of variation. An increase in N fertilisation rate significantly reduced grain weight from 47.3 mg/
E
Environmental effect on grain weight, total and storage protein contenta
Grain weight Mg N/grain Protein (%) Gliadin areab Glutenin areab Ratios
(mg)
Gliadin protein Glutenin/protein Gliadin/glutenin
Variety(V)
Bell.lloc 16.2 a 254 a
185 b 241 b 13.1 b 17.1 a 0.80 b
aMeans in the same column followed by the same letter are not significantly different arePB0.05.
* Significant atPB0.05. ** Significant at 0.01.
Variation in the quantity of N per grain (QNG, mg N/grain) was higher than that of grain weight (CV, 10.7%). The QNG depended significantly on the site, with an average of 1278 mg/grain at Bell.lloc and 1107mg at Torregrossa, confirming a
higher soil N supply at Bell.lloc. However, there was a significant interaction between site and N fertilisation, possibly resulting from the higher soil N content at Bell.lloc that reduced the re-sponse of N grain content to N fertilisation.
E.Triboi et al./Europ.J.Agronomy13 (2000) 47 – 64 52
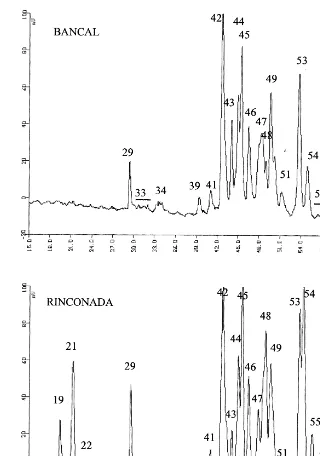
Fig. 2. RP-HPLC of Bancal and Rinconada gliadin. Numbers in chromatogram are peak designation.
spite the fact that the most important factors of variation were different for the two variables (site for QNG and nitrogen for GW), they were not totally independent because the coefficient of vari-ation of their ratio, i.e. protein content (PC%), was smaller (only 3.3%) (Table 1). PC was mainly affected by site and N fertilisation (63% of total
very high in the absence of N fertilisation, i.e. 16.4%.
3.2. Gliadin and glutenin content in the flour and in total protein
Gliadin content in the flour was affected only by site (+37% at Bell.lloc) and by N fertilisation
(+32% at 200 N) but not by variety and year (Table 1). These two factors explained 52% of the total variance. Moreover, a significant interaction between site and N fertilisation was observed. At Torregrossa, gliadin content increased by about 80% as a consequence of N fertilisation whereas at Bell.lloc the increase was of about 20%.
In contrast, glutenin content was significantly affected not only by site (+21% at Bell.lloc) and N fertilisation (+30% at 200 N) but also by year (+14% in 1996) and variety (+24% in Rinconada). Several significant interactions be-tween factors were obtained (Table 1). At Torre-grossa, glutenin content was higher in 1995 – 1996 than in 1994 – 1995, whereas no differences were observed at Bell.lloc between glutenin content in the two growing seasons (S*Y interaction). In Rinconada, wheat glutenin content was higher in 1994 – 1995 than in 1995 – 1996, whereas no differ-ences were observed at Bancal. (Y*V interaction). Despite the large variation in gliadin and glutenin contents in flour, their ratio was rela-tively constant. The variety was the main factor of variation: the mean of this ratio was 0.94 for Bancal and 0.74 for Rinconada. This is in agree-ment with several studies (Kolster et al., 1991; Pechanek et al., 1997). However there are also a site effect (Bell.loc 0.89, Torregrossa 0.80) but smaller that variety.
Concerning protein composition, variety and N fertilisation were the main factors affecting both the gliadin to total protein and glutenin to total protein ratios. The year, alone or in interaction with site or variety, was significant only for the glutenin content in total protein. Thus, glutenin seems to be more environmentally dependent than gliadin.
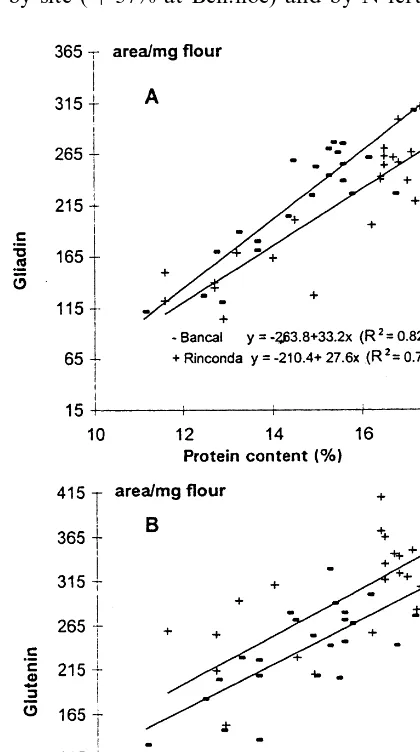
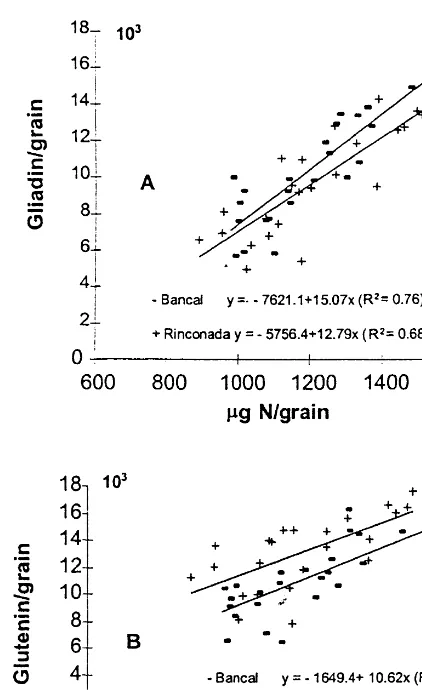
All the modifications in gliadin and glutenin contents of flour were related to total protein content. The coefficients of determination were higher for gliadin than for glutenin (Fig. 3). This is in agreement with previous studies (Gupta et al., 1992), although other authors (Andrews et al., 1994) reported a better correlation with glutenin. To take into consideration only nitrogen accu-mulation and to eliminate the effect of C accumu-lation on N percentage, we calculated the quantity of gliadin, glutenin and total protein per grain. Fig. 3. Amount of gliadin (A) and glutenins in flour (B) as a
E.Triboi et al./Europ.J.Agronomy13 (2000) 47 – 64 54
Fig. 4. Amount of gliadins (A) and glutenins in flour (B) as a function of grain N content (mg N/grain) in two bread wheat varieties (Bancal and Rinconada). Data consist of means of two sites (Torregrossa and Bell.lloc), 2 years (1994 – 1995 and 1995 – 1996) and three N fertilisation rates (0, 100 and 200 kg N/ha). Units of area are mV/min. The number of observations was 24 for each regression.
protein content, the percentage of glutenin did not. In the present study, both the proportion of gliadin and glutenin in total protein increased with increasing total protein content (R2, 0.64 and R2, 0.40 PB0.01 respectively, data not shown).
The increase in the proportion of gliadin and glutenin was probably related to the decrease in the non-storage protein fraction as shown by Gupta et al., (1992), Jia et al., (1996b). Finally, the gliadin to glutenin ratio, reflecting a qualita-tive change in protein composition, increased with N content per grain (Fig. 5), suggesting that as N accumulation increased, gliadin increased prefer-entially to glutenin.
3.3. Analysis of glutenin composition
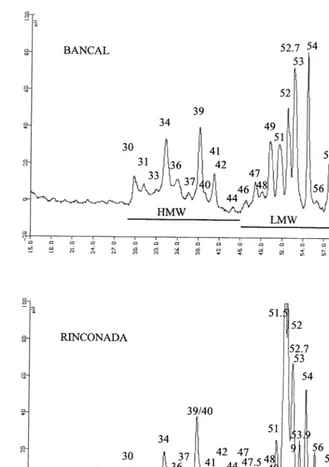
Chromatograms of glutenin in Bancal (A) and Rinconada (B) are presented in Fig. 1. The peak areas that were used to determine HMW- and LMW-GS are indicated as well as the name given for every peak. HMW- and LMW-GS content and the HMW/LMW-GS ratio are presented in Table 2.
Fig. 5. The gliadin/glutenin ratio as a function of grain N content (mg N/grain) in two bread wheat varieties (Bancal and Rinconada). Data consist of means of two sites (Torregrossa and Bell.lloc), 2 years (1994 – 1995 and 1995 – 1996) and three N fertilisation rates (0, 100 and 200 Kg N/ha). The number of observations was 24 for each regression.
The N content of grain (as well as protein con-tent) also showed a significant linear relationship with the gliadin and glutenin contents, however gliadin was better correlated with the N content of grain than glutenin (Fig. 4).
Table 2
Environmental effect on glutenin subunit contenta
LMWb HMW/LMW HMW/protein LMW/protein
Significance of single interactions
**
aMeans in the same column followed by the same letter are not significantly different arePB0.05. CV, coefficient of variation. bArea (mV
min/mg flour) of high (HMW) and low (LMW) molecular weight glutenin.
* Significant atPB0.05. ** Significant at 0.01.
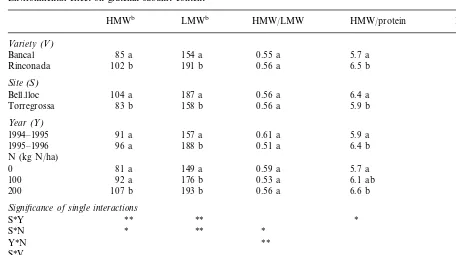
Like glutenin content, the HMW and LMW glutenin content in flour was significantly affected by variety, site and N fertilisation. The year and its interaction with variety (Y*V) only had an effect on LMW-GS. At Bell.lloc, where the soil had a high N content, N fertilisation increased the quantity of the different subunits by about 12%, whereas at Torregrossa the increase of each sub-unit as a result of N fertilisation was important: 40 and 70% for HMW and LMW-GS respectively (S*N interaction, data not shown).
The composition of total proteins was also modified. The HMW-GS to total protein ratio, and the LMW-GS to total protein ratio changed significantly with N fertilisation, site, year and variety (Table 2). Some single interactions, partic-ularly with N fertilisation (N*S, N*Y, N*V) only had a significant effect on LMW-GS content.
The change in protein composition was also reflected in the variation of the HMW- to LMW-GS ratio. The main factor of variation was N fertilisation, alone or in interaction with year, site and variety. Furthermore, the analysis of variance for this ratio showed a different pattern for the two varieties (V*Y, V*N interactions): contrary to Bancal in Rinconada this ratio changed signifi-cantly with growing season and N fertilisation.
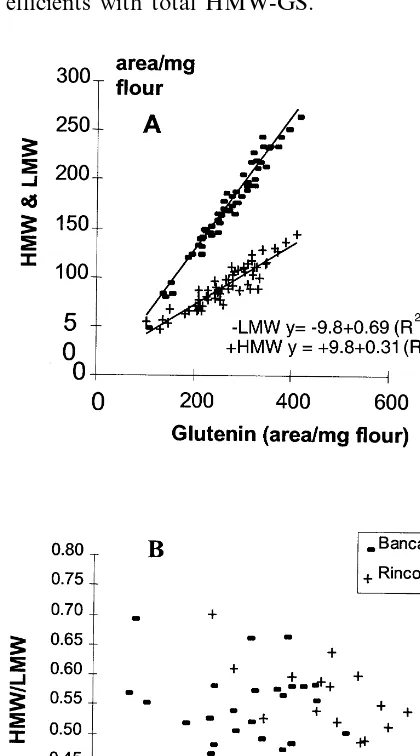
The variation in HMW- and LMW-GS content was related to total glutenin content: HMW- and LMW-GS contents increased with flour glutenin content (Fig. 6A; R2\0.84). The increase in
E.Triboi et al./Europ.J.Agronomy13 (2000) 47 – 64 56
3.3.1. Composition of HMW-GS
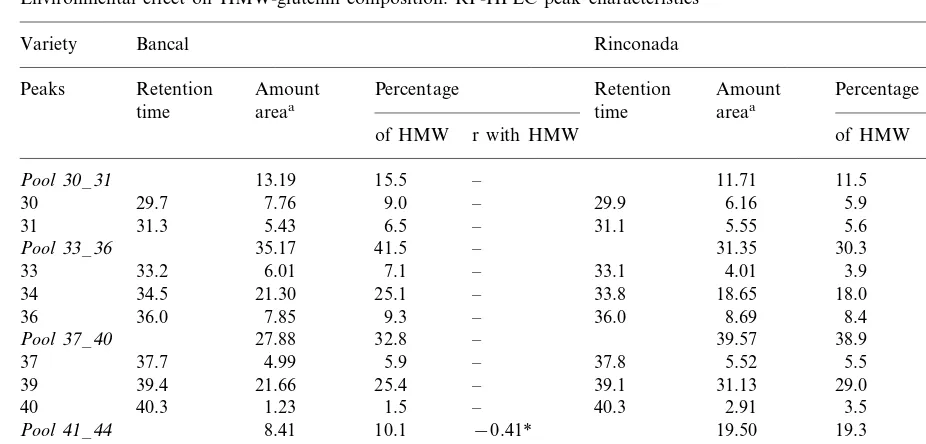
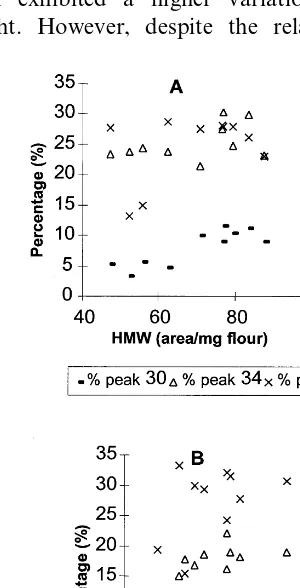
According to retention time by chromatogra-phy column HMW-GS were divided into 11 peaks (Fig. 1). These peaks were grouped into four pools: 30 –31, 33–36, 37–40 and 41–44. Table 3 presents the average amount and percentage of HMW-GS for each peak and the correlation co-efficients with total HMW-GS.
The data shown a genetic effect on HMW-GS composition. Although there were 11 peaks in the two varieties and the name given for each peak was the same, there were slight differences in the retention time of certain peaks (34, 39, 42). For example the retention times for Bancal and Rinconada were 34.5 and 33.8 min for peak 34, 39.4 and 39.1 for peak 39 and 42.3 and 42.9 for peak 42, respectively. In both varieties, peaks 34 and 39 were the peaks with the highest of HMW-GS content. In Bancal, each of these peaks repre-sented about 25% of total HMW glutenin and in Rinconada, peak 34 represented 18% and peak 39 represented 29% of total HMW glutenin.
Generally, in the two varieties the amount of individual HMW peaks increased significantly as HMW-GS increased (r\0.43). The three major peaks (30, 34 and 39) were those with the highest correlation with the total HMW-glutenin area (r\0.77). The analysis of the percentage of each peak for total HMW glutenin, revealed a different trend in the two varieties. Although in both vari-eties the total amount of individual peaks in-creased as HMW-GS inin-creased, the proportion of every peak with regard to total HMW-GS was different: only the proportion of one pool (41 –44) varied in Bancal wheat, whereas four varied in Rinconada. In the latter variety, the proportion of the three major peaks increased with HMW-GS content, and peak 40 was significantly lower. However, despite their statistical significance, the correlation coefficients of these relations were very small (r0.45; Fig. 7).
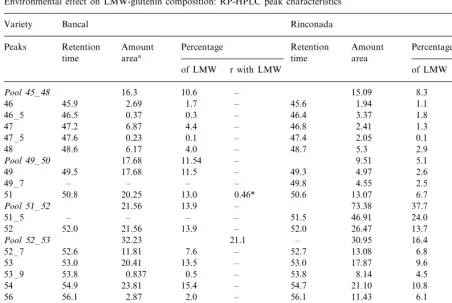
3.3.2. LMW composition
LMW-GS were divided into 15 peaks in Bancal and into 17 peaks in Rinconada (Fig. 2). Some of these peaks were pooled and some were consid-ered as individual peaks. Table 4 presents the retention times for different LMW-GS peaks, the average amount and percentage of each peak, and the correlation coefficients with total LMW-GS.
Some LMW-GS peaks were specific to the vari-ety: peaks 49 –7, 51–5 and 59 were present only in Rinconada and peak 58 only in Bancal. In Bancal there were five peaks (49, 51, 52, 53 and 54) and in Rinconada there were three peaks (51 –5, 52 Fig. 6. HMW and LMW-GS (A) and the HMW-/LMW-GS
Table 3
Environmental effect on HMW-glutenin composition: RP-HPLC peak characteristics
Bancal
Variety Rinconada
Amount
Peaks Retention Percentage Retention Amount Percentage
time
39 39.4 31.13 29.0 0.45*
1.23 1.5 – 40.3
* Statistical significant atPB0.05.
and 54) each of which represented more than 10% of total LMW glutenin.
Generally, in the two wheat varieties, the amount of individual LMW-GS peaks increased significantly as LMW-GS increased (r with LMW\0.54). Although the total amount of indi-vidual peaks increased as LMW-GS increased, the percentage of peaks were more constant in Bancal than in Rinconada. In the Bancal variety, only the percentage of peaks 51 and 58 –5 increased signifi-cantly with LMW-GS, whereas in Rinconada the percentage of several peaks changed (Fig. 8); pools 45 –48 and 49–50, peaks 53–9 and 56 de-creased significantly as LMW-GS inde-creased and peaks 51, pool 51 –52 and peak 54 significantly increased (Table 4). These results suggest that the synthesis of certain LMW protein fractions in wheat cultivars also depends on the environment.
3.4. Analysis of gliadins
Gliadin fractions were divided into 23 peaks in Bancal and into 25 peaks in Rinconada (Fig. 2). Some of these peaks were grouped into different pools and some were considered as individual
peaks. Table 5 indicates the most important char-acteristics of the different peaks: retention time, amount of gliadin, percentage of gliadin and cor-relation with the total amount of gliadin.
Peaks 19, 21, 22, 37 and 55 were present in Rinconada and not in Bancal and peaks 33, 58, 58.5, 59 and 59 were present only in Bancal but in small quantity (Table 5).
There were six peaks each of which represented more than 7% of total gliadin subunits: 42, 45, 47, 49, 53, 62 in Bancal and 42, 45, 48, 49, 53 and 54 in Rinconada. Other individual peaks represented less than 7% of total gliadin.
E.Triboi et al./Europ.J.Agronomy13 (2000) 47 – 64 58
4. Discussion
It is now clearly established that grain quality is a function of grain composition, principally in proteins, which depends on the genotype and the environment. The genetic effect is mainly reflected by qualitative variation such as protein polymor-phism and secondly by quantitative variation of total protein or of different units and subunits. In contrast, the environmental effect (growing sea-son, site, fertilisation,....) was mainly reflected by the quantitative variation, such as in total protein or protein unit and subunit contents.
In our experiment, the quantity of nitrogen per grain exhibited a higher variation than grain weight. However, despite the relative
indepen-dence of these two variables their ratio, the protein content (% PC) in dry matter, essentially reflects the variation in protein amount, and the use of two variables, the content or the amount was nearly equivalent. (Figs. 3 and 4).
It is not surprising that the quantity or the content of two major classes of storage proteins, gliadin and glutenin, is significantly related to total protein, modified essentially by the nitrogen supply (fertilisation and site). The significant ‘facts’ are firstly, the difference between the two classes and secondly, the varietal behaviour.
If the quantity of nitrogen (or protein) per grain increases, the gliadin to glutenin ratio in-creases to a maximum potential (if PT=) equal to the ratio between two regression slopes (Fig. 4). Finally, an increase in the gliadin to glutenin ratio with the nitrogen quantity per grain (Fig. 5) or content (%, data not shown) was obtained. Simi-lar results were also found by several authors, despite different methods of analysis of proteins (Blumenthal et al., 1993; Jia et al., 1996a,b).
In all cases, for the same quantity or protein content, there is a significant varietal effect only on the glutenin fraction: in Rinconada, glutenin is higher than in the Bancal variety (Table 1), prob-ably owing to the difference in allelic composition and expression in the two varieties. This is in agreement with the results of Autran (1990) which showed a increase in the percentage of HMW-GS in total protein with the number of HMW-GS, and Halford et al. (1992) who showed that the presence of subunit 1A×1 (or 1A×2) increased the proportion of HMW-GS by about 2% in comparison with a null allele. However, Rinconada has 5 HMW-GS (1, 7+8, 5+10) and Bancal has 4 HMW-GS (7+9, 5+10). More-over, MacRitchie and Gupta (1993) indicated a similar quantity of HMW-GS produced by the loci of alleles GluB1 and GluD1, such that the quantitative superiority of Rinconada could be partially attributed to the quantitative effect pro-duced by the presence of GluA1. We also noted that the total protein content per grain was not different between the two varieties (Table 1); thus, the increase in glutenin content in Rinconada is not accompanied by an increase in total N quan-tity but more probably by a different allocation of Fig. 7. Variation in the percentage of three LMW-GS peaks as
Table 4
Environmental effect on LMW-glutenin composition: RP-HPLC peak characteristics
Bancal
Variety Rinconada
Retention Amount Percentage
Peaks Retention Amount Percentage
area
20.25 13.0 0.46* 50.6
51 50.8 13.07 6.7 0.56**
54 54.9 21.10 10.8 0.91**
2.87 2.0 – 56.1
* Statistical significant atPB0.05. ** Statistical significant atPB0.01.
N, in favour of glutenins and at the expanse of soluble fractions, albumin, globulin or amphyphiles.
Concerning the variation in glutenin composi-tion, the content of LMW- and HMW-GS was closely related to that of glutenin. The slope of regression between LMW-GS and total glutenin content (Fig. 6; 0.69) was two times greater than that of HMW-GS (0.31). When calculating this regression with the data on varietal effect of Nico-las (1997) we obtained similar values, 0.33 for HMW-GS and 0.67 for LMW-GS. Moreover, in both experiments the constant term of regression was positive for HMW-GS and negative for LMW-GS. This resulted a decrease in both the relative contribution of HMW-GS to total
glutenin content and of the ratio HMW-GS/
E.Triboi et al./Europ.J.Agronomy13 (2000) 47 – 64 60
of HMW-GS in total glutenin whereas an increase in nitrogen supply decreased the proportion of HMW-GS.
Our data also showed a different behaviour of the genotype. The Bancal cultivar has a more stable HMW-GS composition than Rinconada. Indeed, with an increase in HMW protein, the proportion of different peaks did not change in Bancal but did in Rinconada (Table 3). This general pattern of variation also characterises the LMW-GS composition: stability in Bancal and some changes in Rinconada. The cause of this different genetic behaviour is not known.
Concerning the variation in gliadin composi-tion, we noted that as in glutenin, the content of different gliadin pools were closely related to gliadin content.
In our experiment, the proportion of thev -sub-group (TRB39 min) in total gliadins was about 5% (Bancal) and 11% (Rinconada), where the lower value was observed in Bancal, in which the faster gliadins (v5-) were missing. There was a good agreement between these values and those noted by Wiesser et al., (1994). The proportion of
the a+b gliadins (39BTRB53) was 60 – 64%, and that of the l-gliadins 29 – 31%, respectively, for the Rinconada and Bancal varieties. Similar values were obtained by Wiesser et al. (1994) and Pechanek et al., (1997).
As in glutenins, all these gliadin subunits and their constituent peaks were highly correlated with total gliadin content. Their contribution to the total gliadin pool was very variable: the pro-portion of certain peaks was stable whereas the contribution of other peaks was related to the variation in gliadin content (Table 5) (Fig. 9). But, in contrast to glutenin, there are not different behaviour of two varieties in the variation of the proportion of gliadin peaks in the total gliadin.
To understand how the environment can change grain composition and to forecast this change, Triboi and Triboı¨-Blondel (1998) devel-oped a concept to analyse the variation in grain composition: every change is a consequence of the mechanisms of nitrogen allocation between differ-ent types of protein, through the change in rate and duration of synthesis. Thus, the quantity of one compound ‘Q’ is dependent on the rate of synthesis (r) and on the duration of synthesis
Table 5
Environmental effect on gliadin composition: RP-HPLC peak characteristics
Variety Bancal Rinconada
Amount Percentage Retention Percentage
Retention
* Statistical significant atPB0.05. ** Statistical significant atPB0.01.
(D):Q=(r)D+k.
Consequently, to forecast the quantity of one compound ‘Qc’ or the ratio between two com-pounds, it is necessary to estimate three
E.Triboi et al./Europ.J.Agronomy13 (2000) 47 – 64 62
Qci=(rci)Dci
In consequence, if the deposition rate is con-stant, the ratio between the compounds formed at the same time stay constant during grain filling,
equal to the ratio between the two rate of synthe-sis, r1/r2, despite a different synthesis rate and quantity deposited. However, the final ratio de-pends on the date of cessation of synthesis, or on the duration of filling:
rf=r1D1/r2D2
In contrast if the onset time is different, the ratioQ1/Q2changes during filling period. This is a new conceptual approach to analysing grain com-position formation and to comparing the few data on environmental effect.
5. Conclusion
The results presented in this study showed that environment considerably affects protein content and composition.
The most important effect was quantitative. In our study, nitrogen supply was the principal fac-tor of variation. In this case, the protein content of the grain (%) and the quantity of total protein per grain essentially reflected the change in protein quantity per grain, and the two variables were nearly equal in their effects.
Concerning the effect on protein composition, our data confirms the hypothesis put forward by Triboi and Triboı¨-Blondel (1998) who assumed that the quantitative variation in one component can be accompanied by a change in the ratio of its constitutive subcomponents. However, the alloca-tion of nitrogen to different subcomponents and the stability of the proportion of different con-stituents also depends on the genotype.
Finally, these ‘environmental effects’ on protein composition raise some questions about the origin of variation, because environmental factors can induce contrasting effects and about the physio-logical impact on grain growth and end-use. The correlative approach of the relationship between a component such as the quantity of proteins per grain, and their subcomponents — for example the gliadin and glutenin classes — can explain the quantitative variation of one component (quantity of gliadin or glutenin per grain) and also the ratio between two components (gliadin/glutenin). But, if we want to gain an in-depth knowledge of the Fig. 9. Variation in the percentage of four gliadin peaks as a
effects of environment on grain composition this correlative approach may be enhanced by the studies of dynamic accumulation and synthesis of different components of grain, which will allow the functional modelling approach of the varia-tion in quality.
Acknowledgements
The authors wish to thank Lucette Leblevenec for excellent technical assistance and are indebted to K. Lynch for revising the English version of the manuscript, (INRA’s translation unit, Jouy-en-Josas, France).
References
Autran, J.C., 1990. Variabilite´ Genetique et Agronomique de la Composition Quantitative en HMW — Glutenines et en Proteines Agregatives des Ble´s. Proc INRA Coll, 4 Dec, Paris, pp. 3 – 29.
Andrews, J.L., Hay, R.L., Skerritt, J.H., Sutton, K.H., 1994. HPLC and immunoassay-based glutenin subunits analysis: screening for dough properties in wheats grown under different environmental conditions. J. Cereal Sci. 20, 203 – 215.
Bietz, J.A., 1988. Genetic and biochemical studies of nonenzy-matics endosperms proteins. In: Heyne, E.G. (Ed.), Wheat and Wheat Improvement. 2nd ed, Agron Monogr 13. ASA, CSSA, and SSSA, Madison, WI, pp. 215 – 242. Blumenthal, C.S., Barlow, E.W.R., Wrigley, C.W., 1993.
Growth environment and wheat quality: the effect of heat stress on dough properties and gluten proteins: critical review article. J. Cereal Sci. 18, 3 – 21.
Boila, R.J., Stothers, S.C., Campbell, L.D., 1995. The relation-ships between the concentrations of individual amino acids and protein in wheat and barley grain grown at selected locations throughout Manitoba. Can. J. Anim. Sci. 76, 163 – 167.
Borghi, B., Giordani, G., Corbellini, M., et al., 1995. Influence of crop rotation, manure and fertilizers on bread making quality of wheat (Triticum aesti6umL.). Eur. J. Agron. 4,
37 – 45.
Brandlard, G., Triboı¨, E., 1983. Influence du Milieu de Cul-ture Sur les Concentrations Relatives des Bandes des Gliadines Chez le Ble´ Tendre. CR Acad Sciences, Paris, pp. 229 – 232.
Bulman, P., Zarkadas, C.G., Smith, D.L., 1994. Nitrogen fertilizer affects amino acid composition and quality of spring barley grain. Crop Sci. 34, 1341 – 1346.
Byers, M., Bolton, J., 1979. Effects of nitrogen and sulphur fertilizers on the yeld, N and S content and amino-acid composition of the grain of spring wheat. J. Sci. Food Agric. 30, 251 – 263.
Colot, V., 1990. The genes encoding wheat storage proteins: towards a molecular understanding of bread-making qual-ity and its genetic manipulation. Genet. Eng. 12, 225 – 241. Daniel, C., Triboı¨, E., Leblevenec, L., Ollier, J.-L., 1998a. Effects of temperature and nitrogen nutrition on protein composition of winter wheat; effects on gliadin composi-tion. EJA Short Comm. I, 247 – 248.
Daniel, C., Triboı¨, E., Leblevenec, L., Ollier, J.-L., 1998b. Effects of temperature and nitrogen nutrition on protein composition of winter wheat; effects on glutenin composi-tion. EJA Short Comm. I, 249 – 250.
Fido, R.J., Bekes, F., Gras, P.W., Tatham, A.S., 1997. Effects ofa-,b-,g- andv-gliadins on the dough mixing properties of wheat flour. J. Cereal Sci. 26, 271 – 277.
Gupta, R.B., Khan, K., MacRitchie, F., 1992. Biochemical basis of flour properties in bread wheats. I: effects of variation in the quantity and size distribution of polymeric protein. Cereal Chem. 69, 125 – 131.
Gupta, R.B., MacRitchie, F., 1994. Allelic variation at glutenin subunit and gliadin loci, Glu-1, Glu-3 and Gli-1 of common wheats. II: biochemical basis of the allelic effects on dough properties. J. Cereal Sci. 19, 19 – 29.
Halford, N.G., Field, J.M., Blair, H., et al., 1992. Analysis of HMW glutenin subunits encoded by chromosome 1A of bread wheat (Triticum aesti6um L.) indicated quantitative
effects on grain quality. Theor. Appl. Genet. 83, 373 – 378. Jia, Y.-Q., Fabre, J.-L., Aussenac, T., 1996a. Effects of grown-ing location on reponse of protein polymerisation to in-creased nitrogen fertilization for the common wheat cultivar Soisson: relationship with some aspects of the breadmakink quality. Cereal Chem. 73, 526 – 532. Jia, Y.-Q., Masbou, V., Aussenac, T., Fabre, J.L., Debaeke,
P., 1996b. Effects of nitrogen fertilization and maturation conditions on protein aggregates and on the breadmaking quality of Soisson, a commun wheat cultivar. Cereal Chem. 73, 123 – 130.
Kolster, P., Krechting, K.F., Gelder, W.M.J., 1991. Quantita-tive variation of total and individual high molecular glutenin subunits of wheat in relation to variation in environmental condition. J. Sci. Food Agric. 57, 405 – 415. Lookhart, G.L., 1997. New methods helping to solve the
gluten puzzle. Cereal Food World 42, 16 – 19.
MacRitchie, F., Gupta, R.B., 1993. Functionality-composition relationships of wheat flour as a result of variation in sulfur availability. Aust. J. Agric. Res. 44, 1767 – 1774. Marchylo, B.A., Kruger, J.E., Hatcher, D.W., 1989.
Quantita-tive reversed-phase high-performance liquid chromatogra-phy analysis of wheat storage proteins as a potential quality prediction tool. J. Cereal Sci. 9, 113 – 130. Marion, D., Nicolas, Y., Popineau, Y., Branlard, G., Landry,
E.Triboi et al./Europ.J.Agronomy13 (2000) 47 – 64 64
Martinant, J.P., Nicolas, Y., Bouguennec, A., et al., 1998. Relationships between mixograph parameters and indices of wheat grain quality. J. Cereal Sci. 27, 179 – 189. Metakovsky, E.V., Branlard, G., 1998. Genetic diversity of
French common wheat germplasm based on gliadin alleles. Theor. App. Genet. 96, 209 – 218.
Mosse, J., Huet, J.C., Baudet, J., 1985. The amino acid composition of wheat grain as a fonction of nitrogen content. J. Cereal Sci. 3, 115 – 130.
Nicolas, Y., 1997. Les Prolamines de Ble´: Extraction Exhaus-tive et Developpement de Dosage Chromatographyques en Phase Inverse et de Dosage Immunochimiques a` L’aide D’anticorps Anti-peptide. These de Doctorat. UFR de Sciences, Universite´ de Nantes, p. 132.
Nicolas, Y., Larre´, C., Popineau, Y., 1997. A method for isolation of high molecular subunits of wheat glutenin. J. Cereal Sci. 25, 151 – 154.
Pechanek, U., Karger, A., Gro¨ger, S., et al., 1997. Effect of nitrogen fertilization on quantity of flour protein compo-nents, dough properties, and breadmaking quality of wheat. Cereal Chem. 74, 800 – 804.
Popineau, Y., Cornec, M., Lefebvre, J., Marchylo, B., 1994. Influence of High Mr glutenin subunits on glutenin poly-mers and rheological properties of glutens and gluten subfractions of near-isogenic lines of wheat Sicco. J. Cereal Sci. 19, 231 – 241.
Rousset, M., Triboı¨, E., Branlard, G., Godon, B., 1985. Influence du genotype et du milieu sur les tests d’apprecia-tion de la valeur d’utilisad’apprecia-tion du ble´ tendre (Triticum aesti6umem. Thell.) dans les industries de cuisson. 1985.
Agronomie 5, 653 – 663.
Seilmeier, W., Belitz, H.D., Wiesser, H., 1990. Separation of high-molecular weight subunit of glutenin from different wheat varieties and genetic variants of the variety Sicco. Z. Lebensm Forsch. 192, 124 – 129.
Shewry, P.R., Halford, N.G., Tatham, A.S., 1989. The high molecular weight subunits of wheat, barley and rye: genet-ics, molecular biology, chemistry and role in wheat gluten structure and functionality. Oxford Surveys Plant Mol. Cell Biol. 6, 163 – 219.
Sutton, K.H., Hay, R.L., Mouat, C.H., Griffin, W.B., 1990. The influence of environment, milling and blending on assement of the potential breadbaking quality of wheat by RP-HPLC of glutenin subunits. J. Cereal Sci. 12, 145 – 153.
Sutton, K.H., 1991. Qualitative and quantitative variation among high molecular weight subunits of glutenin detected by reversed-phase high-performance liquid chromatogra-phy. J. Cereal Sci. 14, 25 – 34.
Terce-Laforque, T., Pernollet, J.C., 1982. Etude Quantitative et Qualitative de L’accumulation des Gliadines au Cours du Developpement du Cariopse de Ble´. C.R. Acadamy of Science, Paris, pp. 529 – 534.
Triboi, E., Branlard, G., Landry, J., 1990. Environmental and husbandry effects on the content and composition of proteins in wheat: cereal quality II. Aspects Appl. Biol. 25, 149 – 158.
Triboi, E., Leblevenec, L., 1995. Temperature effects on grain growth and protein fraction accumulation in winter wheat. J. Exp. Botany 46, 8.
Triboi, E., Triboı¨-Blondel, A.M., 1998. Concept for the analy-sis of environmental and agronomical effects on grain quality. EJA Short Comm. 1, 251 – 252.
Weegels, P.L., Hamer, R.J., Schofield, J.D., 1996. Critical review: functional properties of wheat glutenin. J. Cereal Sci. 23, 1 – 18.
Wiesser, H., Seilmeier, W., Belitz, H.D., 1994. Quantitative determination of gliadin subgroups from different wheat cultivars. J. Cereal Sci. 19, 149 – 155.