www.elsevier.com / locate / livprodsci
Effect of amount of undegradable crude protein in the diets of
high-yielding dairy cows on energy balance and reproduction
a ,
*
a a a b bI. Bruckental
, M. Holtzman , M. Kaim , Y. Aharoni , S. Zamwell , H. Voet ,
b
A. Arieli
a
Institute of Animal Science, Agricultural Research Organization, The Volcani Center, P.O. Box 6, Bet Dagan 50250, Israel
b
Department of Animal Science, The Hebrew University of Jerusalem, Faculty of Agricultural, Food and Environmental Sciences, Rehovot76100, Israel
Received 23 December 1998; received in revised form 22 April 1999; accepted 10 May 1999
Abstract
This trial was designed to investigate effects of the amount of dietary undegradable crude protein (CP) and the ratio of degradable organic matter to degradable CP in the diets of high-yielding dairy cows on milk yield, energy balance and fertility during the first three months postpartum. Forty-five Israeli Holstein cows were assigned to three dietary treatments at 2 d postpartum. Dietary treatments were (1) 16.7% CP, of which 32% was undegradable (control); (2) 16.7% CP, of which 38% was undegradable; and (3) 18.0% CP, of which 35% was undegradable. Corn gluten meal (CGM) was added to diets 2 and 3 in order to increase undegradability. Cows were fed in groups, and diets were offered as a total mixed ration. Intakes of dry matter (DMI) and CP (kg / d) were 23.8 and 3.975, 21.4 and 3.574, and 20.4 and 3.672, for cows on diets 1, 2 and 3, respectively. No significant differences among the three treatments were found for milk yield, milk protein concentration, milk fat, or protein and lactose yields. Control cows lost 35.0 kg of body weight (BW) during the first 27.2 d postpartum, and then started gaining weight. At approximately day 70 the control cows attained their calving weight. Cows on diets 2 and 3 lost 55 kg of BW during 45 d postpartum and, by the end of the trial, these cows still had not attained their calving weight. Change in body condition score (BCS) during the experimental period revealed the same trends. Mean concentrations (mg / 100 ml) of ammonia N in ruminal fluids and concentrations of plasma urea N were 14.0 and 20.3, 12.7 and 21.2, and 14.7 and 21.3 for cows on diets 1, 2 and 3, respectively. No significant differences among treatments were detected for any reproduction parameter. It was concluded that the differences between control cows and cows on diets 2 and 3 in DMI, BW and BCS during the first period postpartum cannot be attributed to the level of dietary undegradable CP only but to a more
specific effect of CGM. 2000 Elsevier Science B.V. All rights reserved.
Keywords: Dairy cows; Gluten meal; Undegradable CP; Energy balance; Insulin
1. Introduction
*Corresponding author. Tel.: 1972-8-9484-447; fax:1
972-8-Fertility in high-producing dairy herds has been 9475-075.
E-mail address: [email protected] (I. Bruckental) decreasing in recent decades. This phenomenon is
obvious in the Israeli herd (Ron et al., 1984) as well number, milk yield during the previous lactation and as in other countries (Lamming, 1998). Butler and body weight (BW). The cows were maintained in the Smith (1989) found a negative correlation between trial for at least three months. Cows were milked milk yield and conception rate. Ostergaard et al. three times daily, at 06:00, 14:00 and, 20:00 h. Milk (1990) have suggested that the genetic breeding yield and BW were recorded at each milking by the program of a dairy herd is focused on high milk Afimilk system (S.A.E. AFIKIM, Kibbutz Afikim, yields only, without a parallel concern for increased Israel). Body condition was scored once a week. feed consumption. As a result, the partitioning of Milk samples from three consecutive milkings were absorbed metabolites was directed primarily toward collected every 10 days and analyzed for fat, protein milk yield, and deficiency, mainly of energy, was and lactose by the infrared procedure at the Israel developed in other essential metabolic pathways Cattle Association Laboratories (Bitan Aharon, Is-(Nebel and McGillard, 1993). rael). Sixty days after the beginning of the experi-Dairy cows ovulate even if they are in a negative ment, ruminal fluid and jugular blood samples were energy balance. However, ovarian activity is appar- taken from all cows. Rumen samples were taken ent earlier in cows with an improved energy status with a stomach tube. Sampling was done before the (Staples et al., 1990). Sklan et al. (1991) improved first morning meal and 4 and 8 h later. Ruminal fluid the fertility of high-yielding cows by offering diets samples were kept in tubes containing 0.2 ml mer-supplemented with calcium soaps of fatty acids. cury chloride.
Similar diets in other studies (Carroll et al., 1990;
Spicer et al., 1993) failed to improve fertility. The 2.2. Diets examination of dietary ingredients such as protein
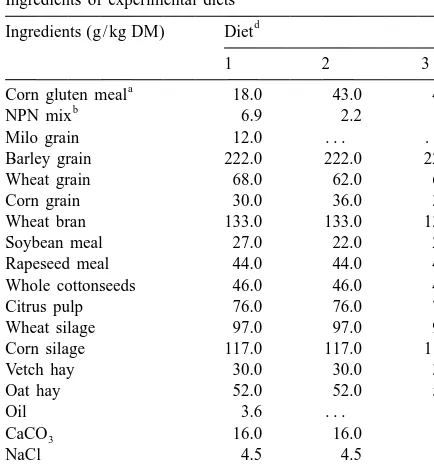
source and concentration would appear to be desir- Diets were formulated to contain 30% forage on a able if the aim is ultimately to improve feed intake DM basis and differed mainly in dietary CP and (Dhiman and Satter, 1993). The effect of dietary UDCP contents (Table 1). Diet 1 the control diet, protein on feed intake is explained partially by the contained 167 g / kg CP, of which 320 g / kg was effect of protein on microbial fermentation and UDCP. Diet 2 contained 167 g / kg CP, of which 380 digestion and by the effect of the amino acid profile g / kg was UDCP. Diet 3 contained 180 g / kg CP, of on whole animal metabolism and yield (Garnsworthy which 350 g / kg was UDCP. The UDCP content of and Cole, 1990). However, there is still a lack of diet 3 was the same as that of diet 2, and the rumen information regarding composition and amount of degradable CP (RDCP) content was the same as in supplementary crude protein (CP). the control diet. Corn gluten meal was added to diets According to the NRC (1989), undegradable (UD) 2 and 3 in order to increase undegradability. Ruminal CP levels in lactating cow diets ranges between 54 degradabilities of organic matter (OM) and CP and 63 g / kg DM. The present work was designed to contents of the dietary ingredients, as assessed by the determine the effect of improved protein availability, dacron bag technique (Ørskov and McDonald, via the higher UDCP concentrations, on dry matter 1979), are presented in Table 2. When ingredient intake (DMI), milk yield, energy balance and fertili- additivity of ruminal degradation is assumed, the ty of high-yielding dairy cows during the first three resultant ratios of ruminally degradable OM to
months postpartum. RDCP in diets 1, 2 and 3 were 4.5, 5.1 and 4.5,
respectively.
Cows were group fed. The diets were fed as a 2. Materials and methods TMR at 10:00 h for ad libitum intake. The feed was moved close to the cows three times a day. Daily
2.1. Animals DM offered of each group and feed refused were
Table 1 2.3. Reproductive management Ingredients of experimental diets
d
Ingredients (g / kg DM) Diet The cows were examined by a veterinarian during the first week after calving. Following this
examina-1 2 3
tion, cows that were diagnosed to have a retained a
Corn gluten meal 18.0 43.0 41.0
b placenta, metritis, or other health problems were
NPN mix 6.9 2.2 7.4
given appropriate medical treatment. Blood for
pro-Milo grain 12.0 . . . .
Barley grain 222.0 222.0 222.0 gesterone analysis was sampled three times weekly, Wheat grain 68.0 62.0 67.0 starting 3 d postpartum and continuing until first
Corn grain 30.0 36.0 36.0
insemination. First postpartum ovulation was defined
Wheat bran 133.0 133.0 133.0
as the first day after calving when plasma
progester-Soybean meal 27.0 22.0 27.0
one concentration reached at least 1 ng / ml. Estrus
Rapeseed meal 44.0 44.0 44.0
Whole cottonseeds 46.0 46.0 46.0 detection was performed by an automated pedometer Citrus pulp 76.0 76.0 76.0 system (S.A.E. AFIKIM) and by visual observation
Wheat silage 97.0 97.0 97.0
during two 30-min periods daily, at 09:00 and 15:00
Corn silage 117.0 117.0 117.0
h. Insemination was commenced 60 d after calving.
Vetch hay 30.0 30.0 30.0
Cows were inseminated at 11:00 h. Pregnancy was
Oat hay 52.0 52.0 52.0
Oil 3.6 . . . 1.1 diagnosed 45 d following insemination by rectal
CaCO3 16.0 16.0 16.0 palpation.
Non-protein nitrogen. Contained (g / kg) 500 ground milo
Chemical analyses were performed on dry feed grain, 333 urea and 167 (NH ) SO . Calculated to supply 12704 2 4
samples that had been ground using a 2-mm mill. g / kg of CP.
c 6 6
Contained 16?10 IU of vitamin A, 3.2?10 IU of vitamin D, Dry matter was assayed after samples were dried at 6
16?10 IU of vitamin E, 48 g of Mo, 48 g of Zn, 48 g of Fe, 19.2 1058C for 12 h; corn silage and citrus pulp were first g of Cu, 3.4 g of I, 0.32 g of Co and 0.48 g of Se. dried at 608C for 48 h. OM was determined after
d
No. 1, 16.7% dietary CP, of which 32% was undegradable
ashing at 6008C for 2 h. Crude protein was analysed (control); No. 2, 16.7% CP, of which 38% was undegradable; and
using a Kjeldhal autoanalyser (Tecator, Hoganas, No. 3, 18.0% CP, of which 35% was undegradable.
Sweden). The NDF content was determined accord-ing to the method of Van Soest et al. (1991). In situ degradabilities of OM and CP in dietary feeds and the kinetics of their degradation in the rumen were
Table 2 determined following the method of Ørskov and
Chemical composition (g / kg of DM) of experimental diets McDonald (1979) and as described by Arieli et al.
b
Diet (1989). The fractional rate of particulate outflow
from the rumen was assumed to be 6.5% / h. Volatile
1 2 3
fatty acids (VFAs) in ruminal fluid that had been
OM 889 903 897
centrifuged were assessed by gas–liquid
chromatog-CP 167 167 180
a raphy (Model 5890; Hewlett-Packard, Avondale, PA,
UDCP 52 63 64
a
RDCP 115 103 116 USA) on 0.3% Carbovax 20M with 0.1% phosphoric
a
RDOM 522 522 522 acid (Supelco, Bellefonte, PA, USA), and ammonia
NDF 345 345 345
was determined by the phenol procedure (Tagari,
Ether extract 75 45 53
1969). Blood was centrifuged, and the plasma was
NE (Mcal / kg)L 1.72 1.72 1.72
separated and analyzed for urea (Tagari, 1969).
RDOM / RDCP 4.5 5.1 4.5
a Glucose was determined by a Beckman Glucose
UDCP5Undegradable CP; RDCP5rumen degradable CP;
Analyzer 2 (Fullerton, CA, USA), and plasma insulin RDOM5rumen degradable OM.
b
radioimmunoassay kits (Diagnostic Products, Los 21.4 and 20.4 kg / d, respectively. Accordingly, net
Angeles, CA, USA). energy (NE) intake of the control cows and cows fed
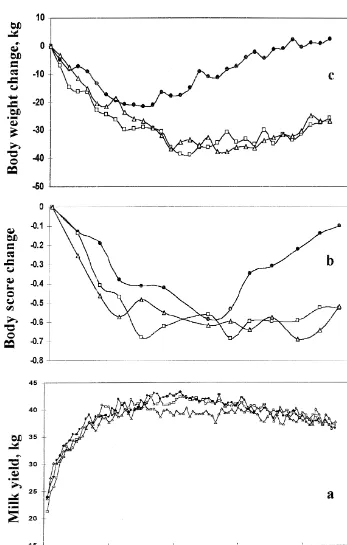
diets 2 and 3 was 40.9, 36.8 and 35.1 Mcal / d, 2.5. Calculations and statistical analyses respectively. Crude protein and UCP intakes of control cows and of cows fed diets 2 and 3 were 4.0 Data were statistically analysed using the GLM and 1.2, 3.6 and 1.4, and 3.7 and 1.3 kg / d, respec-procedure of SAS (1985) to examine the effect of tively. No significant differences among the three cow, parity number, milk yield during previous diets were found for milk yield and milk fat, protein lactation, BW and treatment on performance parame- and lactose concentrations or yields (Table 3). Milk ters. Comparison between control and CGM-sup- yield curves are described in Fig. 1a. Data for BW plemented diets (1 vs. 2 and 3) was tested using and body condition score (BCS) are presented in nonorthogonal contrast. Averages of NH3 N and Table 4, and changes in BW and BCS of cows VFAs in ruminal fluids and of urea N in plasma for during the trial period are described in Fig. 1b and c, samples taken before the first morning meal and 4 respectively. The control cows lost 35.0 kg during and 8 h later, were used for comparing the effect of the first 27.2 d (1.29 kg / d) postpartum, and then diet. The repeated measures analysis of variance started gaining weight. By approximately day 70 (ANOVA) was used for these metabolites. Reproduc- these cows attained their calving weight. Cows fed tive parameters were compared by t test. Statistical diet 2 lost 54.0 kg of BW during 44.8 d (1.21 kg / d) difference was determined at P,0.10. postpartum, and by the end of the trial the cows still had not attained their calving weight. Cows fed diet 3 lost 55.0 kg BW during 44.4 d (1.24 kg / d; P, 3. Results 0.164) and, by the end of the trial these cows still had not attained their calving weight. Changes in Mean feed consumption and milk yield and com- BCS during the trial period expressed the same trend position are given in Table 3. Mean DMI of the as BW (Table 4).
control cows and cows fed diets 2 and 3 were 23.8, Mean ammonia N concentrations in ruminal fluids
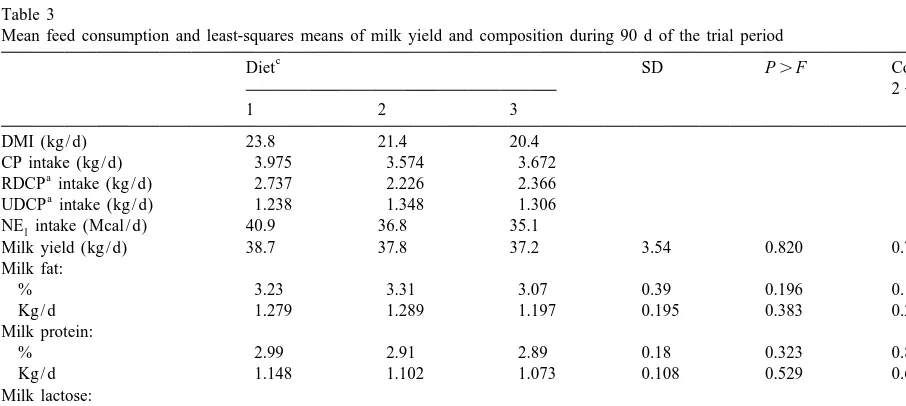
Table 3
Mean feed consumption and least-squares means of milk yield and composition during 90 d of the trial period
c
RDCP intake (kg / d) 2.737 2.226 2.366
a
UDCP intake (kg / d) 1.238 1.348 1.306
NE intake (Mcal / d)l 40.9 36.8 35.1
Milk yield (kg / d) 38.7 37.8 37.2 3.54 0.820 0.713
Milk fat:
% 3.23 3.31 3.07 0.39 0.196 0.187
Kg / d 1.279 1.289 1.197 0.195 0.383 0.230
Milk protein:
% 2.99 2.91 2.89 0.18 0.323 0.863
Kg / d 1.148 1.102 1.073 0.108 0.529 0.620
Milk lactose:
% 4.39 4.49 4.54 0.20 0.286 0.608
Kg / d 1.695 1.683 1.690 0.174 0.993 0.890
b
Milk energy (Mcal / d) 25.4 24.9 23.9 2.75 0.720 0.650
a
RDCP5Degradable CP; UDCP5undegradable CP.
b
Milk energy was calculated according to Tyrrel and Reid (1965).
c
Table 4
Least-squares means for bodyweight (BW) and body condition score (BCS) during 90 d of the trial period
c
Diet SD P.F Contrast
1 vs. 213
1 2 3
a
Initial BW (kg) 613 609 602 57.4 0.910 0.677
Minimal BW (kg) 578 555 547 46.9 0.182 0.128
b
Days to minimal BW 27.4 44.8 44.4 23.6 0.098 0.032
BW loss (kg) 36.4 54.3 54.2 28.1 0.164 0.059
BW 90 d postpartum 616 583 575 51.4 0.097 0.035
a
Initial BCS 2.77 2.89 2.68 0.78 0.930 0.944
Minimal BCS 1.80 1.91 1.77 0.47 0.704 0.817
b
Days to minimal BCS 52.0 65.6 66.7 28.9 0.336 0.143
BCS 90 d postpartum 2.45 2.16 2.00 0.63 0.183 0.086
a
BW and BCS 2 d postpartum.
b
Last day on which minimal BW or BCS was recorded.
c
See footnote d in Table 1.
Table 5 were 14.0, 12.7 and 14.7 mg / 100 ml for control
Least-square means of ammonia N in ruminal fluid, urea N in cows and cows fed diets 2 and 3, respectively (P, plasma, total VFAs in ruminal fluid, and the relative concentration
0.04; Table 5). Mean plasma urea N concentrations of the individual VFAs
were 20.3, 21.2 and 21.3 mg / 100 ml for control 1
Diet S.E.M. P.F
cows and cows fed diets 2 and 3, respectively (P,
1 2 3 0.53; Table 5).
ab b a Total mean VFA concentrations in ruminal fluid
NH N (mg / 100 ml)3 14.0 12.7 14.7 0.48 0.04
Urea N (mg / 100 ml) 20.3 21.2 21.3 0.61 0.53 were 82.5, 77.1 and 82.1 mM / l for control cows and Total VFAs (mM) 82.5 77.1 82.1 4.3 0.65 cows fed diets 2 and 3, respectively (P,0.65; Table Individual VFAs (%): 5). No significant difference was detected among
Acetate (A) 59.8 58.5 60.4 1.2 0.48
diets for the individual VFA concentrations (per-Propionate (P) 26.3 28.0 26.4 0.9 0.42
centage of total) during the time before the morning Butyrate 10.9 10.6 10.8 0.8 0.86
A:P 2.27 2.09 2.29 0.15 0.35 meal was offered and 8 h later (Table 5).
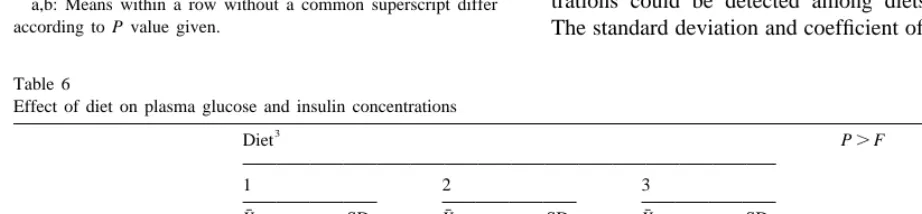
1 No difference in mean plasma glucose
concen-See footnote d in Table 1.
trations could be detected among diets (Table 6). a,b: Means within a row without a common superscript differ
according to P value given. The standard deviation and coefficient of variation of
Table 6
Effect of diet on plasma glucose and insulin concentrations
3
Week 1 6.55 1.16 5.54 1.05 5.93 0.96 0.540 0.218
Week 7 9.71 1.62 10.55 1.81 10.34 1.67 0.712 0.410
a,b: Means within a row without a common superscript differ according to P value given.
1
Mean of 30 samples taken from each of seven cows per treatment during experimental period.
2
Mean of five samples taken from each of 14 cows per treatment during weeks one and seven postpartum.
3
Table 7
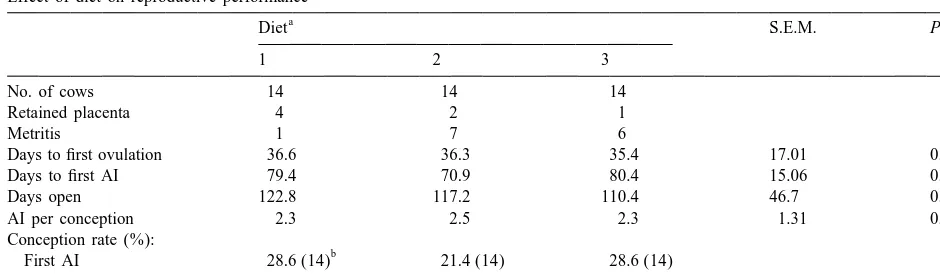
Days to first ovulation 36.6 36.3 35.4 17.01 0.980
Days to first AI 79.4 70.9 80.4 15.06 0.203
Days open 122.8 117.2 110.4 46.7 0.839
AI per conception 2.3 2.5 2.3 1.31 0.663
Conception rate (%):
b
First AI 28.6 (14) 21.4 (14) 28.6 (14)
Second and third AI 30.8 (13) 25.0 (16) 33.3 (12)
a
See footnote d in Table 1.
b
In parentheses, total number of AI.
plasma glucose concentration for control cows were were fed nearly in similar amounts in all diets. smaller (P,0.103 and P,0.062, respectively), Soybean meal and rapeseed meal were supplemented than those for cows fed diets 2 and 3. Plasma insulin to all diets at similar concentrations (Table 1) and concentrations increased from the first to the seventh changes in dietary UDCP were achieved by the week postpartum (P,0.001; Table 6), but there was addition of 25 g / kg of CGM. Dietary UDCP in both no significant difference among diets. diets was increased by 1.1%, which in diet 2 was on The reproductive performance of the experimental the account of the dietary RDCP, but not in diet 3. cows is presented in Table 7. One cow of each diet Dietary RDCP in diet 3 was the same as that in the was removed before being diagnosed as pregnant. control diet, but dietary CP concentration was in-On each diet, 10 of the cows became pregnant. No creased by 1.3%. Accordingly, a shortage of RDCP significant differences among diets could be detected that was required for optimal fermentation by rumi-for any of the reproduction parameters except rumi-for nal microbes could not explain the reduced DMI of metritis, which was detected in one control cow but cows fed diets 2 and 3. More likely, factors related to in seven cows fed diet 2 and in six cows fed diet 3. CGM in these diets were responsible for the negative effect on DMI. Most feedstuffs that are high in UDCP are of animal source. Reduced intake of diets 4. Discussion supplemented with fish meal (Bruckental et al., 1989; Wholt et al., 1991; Atwall and Erfle, 1992),
4.1. Dry matter intake meat and bone meal (Mabjeesh et al., 1996), and
blood meal and feather meal (Waltz et al., 1989) Mean DMI of cows fed diets 2 and 3 was lower by were attributed to palatability or high fat contents. 2.4 and 3.4 kg / d, respectively, than that of the Reduced DMI as a result of feeding CGM was control cows (Table 3). Differences in DMI among reported for cows (Fleck et al., 1988; Blauwiekel et treatments could not be analyzed statistically because al., 1990; Wholt et al., 1991; Wheeler et al., 1995) the cows were fed as a group. However, since CGM and lambs (Staples et al., 1990). However, others is used in large quantities in dairy cow rations, and (Holter et al., 1992; Cozzi and Polan, 1994) reported other performance parameters like as BW and BCS, no effect of CGM on DMI. Reviewing the 12-year were significantly affected by CGM supple- literature of RUDCP in dairy cows diets, Santos et mentation, it was assumed that this issue should be al., (1998) concluded that supplementation of CGM
addressed. resulted in mostly negative results. However, no
The similarity in the response of cows on diets 2 plemented cows lost 58 kg BW during 14 to 16 and 3 to supplemental CGM in DMI, BW loss and weeks of lactation. Cows fed fish meal lost 30 kg BCS change proves the sensitivity of high-yielding during four weeks and cows fed SBM lost 37 kg cows a short time after calving to dietary CGM. during 10 weeks (Wholt et al., 1991). Differences in According to Wheeler et al. (1995), dietary RUDCP mean DMI between cows fed the control diet and level is responsible for increasing insulin concen- cows fed diets 2 and 3 during 45 d of BW loss were trations of cows in early lactation. This period is 2.4 and 3.4 kg / d, respectively, which are equivalent characterized by low DMI and high milk production, to 186 and 263 Mcal NE per 45 d, respectively.l which is maintained by extensive lipolysis of fatty These results correlate well with the energy equiva-tissues and gluconeogenesis. Blood insulin concen- lent of 270 Mcal for 55 kg BW loss (NRC, 1989) of tration is very low immediately after calving (Kop- the CGM fed cows. However, the gradual increase in rowski and Tucker, 1973; Hart et al., 1978; postcalving DMI masks the actual BW loss, which Blauwiekel et al., 1990), which enables a gradual might be even greater. Days to minimal body increase in DMI. The CPS treatment (combination condition (BC) may better represent the period of a protein supplement) in Wheeler et al. (1995) experi- negative energy balance. Days to minimal BC score ment, included CGM without soybean meal (SBM), (BCS) were greater than days to minimal BW by 25, and was most effective in increasing blood insulin 21 and 22 d for control cows and cows fed diets 2 level. Similar results were reported by Landau et al. and 3, respectively (Table 4). Likewise, the rates of (1996), as insulin level was increased in the blood of increase in BCS after minimal value was reached up CGM-fed ewes but not in SBM-fed ewes. In the to the end of the experiment, were 0.0171, 0.0102 present trial, plasma insulin concentrations increased and 0.0099 BCS units per day for the control cows during seven weeks postpartum (P,0.001; Table 6). and cows on diets 2 and 3, respectively. This However, no significant difference between control emphasizes the metabolic difficulty of the CGM-fed cows and cows fed diets 2 and 3 could be found, cow to recover and shift to a positive energy balance except that the increase in insulin tended to be faster later in lactation.
for diets 2 and 3 (an increase of 3.16, 5.01 and 4.41 These results are not compatible with our expecta-mU / l per seven weeks, on diets 1, 2 and 3, respec- tions for a better energy balance by cows fed the tively). The decrease in feed intake by cows fed diets diets supplemented with UDCP (Garnsworthy and 2 and 3 and the probable leveling down CGM intake, Cole, 1990; Dhiman and Satter, 1993; Bruckental et apparently avoided the extra excretion of insulin. al., 1996). It seems that the effect on DMI, BW loss Greater fluctuations in the plasma glucose concen- and BCS of cows on diets 2 and 3, during the first tration of cows fed diets 2 and 3, as compared with period postpartum, cannot be attributed to the higher those of control cows (Table 6), may also point to a undegradability of dietary CP but to a more specific non-stable glucose metabolism. Later in lactation, effect of CGM.
when peak feed intake is reached, blood insulin
concentrations are much higher, and dietary CGM 4.3. Reproductive performance might not have the same impact on metabolism. This
differences among diets were demonstrated for mean Acknowledgements BW loss and for BCS, experimental effects on
The authors thank Channa Lehrer and Moshe reproduction were not detected (Table 7). Similar
Nikbachat for technical assistance. results were reported by Bar-Peled et al. (1995),
when BW loss and reduced BCS were much greater for suckled cows than for the control and for cows
References milked six times daily. However, fertility of the
suckled cows was similar to the cows on the two
Arieli, A., Bruckental, I., Smoler, E., 1989. Prediction of duodenal other treatments (personal communication). Fertility
nitrogen supply from degradation of organic and nitrogenous of ewes fed with CGM for four days before and four
matter in-situ. J. Dairy Sci. 72, 2532–2539.
days after treatment with prostaglandin F , was2a Andersson, L., Gustafsson, A.H., Emanuelson, U., 1991. Effect of better than that of ewes fed SBM or isoenergetic hyperketonaemia and feeding on fertility in dairy cows. supplement (Landau et al., 1996). They concluded Theriogenology 36, 521.
Atwall, A.S., Erfle, J.D., 1992. Effects of feeding fishmeal to cows that insulin and glucose metabolism may be involved
on digestibility, milk production and milk composition. J. in the effect of supplemental protein. Likewise, a
Dairy Sci. 75, 502–507.
better fertility has been reported for cows fed low as Bar-Peled, U., Maltz, E., Bruckental, I., Folman, Y., Kali, Y., compared with high CP degradable diets (Ferguson Gacitua, H., Lehrer, R., Knight, C.H., Robinzon, B., Voet, H., et al., 1988; Bruckental et al., 1989; Canfield et al., Tagari, H., 1995. Relationship between frequent milking or suckling in early lactation and milk production of high 1990; Ferguson et al., 1993). The incidence of
producing dairy cows. J. Dairy Sci. 78, 2726–2736. retained placenta is affected mainly by the condition
Barton, B.A., Rosario, H.A., Anderson, G.W., Grindle, B.P., of the cow before and during calving, and no Carroll, D.J., 1996. Effects of dietary crude protein, breed, treatment effect was expected. Appearance of met- parity and health status on the fertility of dairy cows. J. Dairy ritis is induced by the postpartum physiological Sci. 79, 2225–2236.
Blauwiekel, R., Hoover, W.H., Slider, S.D., Miller, T.K., 1990. condition of the cow. The higher incidence of
Effects of fish meal protein supplementation on milk yield and metritis in cows fed diets 2 and 3 compared with
composition and blood constituents of dairy cows. J. Dairy Sci. control cows (Table 7) could have been a result of a 73, 3217–3221.
greater negative balance of energy and of other Bruckental, I., Drori, D., Kaim, M., Lehrer, H., Folman, Y., 1989. nutrients, which could increase the sensitivity of Effect of source and level of protein on milk yield and reproductive performance of high-producing primiparous and genital organs to pathogens. However, because of
multiparous dairy cows. Anim. Prod. 48, 319–329. good management, including early detection of
dis-Bruckental, I., Tagari, H., Arieli, A., Zamwell, S., Aharoni, Y., orders, timely treatment and subsequent monitoring Genizi, A., 1996. The effect of undegradable crude protein for the efficacy of a treatment, no effect on days to supplementation on milk production and composition and first ovulation or days to first AI could be detected reproduction of early lactating cows. J. Anim. feed Sci. 5,
95–106. (Table 7). Howard et al. (1987) and Barton et al.
Butler, W.R., Smith, R.D., 1989. Interrelationships between energy (1996) claimed that many declines in reproduction
balance and postpartum reproductive function in dairy cattle. J. attributed to nutritional factors could be controlled Dairy Sci. 72, 767–783.
by a proper veterinary management. Canfield, R.W., Sniffen, C.J., Butler, W.R., 1990. Effect of excess degradable protein on postpartum reproduction and energy balance in dairy cattle. J. Dairy Sci. 73, 2342–2349. Carroll, D.J., Jerred, M.J., Grummer, M.J., Combs, D.K., Pierson, 5. Conclusions
R.A., Hauser, E.R., 1990. Effect of fat supplementation and immature alfalfa to concentrate ratio on plasma progesterone, DMI of dairy cows during the first period after energy balance and reproductive traits of dairy cattle. J. Dairy calving is low and cannot fulfill energy requirements Sci. 73, 2855–2863.
Cozzi, G., Polan, C.E., 1994. Corn gluten meal or dried brewers for production. Feeding the cows diets containing
grain as partial replacement for soybean meal in the diet of approximately 40 g / kg CGM might reduce DMI and
Holstein cows. J. Dairy Sci. 77, 825–834.
Ferguson, J.D., Blanchard, T., Galligan, D.T., Hoshall, D.C., Ørskov, E.R., McDonald, I., 1979. The estimation of protein Chalupa, W., 1988. Infertility in dairy cattle fed a high degradability in the rumen from incubation measurements percentage of protein degradable in the rumen. J. Am. Vet. weighted according to the rate of passage. J. Agric. Sci.
Med. Assoc. 192, 659–662. (Camb.) 92, 499–504.
Ferguson, J.D., Callgan, D.T., Blanchard, T., Reeves, M., 1993. Ostergaard, V., Korver, S., Solbu, H., Anderson, B.B., Oldham, J., Serum urea nitrogen and conception rate: the usefulness of test Wiktorsson, H., 1990. Main report – E.A.A.P working group information. J. Dairy Sci. 76, 3742–3746. on: efficiency in the dairy cow. Livest. Prod. Sci. 24, 287–304. Fleck, A.T., Lusby, K.S., Owens, F.N., McCollum, F.T., 1988. Ron, M., Bar-Anan, R., Wiggans, G.R., 1984. Factors affecting Effects of corn gluten feed on forage intake, digestibility and conception rate of Israeli Holstein cattle. J. Dairy Sci. 67, ruminal parameters of cattle fed native grass hay. J. Anim. Sci. 854–864.
66, 750–757. Santos, F.A.P., Santos, J.E.P., Theurer, C.B., Huber, T., 1998. Garnsworthy, P.C., Cole, D.J.A., 1990. The importance of intake Effects of rumen-undegradable protein on dairy cow perform-in feed evaluation. In: Wiesman, J., Cole, D.J.A. (Eds.), ance: a 12-year literature review. J. Dairy Sci. 81, 3182–3213. Feedstuff Evaluation, Butterworths, London, p. 147. SAS, 1985. SAS User’s Guide: Statistics, Version 5 ed., SAS Hart, I.C., Bines, J.A., Morant, S.V., Ridley, J.L., 1978. Endocrine Institute, Cary, NC.
control of energy metabolism in the cow: comparison of the Sklan, D., Moalem, U., Folman, Y., 1991. Effect of feeding levels of hormones (prolactin, growth hormone, insulin and calcium soaps of fatty acids on production and reproduction thyroxine) and metabolites in the plasma of high- and low- responses in high producing lactating cows. J. Dairy Sci. 74, yielding cattle at various stages of lactation. J. Endocrinol. 77, 510–517.
333. Spicer, L.J., Vernon, R.K., Tucker, W.B., Wattermann, R.P., Hogue, Holter, J.B., Hayes, H.H., Urban, Jr. W.E., Ramsey, S., Ridequt, J.F., Adams, G.D., 1993. Effect of inert fat on energy balance, H., 1992. Response of Holstein cows to corn gluten meal used plasma concentrations of hormones, and reproduction in dairy to increase undegradable protein in early or later lactation. J. cattle. J. Dairy Sci. 76, 2664–2673.
Dairy Sci. 75, 1495–1506. Staples, C.R., Thatcher, W.W., Clark, J.H., 1990. Relationship Howard, H.J., Aalseth, E.P., Adams, G.D., Bish, L.J., McNew, between ovarian activity and energy status during the early R.W., Dawson, L.J., 1987. Influence of dietary protein on postpartum period of high producing dairy cows. J. Dairy Sci. reproductive performance of dairy cows. J. Dairy Sci. 70, 73, 938–947.
1563–1571. Tagari, H., 1969. Comparison of the efficiency of protein con-Koprowski, J.A., Tucker, H.A., 1973. Bovine serum growth tained in lucerne hay and soya-bean meal for sheep. Br. J. Nutr.
hormone, corticoids and insulin during lactation. Endocrinolo- 23, 455–470.
gy 93, 645–651. Tyrrel, H.F., Reid, J.T., 1965. Prediction of the energy value of Lamming, G.E., 1998. Alternatives to invasive genetic engineer- cow’s milk. J. Dairy Sci. 48, 1215–1223.
ing in animal production. In: Garnsworthy, P.C., Wiseman, J. Van Soest, P.J., Robertson, J.B., Lewis, B.A., 1991. Methods for (Eds.), Recent Advances in Animal Nutrition, University Press, dietary fiber, neutral detergent fiber, and nonstarch polysac-Nottingham, pp. 153–163. charides in relation to animal nutrition. J. Dairy Sci. 74, Landau, S., Houghton, J.A.S., Mawhinney, J.R., Inskeep, E.K., 3583–3597.
1996. Protein sources affect follicular dynamics in ewes near Waltz, D.M., Stern, M.D., Illg, D.J., 1989. Effect of ruminal the onset of the breeding season. Reprod. Fertil. Dev. 8, protein degradation of blood meal and feather meal on the 1021–1028. intestinal amino acid supply to lactating cows. J. Dairy Sci. 72, Mabjeesh, S.J., Arieli, A., Bruckental, I., Zamwell, S., Tagari, H., 1509–1518.
1996. Effect of type of protein supplementation on duodenal Wheeler, J.G., Amos, H.E., Froetschel, M.A., Coomer, J.C., amino acid flow and absorption in lactating dairy cows. J. Maddox, T., 1995. Responses of early lactation cows fed Dairy Sci. 79, 1792–1801. winter and summer annual forages and undegradable intake Nebel, R.L., McGillard, M.L., 1993. Interactions of high milk and protein. J. Dairy Sci. 78, 2767–2781.
reproductive performance in dairy cows. J. Dairy Sci. 76, Wholt, J.E., Chmiel, S.L., Zajac, P.K., Backer, L., Blethen, D.B., 3257–3268. Evans, J.L., 1991. Dry matter intake, milk yield and com-NRC, 1989. Nutrient Requirements of Dairy Cattle, National position and nitrogen use in Holstein cows fed soybeans, fish