Full Terms & Conditions of access and use can be found at
http://www.tandfonline.com/action/journalInformation?journalCode=vjeb20
Download by: [Universitas Maritim Raja Ali Haji] Date: 13 January 2016, At: 00:16
Journal of Education for Business
ISSN: 0883-2323 (Print) 1940-3356 (Online) Journal homepage: http://www.tandfonline.com/loi/vjeb20
Statistical Components of an Undergraduate
Business Degree: Putting the Horse Before the
Cart
Charles Zeis , Abhay Shah , Hailu Regassa & Ahmad Ahmadian
To cite this article: Charles Zeis , Abhay Shah , Hailu Regassa & Ahmad Ahmadian (2001) Statistical Components of an Undergraduate Business Degree: Putting the Horse Before the Cart, Journal of Education for Business, 77:2, 83-88, DOI: 10.1080/08832320109599054 To link to this article: http://dx.doi.org/10.1080/08832320109599054
Published online: 31 Mar 2010.
Submit your article to this journal
Article views: 12
View related articles
Statistical Components
of
an
Underaraduate Business Dearee:
Putting the Horse Before the Cart
CHARLES ZElS
ABHAY SHAH
HAILU REGASSA
AHMAD AHMADIAN
zyxwvutsrqponmlkjihgfedcbaZYXWVUTSRQPONMLKJIHGFEDCBA
University of Southern Colorado
Pueblo, Colorado tatistics is the science dealing with
the collection, organization, pre- sentation, analysis, and inference of data. Traditionally, university statistics courses deal almost exclusively with the analysis and inference part and do not address substantively the collection, organization, and presentation areas (Hogg, 1991). In this article, we present a new sequence for teaching statistics in the business curriculum. In the new approach, designed to “put the horse before the cart,” data collection and management are presented before analysis and inference. Because of con- cerns raised in previous literature, sta- tisticians and other educators have been calling for changes in our methods of delivery. We discuss our experience of implementation of this new approach at the Hasan School of Business of the University of Southern Colorado.
To assess the change, we adminis- tered a survey containing 51 statistical learning outcomes, both mathematical and nonmathematical, to 186 under- graduate students. We administered the survey before, during, and after the cur- riculum change, over a period of time encompassing 3 semesters. A factor analysis resulted in six constructs of learning outcomes, with Cronbach’s alpha ranging from .89 to -95. We ana- lyzed the constructs for trends in time
and differences between courses. Our
zyxwvutsrqponmlkjihgfedcbaZYXWVUTSRQPONMLKJIHGFEDCBA
II
ABSTRACT. Traditionally, statisticscourses in universities cover almost exclusively topics related to analysis
and inference and do not address the collection, organization, and presenta- tion of data. In this article, the authors
discuss a new approach in which the collection, organization, and presenta- tion of data, including mathematical
and nonmathematical topics, are
taught in an introductory course fol- lowed by a subsequent course focus-
ing on analysis and inference. Having implemented such an approach at the
University of Southern Colorado Hasan School of Business, the authors surveyed students to assess their learn-
ing outcomes and skills before and
after the change. Results showed that
ll
results show evidence of an overall increase in reported skill levels for five of the six constructs during the course of the curriculum change.
Topics in Traditional Undergraduate Business Statistics
Parker and Pettijohn (1999) reported that 72.8% of a sample of AACSB- accredited business schools provided undergraduates with the opportunity to take two statistics courses. (AACSB remains the acronym for what is cur- rently known as the International Asso- ciation for Management Education.) Less than 1% of their sample of 114 AACSB-accredited schools required no
statistics. Topics listed resembled those found in typical business statistics texts, such as Kvanli, Pavur, and Guynes (2000). Topics that averaged 4 or higher on a 5-point scale of importance were descriptive statistics, tables and charts, estimation and hypothesis testing, linear regression and correlation, multiple regression, time series, and quality and productivity.
Strasser and Osgur (1995) surveyed 139 respondent faculty members with regard to topics taught in business sta- tistics courses. Eighty-six percent of these respondents taught in AACSB schools. Descriptive statistics, probabil- ity and probability distributions, estima- tion and hypothesis testing for various one-sample and two-sample situations, and simple linear regression were pre- dominant in the first course, whereas multiple regression, analysis of variance (ANOVA), time series, contingency tables, and other methods appeared when a subsequent course was taught. Overall, 65% of those surveyed did not use cases, 79% did not use presenta- tions, and 59% did not do experiments or perform demonstrations. Seventy- five percent reported using computer packages, with over one third of these using Minitab. Suggested improvements included greater use of computers and real data as well as smaller classes.
Slightly more recently, Tabatabai and
zyxwvutsrqponmlkjihgfedcbaZYXWVUTSRQPONMLKJIHGFEDCBA
November/December 2001
zyxwvutsrqponmlkjihgfedcbaZYXWVUTSRQPONMLKJIHGFEDCBA
zyxwvutsrqponmlkjihgfedcbaZYXWVUTSRQPONMLKJIHGFEDCBA
83Gamble ( 1
zyxwvutsrqponmlkjihgfedcbaZYXWVUTSRQPONMLKJIHGFEDCBA
997) studied content of statis- tics courses at 500 higher educationinstitutions in the United States. They reported that 95% of all business stu- dents were required to take at least one course and that at least 51% were required to take two. For the first course in business statistics, Tabatabai and Gamble found the same predominant topics reported previously by Strasser and Osgur (1995), except that display- ing data and data collection were also included. The second course in business statistics covered topics such as regres- sion, hypothesis testing, ANOVA, mul- tivariate ANOVA, and advanced proba- bility. The leading software package
still seemed to be Minitab,
zyxwvutsrqponmlkjihgfedcbaZYXWVUTSRQPONMLKJIHGFEDCBA
but interest-ingly, 40% of the respondents did not report software in the first course and 64% did not report such use in the sec- ond.
Giesbrecht, Sell, Scialfa, Sandals, and Ethers ( I 997) gave an extensive list of essential topics for nonbusiness intro- ductory statistics courses. These topics
include a total of
zyxwvutsrqponmlkjihgfedcbaZYXWVUTSRQPONMLKJIHGFEDCBA
102 statistical topics in20 categories. The researchers conclud- ed that 14% of those topics, which were consistent with the main topics covered in introductory business courses, were deemed to be important by 18 profes- sors in natural sciences, social sciences, and education.
Hindrances to Learning of Statistics
Zeidner ( 1992) stated that cillege stu- dents probably find statistics to be one of their most rigorous, demanding, and anxiety-producing courses. Zanakis and Valenzi (1997) drew important conclu- sions about business statistics educa- tion. They found that tests and the lack of understanding of statistics were the high-anxiety-provoking items among students taking a second course in busi- ness statistics. Students’ grades were also influenced by initial math anxiety and (lack of) computer experience. The researchers recommended that courses be modified to strengthen student beliefs in statistics and reduce test anxi- ety. They also advocated group assign- ments, cases, and so forth as ways to reduce reliance on tests.
Benson (1989) indicated that statisti-
cal test anxiety is common and plays a large role in class performance for many students. Rustagi (1997) pointed out that most students do not retain suffi- cient information from quantitative courses such as statistics.
New Directions
Robert Hogg (1991), an eminent author and teacher of statistical theory and methods, called for major changes. He called for more project work entail- ing students’ generating their own data, so as to give students the actual experi- ence of data collection, summarization, and communication. The trend in the 1990s has been toward greater use of computers, real data, and projects (Cobb, 1993; Fillebrown, 1994; Hol- comb, Jr. & Ruffer, 2000; Ledolter, 1995). Hillmer (1996) advocated a problem-solving pedagogical approach that would motivate students to study statistics and become better prepared to use statistics in management careers. Lesser (1998) reported a link between a technology-rich, standards-based approach and student ability to critique and relate statistics to their everyday world.
In 1999, Higgins and Hogg stated that more curriculum programs should concentrate on statistics. They reported that schools that concentrate on statis- tics constituted about 10% of the 4-year colleges and universities in the country. Their study underscored the importance of the nonmathematical components of the statistics discipline. These include coverage of scientific processes of mea- surement and sampling, planning and managing of surveys and scientific experiments, statistical software and data management, graphics, communi- cation of statistical ideas, and manage- ment principles for statistics.
A New Approach
Topics taught in statistics courses usually include little under the category of collection and management of data. We believe that program designers must systematically address these nonmathe- matical aspects to alleviate students’ anxieties regarding math, statistics, and computers.
During the 1990s, the Hasan School of Business at the University of South- ern Colorado decided to go beyond use of projects and change the ordering of topics for statistics. A new sequence was instituted in which students learn data collection, management, and com- puter presentation in an introductory course. Then, after completing math requirements in algebra and quantitative methods, the students study analysis and inference in the “second’ statistics course. The justification for these changes were the following:
1. Traditional statistics courses are analysis and inference oriented, with lit- tle introduction to what data are or how they are gathered. The traditional cours- es have assigned problems that direct students to find solutions through use of data obtained from outside the course. This may not have much meaning to the student. A case approach is not enough. Students need to actually gather data, have goals in mind, and manage a data set to really appreciate what it is, what its characteristics are, and how it is interpreted.
2. Many students do not learn how to design a survey, establish a sample, or manage a real data set until they are juniors or seniors. Then, they learn about these topics in some kind of research class (e.g., Marketing Research, Busi- ness Research, Managerial Economics,). This is the reverse of the way it should be. It is more natural to start with raw data and work toward solutions to ques- tions heuristically, graphically, and intu- itively. This sequence will also reduce student anxiety.
3. Nonis and Hudson (1999) suggest-
ed that, in order to better prepare stu- dents for the Marketing Research course, which is required by 90% of undergrad- uate marketing programs of AACSB schools, programs should institute a sec- ond statistics course with a decisionmak- ing emphasis (Ganesh, 1992).
Methods for Assessing the New Approach
To try to assess the impact. if any, that the new cumculum would have on stu- dent learning outcomes, we devised an instrument to measure student skill lev-
04
zyxwvutsrqponmlkjihgfedcbaZYXWVUTSRQPONMLKJIHGFEDCBA
JournalzyxwvutsrqponmlkjihgfedcbaZYXWVUTSRQPONMLKJIHGFEDCBA
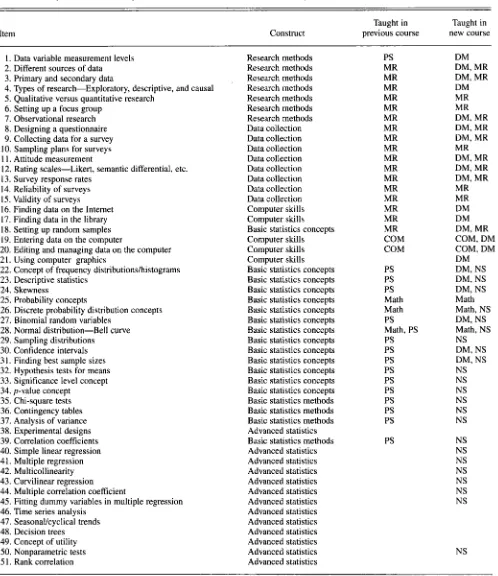
of Education for BusinessTABLE 1. Respondents’ Self-Reported Skill Levels: Items for Data Management and Statistical Topics
zyxwvutsrqponmlkjihgfedcbaZYXWVUTSRQPONMLKJIHGFEDCBA
Taught in Taught in Item Construct previous course new course
I . Data variable measurement levels 2. Different sources of data 3. Primary and secondary data
4. Types of research-Exploratory, descriptive, and causal
zyxwvutsrqponmlkjihgfedcbaZYXWVUTSRQPONMLKJIHGFEDCBA
5. Qualitative versus quantitative research
6. Setting up a focus group
7. Observational research
zyxwvutsrqponmlkjihgfedcbaZYXWVUTSRQPONMLKJIHGFEDCBA
8. Designing a questionnaire
9. Collecting data for a survey
10. Sampling plans for surveys
1 1.
zyxwvutsrqponmlkjihgfedcbaZYXWVUTSRQPONMLKJIHGFEDCBA
Attitude measurement 12. Rating scales-Likert, semantic differential, etc.13. Survey response rates 14. Reliability of surveys
IS. Validity of surveys 16. Finding data on the Internet
17. Finding data in the library 18. Setting up random samples 19. Entering data on the computer
20. Editing and managing data on the computer 2 1. Using computer graphics
22. Concept of frequency distributionshistograms 23. Descriptive statistics
24. Skewness
25. Probability concepts
26. Discrete probability distribution concepts 27. Binomial random variables
28. Normal distribution-Bell curve 29. Sampling distributions
30. Confidence intervals 3 I . Finding best sample sizes 32. Hypothesis tests for means 33. Significance level concept 34. p-value concept
35. Chi-square tests 36. Contingency tables 37. Analysis of variance 38. Experimental designs 39. Correlation coefficients 40. Simple linear regression
41. Multiple regression 42. Multicollinearity 43. Curvilinear regression 44. Multiple correlation coefficient
45. Fitting dummy variables in multiple regression 46. Time series analysis
47. Seasonal/cyclical trends 48. Decision trees
49. Concept of utility
SO. Nonparametric tests
zyxwvutsrqponmlkjihgfedcbaZYXWVUTSRQPONMLKJIHGFEDCBA
S 1. Rank correlation
Research methods Research methods Research methods Research methods Research methods Research methods Research methods Data collection Data collection Data collection Data collection Data collection Data collection Data collection Data collection Computer skills Computer skills Basic statistics concepts Computer skills Computer skills Computer skills
Basic statistics concepts Basic statistics concepts Basic statistics concepts Basic statistics concepts Basic statistics concepts Basic statistics concepts Basic statistics concepts Basic statistics concepts Basic statistics concepts Basic statistics concepts Basic statistics concepts Basic statistics concepts Basic statistics concepts Basic statistics methods Basic statistics methods Basic statistics methods Advanced statistics Basic statistics methods Advanced statistics Advanced statistics Advanced statistics Advanced statistics Advanced statistics Advanced statistics Advanced statistics Advanced statistics Advanced statistics Advanced statistics Advanced statistics Advanced statistics PS MR MR MR MR MR MR MR MR MR MR MR MR MR MR MR MR MR COM COM PS PS PS Math Math PS Math, PS PS PS PS PS PS PS PS PS PS PS DM DM, MR DM, MR DM MR MR DM, MR DM, MR DM, MR MR DM, MR DM, MR DM, MR MR MR DM DM DM, MR COM, DM COM, DM DM DM, NS DM, NS DM, NS Math Math, NS
DM, NS Math, NS NS DM, NS DM, NS
NS NS NS NS NS NS NS NS NS NS NS NS NS NS
Note. Skill was rated on a 5-point scale ranging from 1 (nor at all skilled)
zyxwvutsrqponmlkjihgfedcbaZYXWVUTSRQPONMLKJIHGFEDCBA
through 3 (somewhar skilled) to 5 (very highly skilled). PS = previous statistics. NS = new statistics, COM = other computer classes, Math = required math class, DM = data management, and MR = marketing research.els in various data-related and statistical topics. The skill levels were self-report- ed o n a 5-point scale ranging from 1
(not at all skilled) t o 5 (very highly skilled). We defined 51 items covering
the general statistical categories men-
tioned earlier as well as categories of
general research and data management (see Table 1). Each of the 20 categories used by Giesbrecht e t al. (1997) was
addressed. T h e use of these 5 1 items
was a compromise: We wished to cover the major areas of data management and statistics as well as keep the instrument short enough t o b e functional.
November/Decemher 2001 85
The self-assessment survey was administered to students in both the “previous” and “new” curriculums. The previous curriculum was the Introducto- ry Statistics course, with a group project and presentation that covered descrip- tive statistics, probability distributions (including discrete, binomial, and nor- mal), confidence intervals and sample size determination, parametric hypothe- sis testing for large and smallhormal samples, one-way ANOVA, chi-square analysis (binomial, multinomial, and contingency table analysis), and corre- lation. The “new” curriculum had two courses. The first was Data Manage- ment, and the second was Inferential Statistics, which included more advanced topics such as multiple regres- sion, compared with the previous statis- tics course.
The data in Table 1 show that the first course included items 1-5, 7-9, 11-13,
18- 24, 30, and 3 1. The second course covered items 22-24, 26-31, 39-45, and 50. We decided to include statistical items from present and previous courses and items that were not taught in the undergraduate curriculum.
We administered the self-assessment survey at the beginning and at the end of each semester (a) before the new cur- riculum went into effect, to the students in the previous course (referred to as “Previous Statistics”); (b) during the transition, to the students in both the old and new courses; and (c) after the tran- sition, to the students in the new cours- es (referred to as “New Statistics”). We also administered the survey to a Mar- keting Research class, to study differ- ences between courses.
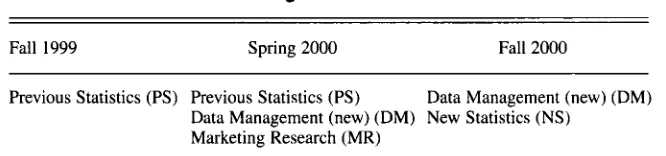
The curriculum was changed over a period of 2 semesters. In Table 2, we show the sequence of courses that were offered between Fall 1999 and Fall 2000. Previous Statistics was the former statistical methods course, which included basic statistical concepts and methods, statistical inference, and pro- jects, but no formal data collection top- ics. The new Data Management course included basic research concepts, data collection, survey methods, computer skills, and summary statistics up to con- fidence intervals. Marketing Research was a typical course taught to senior
marketing and management students; it
zyxwvutsrqponmlkjihgfedcbaZYXWVUTSRQPONMLKJIHGFEDCBA
I
TABLE 2. Courses Offered During 3-Semester Transition
Fall 1999 Spring 2000 Fall 2000
Previous Statistics (PS) Previous Statistics
zyxwvutsrqponmlkjihgfedcbaZYXWVUTSRQPONMLKJIHGFEDCBA
(PS) Data Management (new) (DM)Data Management (new) (DM) New Statistics (NS)
Marketing Research
zyxwvutsrqponmlkjihgfedcbaZYXWVUTSRQPONMLKJIHGFEDCBA
( M R )included research methods, data collec- tion, survey methods, and some advanced statistical methods. (Overlap- ping topics in Marketing Research and Statistics classes were taught in greater depth.) In New Statistics, basic statisti- cal concepts, statistical methods, and many advanced statistical methods were reviewed. New Statistics (and Previous Statistics) had a math prerequisite that included algebra, probability, and nor- mal distribution concepts. All courses included projects.
Some topics taught in the new cur- riculum were not taught in the old, and some advanced topics were not taught in either. Also, some topics in the new Data Management class were nonmath- ematical.
Method
We administered questionnaires to students in all the aforementioned cours- es during the 3 semesters, both at the beginning and the end of the semesters, except for Fall 1999, when we used only end-of-semester surveys. A total of 339 questionnaires were processed, includ- ing 153 beginning-of-semester and 186 end-of-semester forms. (The difference is due to the lack of beginning-of-semes- ter forms in Fall 1999 and some attrition during the other semesters.) Though we did not require students’ identification, we requested it to estimate the differ- ences between the “before” and “after” groups of students. Ninety-five students identified themselves.
To identify the constructs, we ran fac- tor analyses using (a) all the data, (b) only the “after” data, and (c) only the student-identified data. We tried various rotations, using the criteria that eigen- values were 1.0 or more. Varimax and equimax rotation results were almost identical. There was a pattern of factors that emerged repeatedly, falling into the
following groups: (a) research methods,
(b) data collection methods, (c) comput- er skills, (d). basic stats concepts, (e) basic stat methods, and (f) advanced stats. We chose the varimax grouping based on the best Cronbach’s alphas, which ranged from .89 to .96 in the final set of constructs.
We calculated means for each of the six constructs. Because the data were very unbalanced, we ran general linear model analyses to analyze time trends and course and beginning-of-semester versus end-of-semester differences. The time variable (values 1, 2, and 3) was
entered as a covariate. The beginning- versus-end differences, which were all significant at the .01 level, were not the target of the analysis. They were in the model for control purposes. We did all of our analyses in SPSS-XTM.
Results
We analyzed the impact of the new approach through factor analysis and general linear model analysis. In Table 3, we provide statistics on the six con- structs that illustrate the high degree of correlation of component items and the level and strength of increases in time. P values are from general linear model analysis of the time covariate.
The data in Table 3 show that, within constructs, items were highly correlat- ed, as indicated by the values of Cron- bach’s alpha. (See Table 1 for specific items within each construct.) This means that respondents scored items within constructs consistently (called “internal consistency”). This verifies that the items were well defined and suggests that such a large number of
items, a total of
zyxwvutsrqponmlkjihgfedcbaZYXWVUTSRQPONMLKJIHGFEDCBA
5 1, can be reduced to asmaller number for future assessment instruments.
Moreover, coefficients for time covariates for all six constructs were
86
zyxwvutsrqponmlkjihgfedcbaZYXWVUTSRQPONMLKJIHGFEDCBA
Journal of Education for Business [image:5.612.230.563.51.129.2]TABLE 3. Statistics for the Six Constructs
zyxwvutsrqponmlkjihgfedcbaZYXWVUTSRQPONMLKJIHGFEDCBA
Construct
Time covariate Course differences
Items Cronbach’s alpha Coefficient
zyxwvutsrqponmlkjihgfedcbaZYXWVUTSRQPONMLKJIHGFEDCBA
p valuezyxwvutsrqponmlkjihgfedcbaZYXWVUTSRQPONMLKJIHGFEDCBA
(p value) Research methods 7Data collection 8
Basic statistics concepts 13
Basic statistics methods
zyxwvutsrqponmlkjihgfedcbaZYXWVUTSRQPONMLKJIHGFEDCBA
5Advanced statistics 13 Computer skills 5
.90 .94 .89 .96 .93 .96
+.30 ,007 +.24 .04 1
+.31 ,014 +.22 .044
+.12 .274 +.33 .004
,015
.229 .067 ,003
.ooo
.285
Note. Analyses was done using
zyxwvutsrqponmlkjihgfedcbaZYXWVUTSRQPONMLKJIHGFEDCBA
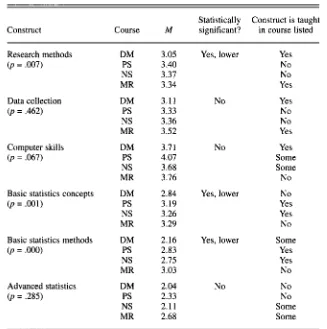
SPSS-XTM.TABLE 4. Means (Adjusted for Overall Time Differences) for Four Courses, by Construct
Statistically Construct is taught
Construct Course
zyxwvutsrqponmlkjihgfedcbaZYXWVUTSRQPONMLKJIHGFEDCBA
M significant? in course listedResearch methods
(p = ,007) Data collection
(p = .462) Computer skills
(p = .067)
Basic statistics concepts
(p = .001)
Basic statistics methods
(p = .OOO)
Advanced statistics
(p = .285)
DM
PS
NS
MR DM
PS
NS
MR DM
PS NS
MR DM
PS NS
MR DM
PS
NS
MR DM
PS NS
MR
3.05 3.40 3.37 3.34 3.11 3.33 3.36 3.52 3.71 4.07 3.68 3.76 2.84 3.19 3.26 3.29 2.16 2.83 2.75 3.03 2.04 2.33 2.1 1 2.68
Yes, lower Yes No No Yes
No Yes
No
No Yes
No Yes Some Some
No
Yes, lower No Yes Yes
No
Yes Yes No
No No No Some Some Yes, lower Some
Note. Skill was rated on a 5-point scale ranging from I (not
zyxwvutsrqponmlkjihgfedcbaZYXWVUTSRQPONMLKJIHGFEDCBA
at all skilled) through 3 (somewhatskilled) to 5
zyxwvutsrqponmlkjihgfedcbaZYXWVUTSRQPONMLKJIHGFEDCBA
(very highly skilled). PS = previous statistics,zyxwvutsrqponmlkjihgfedcbaZYXWVUTSRQPONMLKJIHGFEDCBA
DM = data management, NS = new sta- tistics, and MR = marketing research.positive, indicating improvement in skill levels. P values for the time covari- ates were smaller than .05 for five of the six constructs, indicating that these improvements were significant. The only construct not significantly improved was “basic statistics con- cepts.” Overall we see a clear indication
of improvement of reported skill levels over the period of observation.
Finally, some significant differences were seen between courses, over and above overall time differences. These are presented in Table 4.
The data in Table 4 show that stu- dents in the Data Management course
reported lower skill levels compared with students in the other courses. They were beginning students who had not yet been required to take the math pre- requisites. They did not have as much research or data collection experience as the other students. We see lower report- ed skill levels for those students in three of the six constructs.
We expected to find no significant differences between skill levels for Pre- vious Statistics and New Statistics for all constructs except for Advanced Statistics. We expected Marketing Research students to show higher val- ues in some constructs, as they were seniors who had had math and Previous Statistics (or the equivalent) as prereq- uisites. We found no significant differ- ences between reported skill levels for each of the other three courses. This is more surprising for the Marketing Research students. This reinforces the findings of Nonis and Hudson (1999) that Marketing Research has not been well served by traditional quantitative preparation.
The control variable in the general linear model was for assessing begin- ning-versus-end effects. Though we did not report it, we found this to be signif- icant at the .01 level for each construct. This was as expected, as students will certainly report lower skill levels before taking a course than after, particularly for skills that are covered in the course. Computer skills averages were higher than other construct averages. This pleases our managers, who have deter- mined that a big part of our mission is to raise the technological expertise of our
students. Finally, basic statistical meth- ods and advanced statistical methods
NovembedDecember 2001 87
[image:6.612.53.380.250.579.2]averages were lower than other con- struct averages. These areas need
improvement.
zyxwvutsrqponmlkjihgfedcbaZYXWVUTSRQPONMLKJIHGFEDCBA
Summary
The results of our study support our belief that students will learn statistics better if the course is put in a context of business research in a multiple-semester sequence in which they learn how to collect, organize, and manage the data before they learn analysis and inference. The results show that the students’ beliefs that they can carry out research successfully will be reinforced by the new sequence.
We feel that student anxiety issues will be reduced by such a change. We intend to analyze this aspect further, by measuring student comfort levels and studying whether they improve over time.
We intend to continue studying changes over time for the senior Mar- keting Research students, because the present results for that class were mea- sured at the beginning of the curriculum
change. Reported skill levels should be higher for senior students who have had the new curriculum rather than the old one as a prerequisite.
REFERENCES
Benson, J. (1989). Structural components of sta- tistical test anxiety in adults: An exploratory
model.
zyxwvutsrqponmlkjihgfedcbaZYXWVUTSRQPONMLKJIHGFEDCBA
The Journal of Experimental Education,Cobb,
zyxwvutsrqponmlkjihgfedcbaZYXWVUTSRQPONMLKJIHGFEDCBA
G. (1993). Reconsidering statistics educa- tion: A National Science Foundation Conference.The Journal of Statistics Education,
zyxwvutsrqponmlkjihgfedcbaZYXWVUTSRQPONMLKJIHGFEDCBA
I( I), I .Fillebrown, S. (1994). Using projects in an elemen- tary statistics course for non-science majors. The
Journal of Statistics Education, 2(2). Retrieved
from
zyxwvutsrqponmlkjihgfedcbaZYXWVUTSRQPONMLKJIHGFEDCBA
http://www.amstat.org/publication/jse/Ganesh, G. K. (1992). The marketing research course as taught i n U.S. business schools. Jour-
nal of Marketing Education, 14(Spring), 22-34. Giesbrecht, N., Sell, Y., Scialfa, C., Sandals, L., &
Ehlers, P. (1997). Essential topics in introducto- ry statistics and methodology courses. Teaching
of Psychology, 24(4), 242-246.
Higgins. J. J., & Hogg, R. V. (1999). Special Sec- tion-Undergraduate statistics education: What should change? The American Statistician, 53(1). 1-28.
Hillmer,
zyxwvutsrqponmlkjihgfedcbaZYXWVUTSRQPONMLKJIHGFEDCBA
S . C. (1996). A problem-solving approach to teaching business statistics. TheAmerican Statistician, 50(3), 249-257. Hogg, R.V. (199 I). Statistical education:
Improvements are badly needed. The American
Statistician. 45, 342-343. 57(3), 247-261.
Holcomb, J. P., Jr., & Ruffer, R. L. (2000). Using a term-long project sequence in Introductory
Statistics. The American Statistician.
zyxwvutsrqponmlkjihgfedcbaZYXWVUTSRQPONMLKJIHGFEDCBA
54( I), 49-54.Kvanli, A. H., Pavur, R. J., & Guynes. C. S .
(2000). Introduction to business .statistics:
zyxwvutsrqponmlkjihgfedcbaZYXWVUTSRQPONMLKJIHGFEDCBA
Acomputer integrated approach (5th ed.). Cincin- nati: South-Western College Publishing. Ledolter, J. (1995). Projects in Introductory Sta-
tistics courses. The American Srutistician. 49, 364-368.
Lesser, L. M. (1998). Technology-rich standards- based statistics: Improving Introductory Statis- tics at the college level. TH.E. journal, Febru- ary, 54-58.
Parker, R. S., & Pettijohn, C. E. (1999). The nature and role of statistics in the business school curriculum. Journal of Education for
Business, 75(1), 51-55.
Rustdgi, N. K. (1997). A study of the retention of
basic quantitative skills. Journal
zyxwvutsrqponmlkjihgfedcbaZYXWVUTSRQPONMLKJIHGFEDCBA
of Education f o r Business, 73(2), 72-71.Strasser, S . E., & Osgur, C. (1995). Undergraduate business statistics: A survey of topics and teach- ing methods. Interfaces, 25(3), 95-103. Tabatabai, M., & Gamble, R. (1997). Business
statistics education: Content and software in undergraduate business statistics courses. Jour-
nal of Education for Business, 73( I ) , 48-54. Zanakis, S. H., & Valenzi, E. R. (1997). Student
anxiety and attitudes in business statistics.
Journal of Education .for Business. 73( 1 ),
10-17.
Zeidner, M. (1992). Statistics and mathematics anxiety in social science students: Some inter- esting parallels. British Journal qf Educational P.yychology, 61(3), 319-328.