Experimental Investigation of Seismic Parameters and Bearing Capacity of Pavement Subgrade Using Surface Wave Method
(Investigasi Eksperimen Parameter Seismik dan Daya Dukung Tanah Dasar Perkerasan Menggunakan Metode Gelombang Permukaan)
WAHYU WIDODO,SRI ATMAJA P.ROSYIDI
ABSTRACT
The spectral analysis of surface waves (SASW) method is introduced as an in-situ non-destructive seismic technique where the method consists of the generation, measurement and processing the dispersive Rayleigh waves from two vertical transducers. Subsequently, the dispersive data of Rayleigh phase velocity are inverted and the shear wave velocity versus depth of the site is obtained. The dynamic stiffness parameters, i.e. elastic modulus generated from the SASW measurements are at a very small strain levels of < 0.001%. At this strain level the soil is linearly elastic and the use of elastic theories is thus justified. The aim of this paper is to investigate the seismic parameters of the pavement subgrade stiffness using the SASW method and to predict its bearing capacity based on the seismic parameters. In order to determine the bearing capacity, in situ dynamic cone penetrometer (DCP) was also carried out in the same location of SASW test. The relationship of the shear wave velocity and dynamic elastic modulus (Edynamic) of the
SASW were found to be in good correlation with bearing capacity obtained by the DCP.
Keywords: method, soil stiffness, bearing capacity, shear wave velocity, elastic modulus structural capacity of the subgrade layer, accurate information of the elastic moduli and pavement construction, the soil test of dynamic cone penetrometer (DCP) is a common tool for measurement the soil stiffness of pavement subgrade layer. It is a simple test device that is inexpensive, portable, easy to operate, and easy to understand. It does not take extensive
experience to interpret results and several correlations to more widely known strength measurements have been published (Burnham & Johnson, 1993). The DCP quickly generates a continuous profile of in situ subgrade measurements.
well-known steady-state (Jones, 1958) technique. These applications include detection of soil profile, evaluation of concrete structures, detection of anomalies, detection of the structural layer of cement mortar, assessing compaction of fills and the evaluation of railway ballast. The purpose of this paper is to investigate the seismic parameters of soil dynamic and its relationship to the empirical bearing capacity (corresponding to DCP value) of the pavement subgrade using the Spectral Analysis of Surface Wave (SASW) method. Two national and state (province) roads in Yogyakarta, Indonesia are chosen as a case in this study.
EXPERIMENTAL SETUP
Field Measurement
An impact source on a pavement surface is used to generate R waves. These waves are
detected using two accelerometers of
piezoelectric DJB A/123/E model (Figure 1) where the signals are recorded using an analog digital recorder of Harmonie 01 dB (IEC 651-804 Type-I) and a notebook computer for post processing (Figure 2). Several configurations of the receiver and the source spacings are required in order to sample different depths
(Figure 3). The best configuration is the
midpoint receiver spacings (Heisey et
al.,1982). The range of wavelength to be used as a guide for the receiver spacing can be estimated from the shear wave velocities of the material anticipated at the site:
λ =
f
V
s(1)
where f is the frequency and VS is shear wave
velocity. The higher and low frequency wave groups needed can be generated by various transient sources of different weights and shapes (Rosyidi et al., 2002, Rosyidi, 2004, 2009).
In this study, the short receiver spacings of 4 and 8 cm with a high frequency source (ball bearing) are used to sample the asphaltic layers while the long receiver spacings of 16, 32 cm and 64, 100, 200 cm with a set of low frequencies sources (a set of hammers) are used to sample the base and subgrade layers, respectively (Figure 4). The SASW tests were carried out at two locations on Wonosari National Road (Piyungan to Gading) and Prambanan State Road (Prambanan to Pakem), Yogyakarta Province, Indonesia which 20 SASW measurements were conducted for each location.
FIGURE 2.Unit acquisition of SASW test
FIGURE 3. SA SW experimental set up
SUMBER: Rosyidi et al. (2005)
Data Analysis
1. Experimental dispersion curve
All the data collected from the recorder are transformed using the Fast Fourier Transform (FFT) to frequency domain by the dBFA32 software resident in the notebook computer. The phase spectrum in the frequency domain between the two receivers is of great importance in the data analysis. The phase data can be obtained from the cross-power spectrum or the transfer function spectrum. The spectrum consists of the relative phase shift between the two signals in the range of the frequencies being generated. However, in fact, during data collection, some noisy signals may interrupt the seismic data. It causes the phase spectrum pattern cannot be smooth looking. Figure 5 shows a typical set of the phase spectrum of the transfer function from the measurement from 4, 64 and 200 cm receiver spacings at the site. From Figure 5, it
is shown that the phase spectrum for 4 cm spacing is in good quality graph where the phase shift data between two sensors are not interrupted by noisy signals. However, for 64 and 200 cm, the noisy signals which is recognized as low frequency incoherent noisy interrupted to the phase data in the spectrum.
The experimental dispersion curve of phase velocity and wavelength is then developed from phase information of the unwrapped transfer function at the selected frequency range. In addition, most of researchers apply the filtering criteria (Heisey et al., 1982) with a wavelength greater than ½ and less than 3 receiver spacings. The time of travel between the receivers for each frequency can be calculated by:
f f f t
360
(2)
where f is the frequency,
t
f
and
f
are respectively the travel time and the phase difference in degrees at a given frequency. The distance of the receiver (d) is a knownand the corresponding wavelength, LR may be
written as:
By repeating the procedure outlined above and using equations (2) through (4) for each
frequency value, the R wave velocity
corresponding to each wavelength is evaluated and the experimental dispersion curve is subsequently generated. Figure 6 shows an example of the composite experimental dispersion curve from measurements of all the receiver spacings for Pakem-Prambanan and Wonosari road.
2. Inversion analysis
The actual shear wave velocity of the pavement profile is produced from the inversion of the composite experimental dispersion curve. In inversion process, a profile of a set of a homogeneous layer extending to infinity in the horizontal direction is assumed. The last layer is usually taken as a
homogeneous half-space. Based on the initial profile, a theoretical dispersion curve is then calculated using an automated forward modeling analysis of the 3 D dynamic stiffness matrix method (Kausel & Röesset, 1981). The theoretical dispersion curve is ultimately matched to the experimental dispersion curve of the lowest RMS error with an optimization technique called the “Maximum Likelihood Method” (Joh, 1996). Finally, the profile from the best-fitting (lowest RMS) of the theoretical dispersion curve to the experimental dispersion curve is used that represents the most likely pavement profile of the site. Detail procedure and equations used in SASW inversion analysis using the 3-D stiffness matrix was discussed in Rosyidi (2007). Figure 7 presents the example of final shear wave velocity profile obtained from the SASW measurement on the Prambanan-Pakem road. The final profile was generated from the best-fitting between the theoretical and experimental dispersion curve which the value of RMS error is found to be 25.37 m/s.
The dynamic elastic modulus of the pavement materials can then be easily determined from the following equation (Yoder &Witczak, 1975):
FIGURE 6.A typical dispersion curve from a complete set of SA SW tests on the flexible pavement show ing the
FIGURE 7.Final shear w ave velocity profile of Prambanan-Pakem road-pavement from the SASW measurement
Nazarian and Stokoe (1986) explained that the modulus parameter of material is maximum at a strain below about 0.001 %. In this strain range, modulus of the materials is also taken as constant. Figure 8 shows an example of the elastic modulus profile of Prambanan-Pakem road-pavement which is obtained from the shear wave velocity profile (Figure 7). The total unit weight of each pavement layer and Poisson’s ratio were assumed in reasonable values.
Dynamic Cone Penetrometer (DCP)
The DCP tests were conducted for determining the soil bearing capacity of the pavement subgrade on the same SASW measured centre points. The DCP uses a 8 kg steel mass falling 20 inches (50.8 cm) striking an anvil causing a penetration of 1.5 inches (3.8 cm) from a cone with a 60° vertex angle seated in the bottom of a hand augered hole. The blows required to drive the embedded cone a depth of 1-3/4 inches have been correlated to N values of the Standard Penetration Test (SPT). The DCP can be used effectively in augered holes to depths of 15 to 20 ft. (4.6 to 6.1 m). The depth of cone penetration is measured at selected penetration
or hammer-drop intervals, and the soil shear strength is reported in terms of DCP index. The DCP index (mm/blows) is based on the average penetration depth resulting from one blow of the 8 kg hammer. The readings of DCP are taken directly from the graduated steel rule attached to the instrument.
RESULTS A ND DISCUSSION
FIGURE 8.Final elastic modulus profile of Prambanan-Pakem road-pavement from the SASW measurement
TABLE 1.The average dynamic elastic and shear modulus of the subgrade layer
Subgrade Pavement Layer Dynamic Properties
Wonosari Road Prambanan Road
Dynamic Stiffness
Average Shear Wave Velocity (m/s) Average Elastic Modulus, E (MPa)
Range of E (MPa)
CV of E
SD of E (MPa)
284.77 208.46
111.7 – 355.89
0.31
64.55
212.42 180.64 (subgrade) 75.17 (natural soil)
101.6 – 295.2 (subgrade) 30.7 – 99.6 (natural soil)
0.33 (subgrade) 0.25 (natural soil)
59.58 (subgrade) 18.76 (natural soil)
Soil Subgrade Classification Poorly Graded Keprus
chalky limestone
Poorly Graded Clayey Sandy Soil
0
0.5
1
1.5
2
1 10 100 1000 10000
D
ep
th
(
m
)
Dynamic Elastic Modulus (MPa)
Surface course Base course
Subbase course
1 2 3 4 5 6 7 8 9 10 Subgrade layer 207.710 224.919 209.181 173.055 293.802 224.785 174.537 192.251 179.012 205.326
0
FIGURE 7. Average dynamic elastic modulus of pavement profiles at Wonosari Road
1 2 3 4 5 6 7 8 9 10
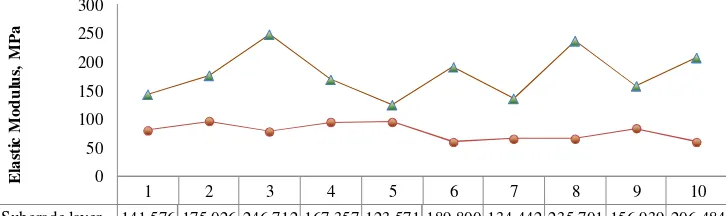
Subgrade layer 141.576 175.026 246.712 167.357 123.571 189.800 134.442 235.701 156.939 206.484
natural soil layer 80.207 95.649 77.680 93.257 94.815 59.356 64.154 65.039 82.381 59.2630 0
FIGURE 8. Average dynamic elastic modulus of pavement profiles at Prambanan Road
The shear wave velocities and their
corresponding shear modulus from this study are listed in Table 2 in comparison with the results of SASW testing obtained by other researcher (Nazarian & Stokoe, 1986). In general, the shear wave velocity values of the subgrade at Wonosari and Prambanan-road are in reasonable agreement with the result of a chalky lime stone and loose sandy soil subgrade layer from the study obtained by Anderson and Thitimakorn (2004), and Nazarian and Stokoe (1986), respectively which is described in Table 2.
The shear wave velocities from the SASW are then correlated to the DCP value for the Rosyidi (2004) which were written as:
DCP = 45,668 (VS)-1.58 (7) coefficients of determination obtained (Figure 9) indicate that the empirical equation derived between the shear wave velocities have significant correlations with the DCP. The average values of the DCP index of the pavement subgrade at each of the SASW measurement point can be calculated as shown in Figure 10. The result shows that the soil bearing capacity which is represented by the DCP index can be obtained from the seismic
parameter (shear wave velocity and
TABLE 2. Comparison of shear w ave velocity on subgrade layers
Parameter This study Other Studies
Shear wave velocity, VS
(m/s)
Wonosari road:
111.7 – 355.89 m/s (keprus chalky limestone) Prambanan road:
101.6 – 295.2 (subgrade: dense sandy soil) 30.7 – 99.6 (loose sandy soil)
Anderson & Thitimakorn (2004): > 280.42 m/s (limestone)
Nazarian & Stokoe (1986): 147.5 – 211.9 m/s (sandy soil)
FIGURE 9. Correlation betw een the shear wave velocity and DCP for the subgrade layer
1 2 3 4 5 6 7 8 9 10
Wonosari Roa d 9.95 8.78 9.84 13.28 5.76 8.79 13.10 11.25 12.59 10.14
Pramba nan Road (subgrade) 20.212 15.769 7.710 17.270 23.366 13.423 21.431 8.447 19.032 11.593817
Pra mbanan Roa d (natura l soil) 45.174 33.937 48.307 35.338 34.387 88.129 80.792 65.455 44.227 89.912777
1.00 10.00 100.00
D
C
P
in
d
ex
, m
m
/b
lo
w
FIGURE 10. Average bearing capacity calculated from empirical model of elastic modulus versus the DCP index
proposed by Rosyidi (2004) for Wonosari and Prambanan Road DCP = 45668(VS)
- 1.58
R2 = 0.94
0 10 20 30 40 50 60
0 100 200 300 400
V s, m/s
D
C
P
,
m
m
/b
lo
w
s Subgrade
Course
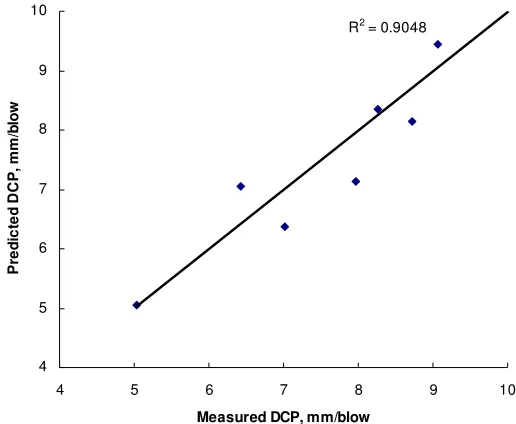
FIGURE 11. Comparison betw een DCP values from predicted DCP from Rosyidi’ s (2004) empirical equations and field measurement at Prambanan Road
For validate the derived equation in this study, Figure 11 also shows a correlation between the predicted DCP values using Equation 7 from SASW measurement and the DCP values from the field measurement at several locations on State Road, Prambanan – Pakem, Indonesia. The result is in good agreement with determination coefficient, R2 = 0.91.
CONCLUSIONS
Good agreements were obtained between the measured shear wave velocities and the corresponding dynamic elastic of the soil subgrade from this study as compared to other works. This study has also investigated to the soil bearing capacity obtained by seismic parameter based on Rosyidi’s (2004) empirical model. An excellent correlation between the shear wave velocity and the DCP index measured for subgrade layers was obtained from this study. Based on this experimental study, it can be concluded that the SASW method is able to predict the soil stiffness of the pavement subgrade layer in terms of shear wave velocity and its corresponding dynamic elastic modulus satisfactorily for the propose of pavement evaluation.
ACKNOWLEDGEMENTS
The authors would like to give our sincere appreciation to the Ministry of National Education of Indonesia for supporting this research through the Dosen Muda Grant of 2007 and laboratory facilities from Faculty of Engineering, Universiti Kebangsaan Malaysia and University of Muhammadiyah Yogyakarta.
REFERENCES
Anderson, N. & Thitimakorn, T. (2004). A 2-D MASW shear-wave velocity profile along a test segment of Interstate I-70, St. Louis, Missouri. Final Report RDT
04-012 Missouri Department of
Transportation Research, Development and Technology, Missouri
Heisey, J.S., Stokoe II, K.H., and Meyer, A.H. (1982). Moduli of pavement systems from spectral analysis of surface waves.
Transportation Research Record (TRB), 852, 22-31.
Joh, S.H. (1996). Advance in interpretation & analysis technique for spectral analysis
of surface wave (SASW) measurements.
Jones, R.B. (1958). In-situ measurement of the dynamic properties of soil by vibration methods. Geotechnique, 8(1), 1-21.
Kausel, E. & Röesset, J.M. (1981). Stiffness matrices for layered soils. Bulletin of the Seismological Society of America, 71(6), 1743-1761.
Nazarian, S. & Stokoe, K.H.II. (1986). In situ determination of elastic moduli of pavement systems by
spectral-analysis-of-surface-wave method (theoretical
aspects). Research Report 437-2. Center of Transportation Research. Bureau of Engineering Research. The University of Texas at Austin.
Rosyidi, S.A. (2004). Evaluation of the dynamic stiffness of pavement layer using sasw method. Master of Science Thesis, Universiti Kebangsaan Malaysia.
Rosyidi, S.A. (2007). Comparison between 2-D and 3-2-D stiffness matrix model simulation of SASW inversion for pavement structure. Civil Engineering Dimension, 9(1), 42–48.
Rosyidi, S.A. (2009). Wavelet analysis of surface wave for evaluation of soil
dynamic properties. Ph.D. Thesis,
Universiti Kebangsaan Malaysia.
Rosyidi, S.A., Nayan, K.A.M., Taha, M.R., &
Mustafa, M.M. (2002). The
measurement of dynamic properties of
flexible pavement using
Spectral-Analysis-of-Surface-Wave (SASW).
Proceeding of Inter-University
Transportation Studies ForumV (FSTPT
V) Symposium, University of Indonesia, Jakarta.
Rosyidi, S.A., Taha, M.R. & Nayan, K.A.M. (2005). Assessing in situ dynamic stiffness of pavement layers with simple seismic test, Proceeding of International Seminar and Exhibition on Road
Constructions: Construct high
durability, easy and economical on maintenance of road construction, 3, 15-26.
Yoder, E.J. & Witczak, M.W. (1975).
Principles of pavement design. New
York: John Wiley & Son, Inc.
PENULIS:
Wahyu Widodo, Sri Atmaja P. Rosyidi
Jurusan Teknik Sipil, Fakultas Teknik, Universitas Muhammadiyah Yogyakarta. Jalan Lingkar Selatan, Bantul, Yogyakarta, Indonesia.
Email: [email protected]
Diskusi untuk makalah ini dibuka hingga 1 April 2010 dan akan diterbitkan dalam jurnal edisi Mei 2010.