1 For more information contact: The Secretariat for GoI-UNICEF Programme Cooperation at 62-21-57942109 or
Directorate People Welfare Statistics, BPS at 62-21-3841195 ext. 4210 Multiple Indicator Cluster Survey
The Multiple Indicator Cluster Survey is an international household survey programme developed by UNICEF to assist countries fill data gaps for monitoring human development in general and the situation of children and women in particular. MICS provides countries with the opportunity to monitor progress toward national goals and global commitments, including the Millennium Development Goals (MDGs) as the target year 2015 approaches. MICS helps countries capture rapid changes in key indicators and expand the evidence-base for policies and programmes. MICS also continues to address emerging issues and new areas of interest, with validated, standard methodologies in collecting relevant data.
Badan Pusat Statistik (BPS) under the leadership of Bappenas and Bangda and with technical and financial support from UNICEF conducted MICS, as part of the fourth global round of MICS surveys in six selected districts in Papua and Papua Barat provinces in 2011.
Multiple Indicator Cluster Survey
Selected Districts of Papua and Papua Barat
Key Preliminary Findings
Dissemination Seminar November 2012
The 2011 Multiple Indicator Cluster Survey in Selected Districts of Papua and Papua Barat
The 2011 Multiple Indicator Cluster Survey (MICS) in selected Districts of Papua and West Papua was conducted from October to December 2011. It had as its primary objectives:
• To provide up-to-date information for assessing the situation of children and women in six selected districts of Papua and Papua Barat provinces;
• To furnish data needed for monitoring progress toward district and provincial development plan targets as a basis for future action;
• To contribute to the improvement of data and monitoring systems in Indonesia and to strengthen technical expertise in the design, implementation, and analysis of such systems; • To generate data on the situation of children and women,
including the identification of vulnerable groups and of disparities, to inform policies and interventions.
Sample Design
The sample for the 2011 MICS in selected districts of Papua and Papua Barat provinces was designed to provide estimates for a large number of indicators on the situation of children and women at the district level. The six districts of Merauke, Jayawijaya, Biak Numfor (Papua) and Kaimana, Manokwari Sorong (Papua Barat) were included in this survey. The sample was selected in two stages. Within each district, a specified
number of census enumeration areas were selected
2
MDGs Goal 1
ERADICATE EXTREME POVERTY AND HUNGER
Target 1C: Half, between 1990 and 2015, the proportion of people who suffer from hunger
Low Birth Weight (LBW)
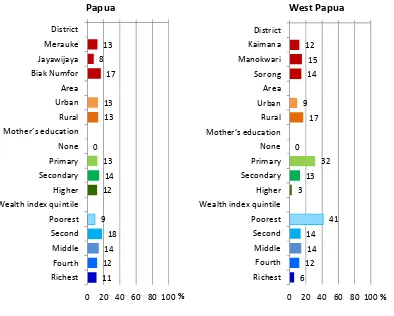
Weight at birth is a good indicator not only of a mother's health and nutritional status but also the newborn's chances for survival, growth, long-term health and psychosocial development. Low birth weight (less than 2,500 grams) carries a range of grave health risks for children. Babies who were undernourished in the womb face a greatly increased risk of dying during their early months and years. Those who survive have impaired immune function and increased risk of disease; they are likely to remain undernourished, with reduced muscle strength, throughout their lives, and suffer a higher incidence of diabetes and heart disease in later life. Children born underweight also tend to have a lower IQ and cognitive disabilities, affecting their performance in school and their job opportunities as adults. For the Selected Districts of Papua and West Papua 2011 MICS, information on mother’s assessment of the child’s size at birth was not collected. Therefore reporting of percentage of births weighing below 2500 grams is only based on the mother’s recall of the child’s weight or the weight as recorded on a health card if the child was weighed at birth.
Overall, in the six districts 28 to 71 percent of births were weighed at birth with approximately 8 to 17 percent of infants estimated to weigh less than 2500 grams at birth.
Figure 1. Low birth weight infants by different background characteristics
13 8
17
13 13
0 13
14 12
9 18 14 12 11
0 20 40 60 80 100 District
Merauke Jayawijaya Biak Numfor Area Urban Rural Mother’s education None Primary Secondary Higher Wealth index quintile Poorest Second Middle Fourth Richest
Papua
%
12 15 14
9 17
0 32 13 3
41 14 14 12 6
0 20 40 60 80 100 District
Kaimana Manokwari Sorong Area Urban Rural Mother’s education None Primary Secondary Higher Wealth index quintile Poorest Second Middle Fourth Richest
West Papua
3 In the developing world, low birth weight stems primarily from the mother's poor health and nutrition. Three factors have most impact: the mother's poor nutritional status before conception, short stature (due mostly to under nutrition and infections during her childhood), and poor nutrition during the pregnancy. Inadequate weight gain during pregnancy is particularly important since it accounts for a large proportion of foetal growth retardation. Moreover, diseases such as diarrhoea and malaria, which are common in many developing countries, can significantly impair foetal growth if the mother becomes infected while pregnant.
According to background characteristics, the difference in urban and rural areas is only valid in the 3 districts of West Papua, where the rate of low birth weight in rural areas is higher. Similarly, children with low birth weight in West Papua less likely in women with higher education. But the mother's education did not show much difference in LBW in 3 districts of Papua province. The poorer mothers in 3 districts of West Papua tend to have low birth weight infants. The same trend occurred in the 3 districts of Papua province, although the disparity is not as wide as in West Papua.
Breastfeeding
Breastfeeding for the first few years of life protects children from infection, provides an ideal source of nutrients, and is economical and safe. However, many mothers stop breastfeeding too soon and there are often pressures to switch to infant formula, which can contribute to growth faltering and micronutrient malnutrition and is unsafe if clean water is not readily available. WHO/UNICEF have the following feeding recommendations:
Exclusive breastfeeding for first six months
Continued breastfeeding for two years or more
Safe, appropriate and adequate complementary foods beginning at 6 months
Frequency of complementary feeding: 2 times per day for 6-8 month olds; 3 times per day for 9-11 month olds
It is also recommended that breastfeeding be initiated within one hour of birth. The key indicators related to recommended child feeding practices that will be presented here are as follows:
Early initiation of breastfeeding (within 1 hour of birth) Exclusive breastfeeding rate (< 6 months)
Continued breastfeeding rate (at 1 year and at 2 years) Bottle feeding (0-23 months)
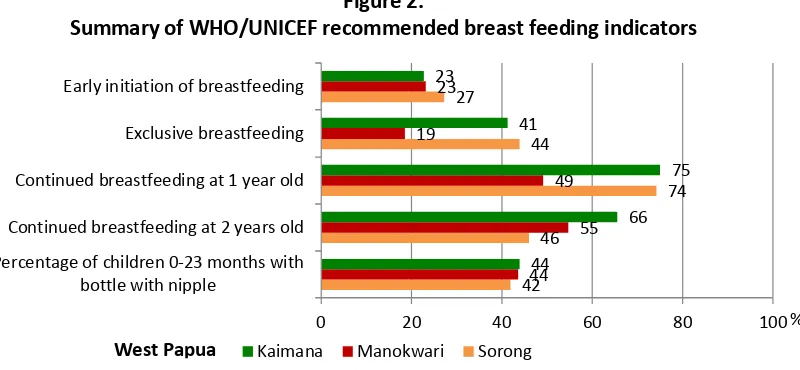
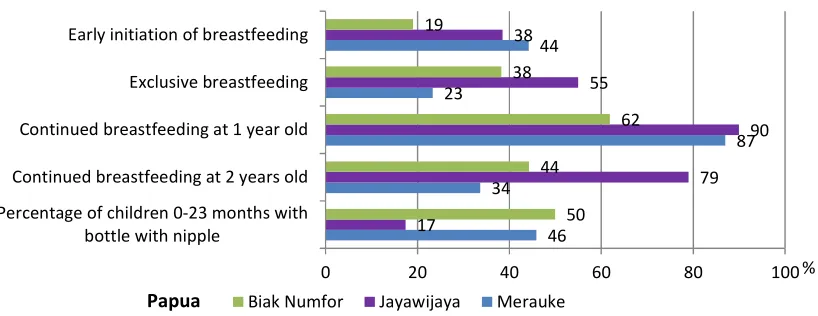
Figure 2.
Summary of WHO/UNICEF recommended breast feeding indicators
42 46
74 44
27
44 55 49 19
23
44
66 75 41
23
0 20 40 60 80 100
Percentage of children 0-23 months with bottle with nipple
Continued breastfeeding at 2 years old Continued breastfeeding at 1 year old Exclusive breastfeeding Early initiation of breastfeeding
Kaimana Manokwari Sorong
4 Women differed in the timing of initial breastfeeding according to districts, particularly when considering initiation of breastfeeding within one day of birth. Women in Kaimana were the least likely to start breastfeeding within one day (45 percent) compared to women in Jayawijaya (86 percent), Biak Numfor (70 percent), and Manokwari (69 percent). Breastfeeding within one hour was highest in Merauke district (44 percent) than the lowest in Biak Numfor (19 percent)
Figure 3. Percentage of mothers who started breastfeeding within one hour by background characteristic
Children born in private hospitals were likely to be initially breastfed appropriately within one hour compared to those born in public hospitals and those born at home. Skilled birth also seemed quite influential in encouraging breastfeeding within the first hour after birth. Urban/rural area and wealth index quintile do not show much difference in terms of early breastfeeding.
46
Percentage of children 0-23 months with bottle with nipple
Continued breastfeeding at 2 years old Continued breastfeeding at 1 year old Exclusive breastfeeding Early initiation of breastfeeding
Biak Numfor Jayawijaya Merauke
5
MDGs Goal 2 and 3
ACHIEVE UNIVERSAL PRIMARY EDUCATION
PROMOTE GENDER EQUALITY AND EMPOWER WOMEN
Target 2A: Ensure that, by 2015, children everywhere, boys and girls alike, will be able to complete full course of primary schooling
Target 3A: Eliminate gender disparity in primary and secondary education, preferably by 2005, and in all levels of education no later than 2015
Universal access to basic education and the achievement of primary education by the world’s children is one of the most important goals of the Millennium Development Goals and A World Fit for Children. Education is a vital prerequisite for combating poverty, empowering women, protecting children from hazardous and exploitative labour and sexual exploitation, promoting human rights and democracy, protecting the environment, and influencing population growth.
The key indicators for education include: • Net intake rate in primary education
• Primary school net attendance ratio (adjusted) • Secondary school net attendance ratio (adjusted)
• Litteracy/Illiteracy rate among young women/men age 15-2 years
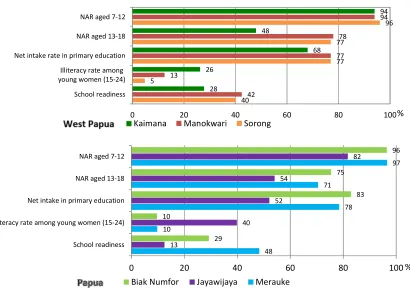
• Female to male education ratio (or gender parity index - GPI) in primary and secondary school Of children who are of primary school entry age (age 7) in the six selected districts of Papua and West Papua, attendance in grade 1 of primary school is highest in Biak Numfor district (83 percent) compared to the lowest percentage in Jayawijaya (52 percent).
40 5
77 77
96
42 13
77 78
94
28 26
68 48
94
0 20 40 60 80 100
School readiness Illiteracy rate among young women (15-24) Net intake rate in primary education NAR aged 13-18 NAR aged 7-12
Figure 4. Summary of education indicators
Kaimana Manokwari Sorong
48 10
78 71
97
13
40 52
54
82
29 10
83 75
96
0 20 40 60 80 100
School readiness Illiteracy rate among young women (15-24) Net intake in primary education NAR aged 13-18 NAR aged 7-12
Biak Numfor Jayawijaya Merauke
%
6 More than 90 percent of children of primary school age are attending school, except in Jayawijaya (82 percent). However, three to six percent of the children are out of school when they are expected to be participating in school. Ranged at 48 - 78 percent of children of secondary school age (13 to 18 years) in six selected districts is attending secondary school. Of the remaining, some of them are either out of school or still attending primary school. The secondary school net attendance ratio in Kaimana is the lowest and shows a striking 52 percent of children of secondary school age who are out of secondary school with 24 percent of the children still in primary school while 28 percent are out of school.
Figure 5. Percentage of secondary school NAR, secondary school age children attending primary school and secondary school children out of school
In MICS, literacy was assessed on the ability of women and men age 15-24 years to read a short simple statement or on school attendance. MICS Papua and West Papua indicates that only 60 percent of women age 15-24 in Jayawijaya districts are literate, the least compared to other five selected districts. Women literacy is better than men literacy in Kaimana and Sorong.
Figure 6. Literacy Rate by Gender
90
60
90 92
72
92
0 20 40 60 80 100
Biak Numfor Jayawijaya Merauke
women aged 15-24 men aged 15-24 75%
54% 71%
8%
7%
6% 16%
39% 23%
0% 20% 40% 60% 80% 100%
Biak Numfor Jayawijaya Merauke
In secondary school (NAR) In primary school Out of School 48%
78% 77%
24%
7% 9%
28% 16% 13%
0% 20% 40% 60% 80% 100%
Kaimana Manokwari Sorong
74
87 95
73
89 90
0 20 40 60 80 100
Kaimana Manokwari Sorong
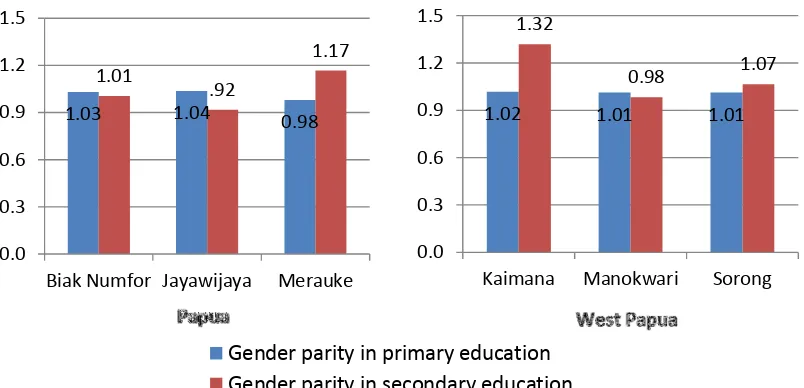
7 Figure 7. Education Gender Parity Index
The ratio of girls to boys attending primary and secondary education is better known as the Gender Parity Index (GPI). Notice that the ratios included here are obtained from net attendance ratios rather than gross attendance ratios. The last ratios provide an erroneous description of the GPI mainly because in most of the cases the majority of over-aged children attending primary education tend to be boys. The figure shows that gender parity for primary school, which is not far from 1, is indicating that girls and boys are almost equal in attending primary school (Mearuke 0.98; Jayawijaya 1.05; Biak Numfor 1.14; Manokwari 1.02; Sorong 1.01; Kaimana 1.01). The gender parity for secondary school shows the same situation, except for Merauke and Kaimana which are slightly higher.
1.02 1.01 1.01
1.32
0.98 1.07
0.0 0.3 0.6 0.9 1.2 1.5
Kaimana Manokwari Sorong
Gender parity in primary education Gender parity in secondary education
1.03 1.04 0.98
1.01
.92
1.17
0.0 0.3 0.6 0.9 1.2 1.5
8
MDGs Goal 4
REDUCE CHILD MORTALITY
Target 4A: Reduce by two thirds, between 1990 and 2015, the under-five mortality rate
It is one of the overarching goals of the Millennium Development Goals (MDGs). Monitoring progress towards this goal is an important but difficult objective. The infant mortality rate is the probability of dying before the first birthday. The under-five mortality rate is the probability of dying before the fifth birthday.
In MICS surveys, infant and under five mortality rates are calculated based on an indirect estimation technique known as the Brass method. The data used in the estimation are: the mean number of children ever born for five year age groups of women from age 15 to 49, and the proportion of these children who are dead, also for five-year age groups of women. Based on previous information on mortality in Indonesia, the West model life table was selected as most appropriate. It should be noted that the infant and child mortality estimates presented in the report are based on relatively small numbers of cases which can lead to unstable estimates. Therefore interpretation of these estimated should be interpreted with caution.
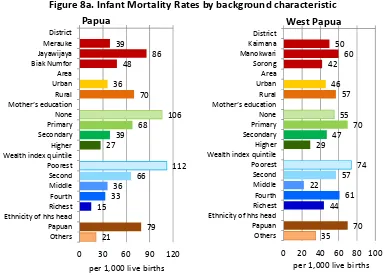
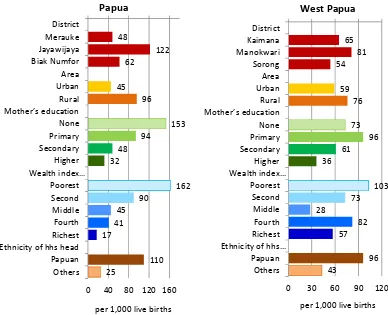
The infant mortality rates in Papua are estimated at 39, 86, and 48 per thousand live births in the districts of Merauke, Jayawijaya, and Biak Numfor districts respectively. The probabilities of dying under age 5 (U5MR) are 48, 122, and 62 per thousand live births in the districts of Merauke, Jayawijaya, and Biak Numfor districts respectively. Meanwhile, the infant mortality rates in West Papua are estimated at 50, 60 and 42 per thousand live births in the districts of Kaimana, Manokwari and Sorong districts respectively. The probabilities of dying under age 5 (U5MR) are 65, 81 and 54 per thousand live births in the districts of Kaimana, Manokwari and Sorong districts respectively.
Figure 8a. Infant Mortality Rates by background characteristic
39 Wealth index quintile Poorest Second Middle Fourth Richest Ethnicity of hhs head Papuan Others
per 1,000 live births Papua Wealth index quintile Poorest Second Middle Fourth Richest Ethnicity of hhs head Papuan Others
9 Figure 8b. Under-five Mortality Rates by background characteristic
These estimates have been calculated by averaging mortality estimates obtained from women age 25-29 and 30-34, and refer roughly to 2006. These mortality estimates show clear disadvantage in Manokwari district compared to Kaimana and Sorong, and Jayawijaya district compared to Merauke and Biak Numfor.
For the combined three districts in each province, there is some difference between the probabilities of dying in terms of area of residence, educational levels, wealth and ethnicity. Mortality rates are approximately double in rural areas compared to urban. As expected, sharp negative association between mortality and education is observed. Similarly under-five mortality rate decreased sharply from above 100 per thousand among children living in the poorest household to below 60 per thousand among those living in the richest households. Mortality was considerably greater among children whose household heads are Papuan compared to others.
48
122 62
45 96
153 94
48 32
162 90
45 41 17
110 25
0 40 80 120 160 District
Merauke Jayawijaya Biak Numfor Area Urban Rural Mother’s education None Primary Secondary Higher Wealth index…
Poorest Second Middle Fourth Richest Ethnicity of hhs head Papuan Others
per 1,000 live births Papua
65 81 54
59 76 73
96 61 36
103 73 28
82 57
96 43
0 30 60 90 120
District Kaimana Manokwari Sorong Area Urban Rural Mother’s education None Primary Secondary Higher Wealth index…
Poorest Second Middle Fourth Richest Ethnicity of hhs…
Papuan Others
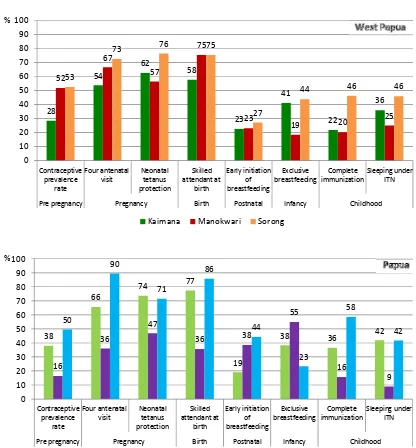
10 Continuum of care
The concept of “continuum care” promotes cost effective interventions on care for mothers and children from pre-pregnancy, birth and post-neonatal period to childhood. On the other hand it also promotes care for mothers and children from community level care to clinical.
Figure 9. Continuum of Care from pre-pregnancy to childhood
28
Pre pregnancy Pregnancy Birth Postnatal Infancy Childhood
Kaimana Manokwari Sorong
38
Pre pregnancy Pregnancy Birth Postnatal Infancy Childhood
Biak Numfor Jayawijaya Merauke %
11 Immunization
Immunization plays a key part in reducing under-five and infant mortality. Immunizations have saved the lives of millions of children in the three decades since the launch of the Expanded Programme on Immunization (EPI) in 1974. Worldwide there are still 27 million children overlooked by routine immunization and as a result, vaccine-preventable diseases cause more than 2 million deaths every year. According to UNICEF and WHO guidelines, a child should receive a BCG vaccination to protect against tuberculosis, three doses of DPT to protect against diphtheria, pertussis, and tetanus, three doses of polio vaccine, and a measles vaccination by the age of 12 months. According to the national immunization schedule, by a first birthday each child in Indonesia should receive through routine immunization - a BCG vaccination to protect against tuberculosis, three doses of DPT to protect against Diphtheria, Pertussis, and Tetanus, four doses of polio vaccine, four doses of Hepatitis B vaccine and a measles or MMR vaccination at the age of 9 months or older. Taking into consideration this vaccination schedule, the estimates for full immunization coverage from the Selected Districts of Papua and West Papua MICS are based on children age 12-23 months.
Out of all selected districts, the survey results show that Jayawijaya district tended to have low coverage for most of the vaccinations with full vaccination coverage of only 16 percent, while the lowest coverage in West Papua is Kaimana (22 percent). The highest full vaccination coverage is in Merauke district of Papua, and Sorong district of West Papua which are 58 and 46 percent respectively.
Figure 10. Complete vaccination by background characteristic
For the combined three districts in each province, children age 12-23 months who live in urban area are more likely fully immunized than those who live in rural area. In 3 districts of Papua, mother’s education and wealth index quintile much make a difference in the acquisition of full vaccination, rather than in 3 districts of West Papua.
58 16
37 49 32 9
28 47
53 4
37 41
49 63 - 20 40 60 80 100 District
Merauke Jayawijaya Biak Numfor Area Urban Rural Mother’s education None Primary Secondary Higher Wealth index quintile Poorest Second Middle Fourth Richest
Papua
%
22 20
46 46 20
26 28
7 28
33 26
50 0 20 40 60 80 100 District
Kaimana Manokwari Sorong Area Urban Rural Mother’s education None Primary Secondary Higher Wealth index quintile Poorest Second Middle Fourth Richest
West Papua
12 Neonatal Tetanus Protection
One of the MDGs is to reduce by three quarters the maternal mortality ratio, with one strategy to eliminate maternal tetanus. In addition, another goal is to reduce the incidence of neonatal tetanus to less than 1 case of neonatal tetanus per 1000 live births in every district. A World Fit for Children goal is to eliminate maternal and neonatal tetanus by 2005.
Prevention of maternal and neonatal tetanus is to assure all pregnant women receive at least two doses of tetanus toxoid vaccine. However, if women have not received two doses of the vaccine during the pregnancy, they (and their newborn) are also considered to be protected if the following conditions are met:
• Received at least two doses of tetanus toxoid vaccine, the last within the prior 3 years; • Received at least 3 doses, the last within the prior 5 years;
• Received at least 4 doses, the last within 10 years; • Received at least 5 doses during lifetime.
The results of the survey indicate that tetanus toxoid coverage in the six selected districts of Papua and West Papua is at 47 percent in Jayawijaya district, the least compared to Kaimana (62 percent), Merauke (71 percent), Biak Numfor (74 percent), and the highest is Sorong district (76 percent).
Malaria
Malaria is a leading cause of death of children under age five in Papua and West Papua. It also contributes to anaemia in children and is a common cause of school absenteeism. Preventive measures can dramatically reduce malaria mortality rates among children.
In areas where malaria is common, the WHO recommends Indoor Residual Spraying (IRS), use of insecticide treated bednets (ITNs) and prompt treatment of confirmed cases with recommended anti-malarial drugs. International recommendations also suggest treating any fever in children as if it were malaria and immediately giving the child a full course of recommended anti-malarial tablets. Children with severe malaria symptoms, such as fever or convulsions, should be taken to a health facility. Also, children recovering from malaria should be given extra liquids and food and, for younger children, should continue breastfeeding.
Insecticide-treated mosquito nets, or ITNs, if used properly, are very effective in offering protection against mosquitoes and other insects. The questionnaire incorporates questions on the availability and use of bed nets, both at household level and among children under five years of age and pregnant women.
13
MDGs Target 5
IMPROVE MATERNAL HEALTH
Target 5A: Reduce by three quarters, between 1990 and 2015, the maternal mortality ratio Target 5B: Achieve by 2015, universal access to reproductive health
Investment in reproductive health, including family planning and maternal care are essential for meeting the MDGs goals. Complications during pregnancy and childbirth are the leading causes of death and disability among women and reproductive age in developing countries. Three quarters of all maternal deaths occurs during birth and immediately after delivery to six weeks.
Figure 11. Summary of Reproductive and Maternal Health Indicators
33 care at leas
once (%)
Kaimana Manokwari Sorong
66 rate (per 1,000
female
West Papua
43 care at leas
once (%)
Biak Numfor Jayawijaya Merauke
59 rate (per 1,000
14 Adolescent Birth Rate
In MICS4, adolescent birth rates and total fertility rates are calculated by using information on the date of last birth of each woman and based on one-year period (1-12 months) preceding the survey. Rates are underestimated by a very small margin due to absence of information on multiple births (twins, triplets, etc.) and on women having multiple deliveries during one year prior to the survey. The adolescent birth rate (age-specific fertility rate for women age 15-19) is defined as the number of births to women age 15-19 years during the one year period preceding the survey, divided by the average number of women age 15-19 (number of women-years lived between ages 15 through 19, inclusive) during the same period, expressed per 1000 women age 15-19 years.
The adolescent birth rate (Age-specific fertility rate for women age 15-19) is varied among six selected districts. The adolescent birth rate is higher in Kaimana district (66 births per 1,000 women) compared to the rates in Sorong (53 births per 1,000 women) and Manokwari (44 births per 1,000 women) in West Papua province. However, the highest adolescent birth rate is in Jayawijaya district (145 births per 1,000 women), while the other two districts in Papua province also show high rate, Merauke (77 births per 1,000 women) and Biak Numfor (59 births per 1,000 women).
Sexual activity and childbearing early in life carry significant risks for young people all around the world. Around 11 to 37 percent of women aged 20-24 years gave birth before reaching 18 years of age. The percentage of giving birth before age 18 for this age group did not vary much among districts (Biak Numfor, 10 percent; Merauke, 11 percent; Kaimana, 16 percent; Manokwari, 15 percent; and Sorong, 17 percent,), except in Jayawijaya which show the highest rate (37 percent).
Contraception
Appropriate family planning is important to the health of women and children by: 1) preventing pregnancies that are too early or too late; 2) extending the period between births; and 3) limiting the number of children. Access by all couples to information and services to prevent pregnancies that are too early, too closely spaced, too late or too many is critical.
Current use of contraception in the three selected districts of Papua and West Papua was reported that the lowest current use was seen in Jayawijaya district (16 percent), mostly modern methods, compared to 38 percent in Biak Numfor and 50 percent in Merauke district of Papua province. It is even worse than Kaimana district (28 percent) in West Papua province, while the highest is in Manokwari (52 percent) and Sorong (53 percent) where women mostly also using modern method.
Antenatal Care
The antenatal period presents important opportunities for reaching pregnant women with a number of interventions that may be vital to their health and well-being and that of their infants. Better understanding of foetal growth and development and its relationship to the mother's health has resulted in increased attention to the potential of antenatal care as an intervention to improve both maternal and new-born health.
15 antenatal care at least four times, the lowest is in Jayawijaya (36 percent), followed respectively by Kaimana (54 percent), Biak Numfor (66 percent), Manokwari (67 percent), Sorong (73 percent), and the highest is in Merauke (90 percent).
Assistance at Delivery
Three quarters of all maternal deaths occur during delivery and the immediate post-partum period. The single most critical intervention for safe motherhood is to ensure a competent health worker with midwifery skills is present at every birth, and transport is available to a referral facility for obstetric care in case of emergency. A World Fit for Children goal is to ensure that women have ready and affordable access to skilled attendance at delivery. The indicators are the proportion of births with a skilled attendant and proportion of institutional deliveries. The skilled attendant at delivery indicator is also used to track progress toward the Millennium Development target of reducing the maternal mortality ratio. The MICS included a number of questions to assess the proportion of births attended by a skilled attendant which includes a doctor, nurse or midwife. The lowest percentage of women who were delivered by skilled personnel is in Jayawijaya (36 percent), and the highest is in Merauke (86 percent). Among them, respectively is Kaimana (58 percent), Manokwari and Sorong (75 percent each), Biak Numfor (77 percent).
Figure 12. Percent distribution of women age 15-49 who had a live birth in the two years preceding the survey by person assisting at delivery
8
40
11
26
1
15
1 0
29
43
3 4 0
14
6 1
18
52
5 11
0
13
1 0
0 20 40 60 80 100
Doctor Midwife Nurse TBA Health
cadre
Friend/ family
Other/ no answer
No assistance Kaimana Manokwari Sorong
17
56
4 7 9 6 0 0
13 18
4 2 1
53
1 7
21
64
1 9 1 4 1 0
0 20 40 60 80 100
Doctor Midwife Nurse TBA Health
cadre
Friend/ family
Other/ no answer
No assistance Biak Numfor Jayawijaya Merauke
Papua West Papua %
16 These deliveries were mostly assisted by midwives. Delivery by skilled personnel is highest among women who delivered in public and private sector health facilities (100 percent each) than among women who delivered at home (54 percent). Rural, uneducated, poorest women and women from households with Papuan heads are less likely to be delivered by skilled personnel.
Place of Delivery
Increasing the proportion of births that are delivered in health facilities is an important factor in reducing the health risks to both the mother and the baby. Proper medical attention and hygienic conditions during delivery can reduce the risks of complications and infection that can cause morbidity and mortality to either the mother or the baby.
The following figure presents the distribution of women age 15-49 that had a live birth in the two years preceding the survey by place of delivery. Except in Manokwari and Merauke districts, home is still dominant as place of birth delivery. About 22 to 61 percent of births in the six selected districts of Papua and West Papua are delivered in a health facility. The percentages of women who were delivered in a health facility were 22, 28, 33, 43, 54 and 61 percent in Sorong, Jayawijaya, Kaimana, Biak Numfor, Manokwari, and Merauke districts respectively.
Figure 13. The percentages of women who were delivered in a health facility, public and private, by background characteristic
In all selected districts in, both in Papua and West Papua provinces, women who live in urban area, who have higher education, who are non-Papuan and are wealthier tend to deliver in public or private health facilities.
61 Wealth index quintile Poorest Second Middle Fourth Richest Ethnicity of hhs head Papuan Wealth index quintile Poorest Second Middle Fourth Richest Ethnicity of hhs head Papuan Others
17
MDGs Goal 6
COMBAT HIV/AIDS, MALARIA AND OTHER DISEASES
Target 6A: Have halted by 2015 and begun to reverse the spread of HIV/AIDS
Target 6C: Have halted by 2015 and begun to reverse the incidence of malaria and other major diseases
The indicators to measure this goal as well as the MDG of reducing HIV infections by half include improving the level of knowledge of HIV and its prevention, and changing behaviours to prevent further spread of the disease.
Comprehensive Knowledge about HIV Transmission
One of the most important prerequisites for reducing the rate of HIV infection is accurate knowledge of how HIV is transmitted and strategies for preventing transmission. Correct information is the first step towards raising awareness and giving young people the tools to protect them from infection. One indicator which is both an MDG and UNGASS indicator is the percent of young women who have comprehensive and correct knowledge of HIV prevention and transmission. In MICS conducted in three districts in Papua all women who have heard of AIDS were asked whether they knew of the two main ways of preventing HIV transmission – having only one faithful uninfected partner and using a condom every time.
In the six selected districts of Papua and West Papua, more than 60 percent of the interviewed women have heard of AIDS with clear differentials among districts (Jayawijaya, 63 percent; Kaimana, 64 percent; Sorong, 72 percent; Merauke and Manokwari, 84 percent; and Biak Numfor, 96 percent). However, from those, who have a comprehensive knowledge of HIV transmission is a large smaller, only 13 percent in Jayawijaya, 18 percent in Kaimana, 23 percent in Sorong , 24 percent in Biak Numfor, and 25 percent in Manokwari and Merauke districts.
Figure 14. Comprehensive knowledge of women age 15-49 on HIV transmission
25 Wealth index quintile Poorest Second Middle Fourth Richest Ethnicity of hhs head Papuan Wealth index quintile Poorest Second Middle Fourth Richest Ethnicity of hhs head Papuan Others
18 As expected, the percentage of women with comprehensive knowledge increases with the woman’s education level. Comprehensive knowledge had the lowest level among women with no education and increased to 46-48 percent among women higher education. Women residing in the poorest household have less comprehensive knowledge compared to the richest households. Women living in households with non-Papuan heads have higher comprehensive knowledge compared to others. Knowledge of mother-to-child transmission of HIV is also an important first step for women to seek HIV testing when they are pregnant to avoid infection in the baby. Women should know that HIV can be transmitted during pregnancy, during delivery and through breastfeeding.
District differentials exist with the highest percentage for this indicator in the district of Manokwari and the lowest in Kaimana.
Papua
West Papua 58
78
66 78
87
78
0 20 40 60 80 100
Kaimana Manokwari Sorong Figure 15. Knowledge of mother to child HIV transmission
Women Men
87
55
78 86
70
81
0 20 40 60 80 100
Biak Numfor Jayawijaya Merauke
Papua West Papua
19
MDGs Goal 7
ENSURE ENVIRONMENTAL SUSTAINABILITY
Target 7C: Halve, by 2015, the proportion of people without sustainable access to safe drinking water and basic sanitation.
Safe drinking water is a basic necessity for good health. Unsafe drinking water can be a significant carrier of diseases such as trachoma, cholera, typhoid, and schistosomiasis. Drinking water can also be tainted with chemical, physical and radiological contaminants with harmful effects on human health. In addition to its association with disease, access to drinking water may be particularly important for women and children, especially in rural areas, who bear the primary responsibility for carrying water, often for long distances.
The situation in Sorong and Biak Numfor districts are better than in other districts as about 80 percent of the population in these districts get its drinking water from an improved source, mostly from rainwater collection and bottled water. The lowest percentage of population getting its drinking water from improved source is in Jayawijaya (35 percent), followed by Merauke district. The figures in Manokwari and Kaimana districts are already above 60 percent.
Figure 16. Summary of water and sanitation indicators
Among population who get its drinking water from unimproved sources, in Jayawijaya district only 26 percent who applied water treatment before using the water for drinking. In Sorong district, although only less than 20 percent whose drinking water source is unimproved, most of them (92 percent) applied drinking water treatment.
Inadequate disposal of human excreta and personal hygiene is associated with a range of diseases including diarrhoeal diseases and polio. An improved sanitation facility is defined as one that
49
92 80
56 88 69
44 76 66
0 20 40 60 80 100 Use of improved
sanitation (not shared) Water treatment Use of improved drinking water source
Kaimana Manokwari Sorong
64 77 54
24 26
35
74 71
87
0 20 40 60 80 100 Use of improved
sanitation (not shared) Water treatment Use of improved drinking water source
Biak Numfor Jayawijaya Merauke Papua
West Papua
20 hygienically separates human excreta from human contact. Improved sanitation can reduce diarrheal disease by more than a third, and can significantly lessen the adverse health impacts of other disorders responsible for death and disease among millions of children in developing countries. Improved sanitation facilities for excreta disposal include flush or pour flush to a piped sewer system, septic tank, or pit latrine; ventilated improved pit latrine, pit latrine with slab, and use of a composting toilet.
Although most of the household population (68 to 88 percent), except in Jayawijaya district (33 percent), are using an improved sanitation facility but this facility is shared with others. The ones who use it without sharing with other are much reduced.
Around a half of the household population in three West Papua districts is using an improved sanitation facility without sharing with others (Kaimana, 44 percent; Manokwari, 56 percent; Sorong, 49 percent). Meanwhile, the three Papua districts show better performance, except Jayawijaya district (24 percent). There are 64 and 74 percent of household population respectively who used improved sanitation in Merauke and Biak Numfor districts.
As expected, improved sanitation facility correlates strongly with area, education of head of household and wealth.
Figure 17. Improved drinking water sources and improved sanitation
39 16
65 59 29 11
31 48
65 2
22 40
60 82 34
52 - 20 40 60 80 100 District
Merauke Jayawijaya Biak Numfor Area Urban Rural Hh head’s education None Primary Secondary Higher Wealth index quintile Poorest Second Middle Fourth Richest Ethnicity of hhs head Papuan Others
% Papua
32 45 45
57 38 20
32 49
61 5
24 40
62 84 31
54 - 20 40 60 80 100 District
Kaimana Manokwari Sorong Area Urban Rural Hh head’s education None Primary Secondary Higher Wealth index quintile Poorest Second Middle Fourth Richest Ethnicity of hhs head Papuan Others
21
CHILD PROTECTION
The first and fundamental means of child protection is to secure that that every child has the right to a name and a nationality and the right to protection from being deprived of his or her identity, as emanated in the the International Convention on the Rights of the Child states The World Fit for Children states the goal to develop systems to ensure the registration of every child at or shortly after birth, and fulfil his or her right to acquire a name and a nationality, in accordance with national laws and relevant international instruments. The indicator is the percentage of children under-5 years of age whose birth is registered.
Birth Registration
Among children under five, the worst and the best performance of birth registration rate are in the districts of Papua province, 20% in Jayawijaya and 66 % in Merauke districts. Among three districts of West Papua, birth registration is generally similar, around 46% to 51%.
Figure 18. Summary of Child Protection Indicators
35 9
15
90 33
22 51
30 11
22
84 44
22 50
22 5
13
86 38
24 46
0 20 40 60 80 100 Early married before 18
years old Early married before 15
years old Percentage of women 15-19 years old who are
currently married Violent dicipline to children (2-14 years old)
Perception of domestic violence among women
(15-49 years) Child labour (5-17 years
old)
Birth registration of children under-fives
Kaimana Manokwari Sorong
34 11 21
87 33
27 66
47 17
41
92 61 47 20
20 4 8
91 51 27
33
0 20 40 60 80 100 Early married before 18
years old Early married before 15
years old Percentage of women 15-19 years old who are
currently married Violent dicipline to children (2-14 years old)
Perception of domestic violence among women
(15-49 years) Child labour (5-17 years
old)
Birth registration of children under-fives
Biak Numfor Jayawijaya Merauke Papua
West Papua
22 Child Labour
Besides, protecting the child in term of preventing and responding to violence, abuse and exploitation against children is also part of the Convention on the right of the child and it should be an integral part of all programmes, plans, and strategies to ensure the achievement of the MDGs by 2015. Article 32 of the Convention on the Rights of the Child states: "States Parties recognize the right of the child to be protected from economic exploitation and from performing any work that is likely to be hazardous or to interfere with the child's education, or to be harmful to the child's health or physical, mental, spiritual, moral or social development ..." The World Fit for Children mentions nine strategies to combat child labour and the MDGs call for the protection of children against exploitation.
In the selected districts of Papua and West Papua 2011 MICS questionnaire, a number of questions addressed the issue of child labour, that is, children 5-17 years of age involved in labour activities. A child is considered to be involved in child labour activities at the moment of the survey if during the week preceding the survey:
• Ages 5-11: at least one hour of economic work or 28 hours of domestic work per week. • Ages 12-17: at least 14 hours of economic work or 28 hours of domestic work per week.
This definition allows differentiation between child labour and child worker to identify the type of work that should be eliminated. As such, the estimate provided here is a minimum of the prevalence of child labour since some children may be involved in hazardous labour activities for a number of hours that could be less than the numbers specified in the criteria explained above.
According to the above definition, the highest rate of child labour is in Jayawijaya district (47 percent), while the rates in the other five districts are quite similar, around 22 to 27 percent.
Child Discipline
As stated in A World Fit for Children, “children must be protected against any acts of violence …” and the Millennium Declaration calls for the protection of children against abuse, exploitation and violence. In the selected districts of Papua and West Papua Province MICS survey, mothers/caretakers of children age 2-14 years were asked a series of questions on the ways parents tend to use to discipline their children when they misbehave. Note that for the child discipline module, one child aged 2-14 per household was selected randomly during fieldwork. Out of these questions, the two indicators used to describe aspects of child discipline are: 1) the number of children 2-14 years that experience psychological aggression as punishment or minor physical punishment or severe physical punishment; and 2) the number of parents/caretakers of children 2-14 years of age that believe that in order to raise their children properly, they need to physically punish them.
In all the six selected districts of Papua and West Papua, children are subjected to at least one form of psychological or physical punishment by their mothers/caretakers or other household members, as the rate is more than 80 percent in all districts.
23 Figure 19.
Percentage of children age 2-14 years who experienced any violent discipline method by background characteristic
Generally, in all selected districts of both provinces, education did not show a clear association with child discipline. There is no much difference as well in terms of urban/rural areas, wealth quintile, and ethnicity of the household head.
Early Marriage
Marriage before the age of 18 is a reality for many young girls. According to UNICEF's worldwide estimates, over 64 million women age 20-24 were married/in union before the age of 18. Factors that influence child marriage rates include: the state of the country's civil registration system, which provides proof of age for children; the existence of an adequate legislative framework with an accompanying enforcement mechanism to address cases of child marriage; and the existence of customary or religious laws that condone the practice.
In many parts of the world parents encourage the marriage of their daughters while they are still children in hopes that the marriage will benefit them both financially and socially, while also relieving financial burdens on the family. In actual fact, child marriage is a violation of human rights, compromising the development of girls and often resulting in early pregnancy and social isolation, with little education and poor vocational training reinforcing the gendered nature of poverty. The right to 'free and full' consent to a marriage is recognized in the Universal Declaration of Human Rights - with the recognition that consent cannot be 'free and full' when one of the parties involved is not sufficiently mature to make an informed decision about a life partner.
87 Hh head's education None Primary Secondary Higher Wealth index quintile Poorest Second Middle Fourth Richest Ethnicity of hhs head Papuan Hh head's education None Primary Secondary Higher Wealth index quintile Poorest Second Middle Fourth Richest Ethnicity of hhs head Papuan Others
24 Closely related to the issue of child marriage is the age at which girls become sexually active. Women who are married before the age of 18 tend to have more children than those who marry later in life. Pregnancy related deaths are known to be a leading cause of mortality for both married and unmarried girls between the ages of 15 and 19, particularly among the youngest of this cohort. There is evidence to suggest that girls who marry at young ages are more likely to marry older men which puts them at increased risk of HIV infection. Parents seek to marry off their girls to protect their honour, and men often seek younger women as wives as a means to avoid choosing a wife who might already be infected. The demand for this young wife to reproduce and the power imbalance are resulting from the age differential lead to very low condom use among such couples.
Three indicators are to estimate the early married; percentage of women age 15-19 years who currently married/ union, percentage of women 20-49 years old married before 15 years of age and percentage of women 20-49 years old married before 18 years of age.
Figure 20a. Early marriage in women age 20-49 who married before age 18
Among two young women age 15-19 years old in Jayawijaya, one is currently married or in union; while one in thirteen of the same age women in Biak Numfor have the same marriage status. The percentage of women 15-19 years old who are currently married in Kaimana, Sorong, Merauke, and Manokwari are respectively 13 percent, 15 percent, 21 percent, and 22 percent.
Furthermore, 17 percent of women aged 20-49 years in Jayawijaya district were married before age 15 and 47 percent were married before age 18, make it the worst among the six districts in Papua and West Papua. The least marriage before age 15 is in Biak Numfor (4 percent) and Kaimana (5 percent); same condition for marriage before age 18 in Biak Numfor (20 percent) and Kaimana (22 percent).
34 47 20
22 42
53 48 27 4
50 37
39 29 16
- 20 40 60 80 100 District
Merauke Jayawijaya Biak Numfor Area Urban Rural Respondent's Education None Primary Secondary Higher Wealth index quintile Poorest Second Middle Fourth Richest
% Papua
22 30
35 23
33 44
47 26 3
39 36
38 26 16
- 20 40 60 80 100 District
Kaimana Manokwari Sorong Area Urban Rural Respondent's Education None Primary Secondary Higher Wealth index quintile Poorest Second Middle Fourth Richest
25 The percentage of women who were first married before age 18 is higher in rural areas compared to urban, on those who have lower education background, and those who come from poorer family. In contrary, early marriage is uncommon among men 20-49 years old. However, there is a clear correlation with respondent’s education, wealth quintile, and living areas, while those who live in rural area, with lower education background and poor household tend to enter early marriage.
Figure 20b. Early marriage in men age 20-49 who married before age 18
Attitudes towards domestic violence
A number of questions were asked of women and men age 15-49 years to assess their attitudes towards whether husbands are justified to hit or beat their wives for a variety of scenarios. These questions were asked to have an indication of cultural beliefs that tend to be associated with the prevalence of violence against women by their husbands. The main assumption here is that women or men that agree with the statements indicating that husbands are justified to beat their wives under the situations described in reality tend to be abused by their own husbands.
The variety of scenarios were given to assess whether the women age 15-49 years agree that a husband may beat his wife if: (1) she left without telling her husband, (2) she neglected their children, (3) she argued or denied her husband, (4) she refused to have a sex with her husband, (5) she burnt the food, and (6) she argued or denied her mother/father in law. The following figures present the percentage of women age 15-49 years who at least agree at least on one of the scenarios.
Overall, 61 percent of women in Jayawijaya district accept this type of violence. It is the worst compare to 51 percent in Biak Numfor, 44 percent in Manokwari, 38 percent in Kaimana, and 33 percent in both Sorong and Merauke districts.
3 11 4 3 7
12 6 5 3
12 6 7 2 2
- 20 40 60 80 100 District
Merauke Jayawijaya Biak Numfor Area Urban Rural Respondent's Education None Primary Secondary Higher Wealth index quintile Poorest Second Middle Fourth Richest
% Papua
5 8 5 3
8 13 10 6 3
14 9 6 4 3
- 20 40 60 80 100 District
Kaimana Manokwari Sorong Area Urban Rural Respondent's Education None Primary Secondary Higher Wealth index quintile Poorest Second Middle Fourth Richest
26 Neglecting the children is the situation that the most unaccepted situation in almost all six districts to allow a husband beat his wife. The second unaccepted situation is when the wife argues her husband. Refusing sex with her husband is less unaccepted compare to arguing with parent-in-law.
Figure 21. Various Situations that Allow a Husband Beat His Wife
Association of domestic violence with education is clear in 3 districts of Papua province, but not in 3 districts of West Papua province. In selected districts of Papua province more than two-third of women with no education (62 percent) justify this type of violence, while a lower percentage was observed for women who have higher education (36 percent). Acceptance is more present those living in poorest households (61 percent) compared with richest households (36 percent). Those differences are not clear among women in selected districts of West Papua province.
Although the acceptance is not much different between women and men, the correlation of background characteristic of men is clear in influencing the acceptance, both in selected districts in Papua province and West Papua province. Men from rural area, those who have lower education background, and living in poorest household are more accepting domestic violence.
25 34 27
13 12 18
33 39 39 30
21
31
13 22 15
7 4 14
0 20 40 60 80 100
she leaves without telling
her husband
she neglects their children
she argues with her husband
she refuses sex with her husband
she burns the food
she argues with parent-in-law
Percentage of women aged 15-49 who agree that a husband may beat his wife if
Biak Numfor Jayawijaya Merauke
22 19 19
10 10 19
19 27 26 15
11 23
18 24 20 12
8 15
0 20 40 60 80 100
she leaves without telling
her husband
she neglects their children
she argues with her husband
she refuses sex with her husband
she burns the food
she argues with parent-in-law
Percentage of women aged 15-49 who agree that a husband may beat his wife if
Kaimana Manokwari Sorong West Papua
%
27 Figure 22a. Percentage of women age 15-49 years who believe a husband is justified in
beating his wife/partner in various circumstances
Figure 22b. Percentage of men age 15-49 years who believe a husband is justified in beating his wife/partner in various circumstances
33 Wealth index quintile Poorest Second Middle Fourth Richest Ethnicity of hhs head Papuan Wealth index quintile Poorest Second Middle Fourth Richest Ethnicity of hhs head Papuan Wealth index quintile Poorest Second Middle Fourth Richest Ethnicity of hhs head Papuan Wealth index quintile Poorest Second Middle Fourth Richest Ethnicity of hhs head Papuan Others