Chapter 1
GENERAL ASSESSMENT
Introduction
After many years of weak recovery, with global growth in 2016 at the lowest rate since 2009, some signs of improvement have begun to appear. Trade and manufacturing output growth have picked up from a very low level, helped by firmer domestic demand growth in Asia and Europe, and private sector confidence has strengthened. But policy uncertainty remains high, trust in government has diminished, wage growth is still weak, inequality persists, and imbalances and vulnerabilities remain in financial markets. Against this background, a modest pick-up in global GDP growth is projected this year to 3½ per cent, with an upturn in trade and investment intensity and improving outcomes in several major commodity producers. Only a small improvement is in prospect for 2018, taking global GDP growth to 3.6%. With modest additional pressures in labour and product markets, inflation is likely to remain subdued in the major economies, provided commodity prices do not strengthen further.
While the pick-up is welcome, it would still leave global growth below past norms and below the pace needed to escape fully from the low-growth trap (Figure 1.1). Additional efforts to enhance policy support remain necessary for the recovery to gain further momentum. The stronger policy-driven demand growth in China and many other Asian economies that is helping to underpin the modest global upturn projected in 2017-18
Figure 1.1. GDP growth projections for the major economies Year-on-year percentage changes
Note:Horizontal lines show the average annual growth rate of GDP in the period 1987-2007. Data for Russia are for the average annual growth rate in the period 1994-2007.
1. With growth in Ireland in 2015 computed using gross value added at constant prices excluding foreign-owned multinational enterprise dominated sectors.
2. Fiscal years.
Source:OECD Economic Outlook 101 database; IMF World Economic Outlook database; and OECD calculations.
http://dx.doi.org/10.1787/888933501648
World¹ United States Japan
OECD¹ Euro area¹
0.0 0.5 1.0 1.5 2.0 2.5 3.0 3.5 4.0 %
2015 2016
2017 2018 A. Real GDP growth for the world and in the OECD
non-OECD India² Brazil
China Russia Indonesia -4 -2 0 2 4 6 8 10
cannot be sustained indefinitely. This reflects already high debt levels in some countries and the need, especially in China, for rebalancing the economy away from stimulus-driven investment growth towards consumption. The extent of US fiscal support in 2018 also remains very uncertain, given the challenges being experienced in reaching political agreement about policy choices. Growth in the euro area is on the upswing, but remains below longer-term averages. On the upside, near-term global cyclical momentum could be even stronger than projected, especially if the optimism in sentiment surveys and financial markets were to be reflected more clearly in private sector spending. The planned upgrading of the capital stock in many countries could also improve capital quality and productivity.
A comprehensive and collective policy response is needed to make growth stronger and more inclusive and to manage risks. Effective fiscal initiatives and implementation of structural reform packages that catalyse private demand and tackle obstacles to long-term inclusive growth remain essential, with each country and region facing particular challenges. In the absence of such support, private investment is unlikely to strengthen sufficiently to ensure the durable boost to productivity and real wages that is ultimately required to sustain higher consumption and output growth and reduce inequalities. Better-integrated policy packages would also help to ensure that the benefits of trade and open markets are more widely and equally distributed across workers, households and regions (Chapter 2). Steps to rebalance the policy mix in many advanced countries would reduce the burden still placed on monetary policy and help to lower risks, particularly in financial markets. Reform efforts should also be enhanced in emerging market economies (EMEs), where policy heterogeneity is greater. The need to adjust to changes in the terms-of-trade as a result of sizeable recent currency and commodity price movements adds to near-term challenges in many of these economies. Any steps to ease the policy stance will have to be judged carefully given the need to minimise financial vulnerabilities against the backdrop of higher US interest rates.
The global economy has improved recently, but policy support is needed for a
durable and sustainable recovery
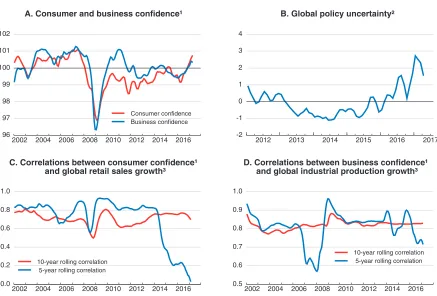
Signs of enhanced momentum in the global economy have recently emerged. Global GDP growth has picked up to an annualised rate of over 3¼ per cent since the middle of 2016, with a rebound in industrial production, global trade and investment (Figure 1.2). Demand growth in the advanced economies has stabilised at around 2%, and both demand and output growth are continuing to turn up slowly in the emerging and developing economies, helped by stronger policy-supported public infrastructure investment in Asia, especially China (Figure 1.3). Collectively, these demand increases have strengthened global trade including via value-chain links, and also contributed to an upturn in commodity prices. Business and consumer confidence have also rebounded further to levels above pre-crisis norms in some economies (Figure 1.4, Panel A). However, in contrast to the low levels of volatility in financial markets (see below), news-based estimates of economic policy uncertainty remain elevated (Figure 1.4, Panel B), suggesting continued medium-term downside risks.
association between consumer confidence and global retail spending has fallen sharply in recent years (Figure 1.4, Panels C and D; Box 1.1), suggesting that limited weight should be given to fluctuations in this measure in the absence of supporting developments in “hard” indicators of spending and income. This disconnect has also been apparent in the early part of 2017, especially in the advanced economies, with consumption growth moderating despite rising confidence, in part due to the drag on purchasing power from higher headline inflation.
Figure 1.2. An upturn in investment has helped to boost industrial production growth Year-on-year percentage changes
1. Based on the year-on-year growth rate of the 3-month moving average.
Source:OECD Economic Outlook 101 database; OECD Main Economic Indicators database; Thomson Reuters; and OECD calculations.
1 2 http://dx.doi.org/10.1787/888933501667
2012 2013 2014 2015 2016 2017
0 1 2 3 4 5 %
-4 -2 0 2 4 6
%
Average annual investment growth 1987-2007 = 3.34 OECD real investment growth
Global industrial production growth¹ OECD industrial production growth¹
Figure 1.3. Strong stimulus spending in China has helped to boost import growth this year Year-on-year percentage changes
Note:Fixed asset investment in nominal terms. Import volumes of goods plus services.
Source:OECD Economic Outlook 101 database; National Bureau of Statistics of China; and OECD calculations.
1 2 http://dx.doi.org/10.1787/888933501686
2015 2016 2017 M1-4
0 5 10 15 20 25 %
Manufacturing Infrastructure
A. China fixed asset investment growth
2015 2016 2017Q1
0 2 4 6 8 10 12 %
Figure 1.4. Confidence has strengthened further, but its links with spending are unclear and policy uncertainty remains elevated
1. Based on OECD member countries, Brazil, China, India, Indonesia, Russia and South Africa.
2. Based on the 3-month moving average of the news-based global economic policy uncertainty index, normalised over 2011-17. 3. Year-on-year percentage changes of the 3-month moving average series.
Source:OECD Main Economic Indicators database; www.policyuncertainty.com; and OECD calculations.
1 2 http://dx.doi.org/10.1787/888933501705
Box 1.1. The usefulness of various cyclical indicators
Timely cyclical indicators, such as industrial production (IP) and surveys of sentiment, are widely used in short-term forecasting and “nowcasting” models and in composite leading indicators, including at the OECD (Sédillot and Pain, 2003; OECD, 2012; Chalaux and Schwellnus, 2014). The strong upturn in these indicators since mid-2016 has raised the question as to whether they provide a reliable signal of improved cyclical momentum in the global economy at present. Past literature has shown the usefulness of IP and sentiment indicators in signalling business cycles at the country level (e.g. see above references), but it is less clear whether these indicators at an aggregate level are good signals of global or OECD business cycle dynamics.
The preliminary evidence below suggests that so-called hard indicators, such as industrial production, remain a fairly reliable indicator of OECD GDP growth cycles and to a lesser extent investment. In contrast, there are some signs that the reliability of sentiment indicators (so-called soft indicators) has declined in recent years, especially in emerging market economies. This suggests that these indicators are best assessed in conjunction with other fundamental drivers of growth. For example, this would include income dynamics for consumption, and both demand growth and uncertainty for investment.
2002 2004 2006 2008 2010 2012 2014 2016 96
97 98 99 100 101 102
Consumer confidence Business confidence A. Consumer and business confidence¹
2012 2013 2014 2015 2016 2017 -2
-1 0 1 2 3 4
B. Global policy uncertainty²
2002 2004 2006 2008 2010 2012 2014 2016 0.0
0.2 0.4 0.6 0.8 1.0
10-year rolling correlation 5-year rolling correlation
C. Correlations between consumer confidence¹ and global retail sales growth³
2002 2004 2006 2008 2010 2012 2014 2016 0.5
0.6 0.7 0.8 0.9 1.0
10-year rolling correlation 5-year rolling correlation D. Correlations between business confidence¹
Box 1.1. The usefulness of various cyclical indicators(cont.)
Sentiment indicators, such as business and consumer confidence, are some of the timeliest monthly indicators and typically have a fairly high correlation with other high-frequency (albeit less timely) hard indicators. This underlines their potential usefulness for forecasting GDP growth and its various sub-aggregates. At the global level, as well as for the OECD as a whole, there is a consistent positive correlation between IP growth and business confidence based on 10-year and 5-year rolling samples (first figure below, Panel A). In contrast, whilst the correlation between OECD consumer confidence and OECD consumption growth remains fairly high, consumer confidence has a weak and declining association with monthly consumer spending at the global level (first figure below, Panel B).
Correlations between cyclical hard and soft indicators
1. Global business and consumer confidence indicators based on OECD member countries, Brazil, China, India, Indonesia, Russia and South Africa.
2. Year-on-year percentage changes of the 3-month moving average series.
Source:OECD Main Economic Indicators database; Thomson Reuters; and OECD calculations.
1 2 http://dx.doi.org/10.1787/888933501420
The ability of soft and hard cyclical indicators to signal changes in growth momentum correctly can be assessed qualitatively by measures of directional accuracy. These calculate the proportion of time that an indicator, such as OECD IP growth (or confidence measures), and a reference series, such as OECD GDP growth (or investment/consumption), move in a similar direction.1This measure looks only at the direction of the changes in the two series rather than the respective magnitudes of the changes.
● The pre-crisis directional accuracy of IP growth for GDP growth was high, at around 80%; but recently it has been around 60% (second figure, Panel A). The relationship between IP growth and OECD fixed investment growth is broadly similar, albeit slightly weaker.
● Changes in the level of business confidence provide a less accurate indication of the direction of changes in the pace of growth in GDP and investment, and performance has deteriorated recently (second figure below, Panel B). Changes in consumer confidence were a good indicator of growth momentum in the early 2000s, especially for consumption growth, but again directional accuracy has deteriorated recently.
2002 2004 2006 2008 2010 2012 2014 2016 0.0
0.2 0.4 0.6 0.8 1.0
Global - 10-year rolling correlation Global - 5-year rolling correlation OECD - 10-year rolling correlation OECD - 5-year rolling correlation
A. Correlations between business confidence¹ and industrial production growth²
2002 2004 2006 2008 2010 2012 2014 2016 0.0
0.2 0.4 0.6 0.8 1.0
Global - 10-year rolling correlation Global - 5-year rolling correlation OECD - 10-year rolling correlation OECD - 5-year rolling correlation
Box 1.1. The usefulness of various cyclical indicators(cont.)
Assessing year-on-year changes in GDP, investment and consumption using hard and soft indicators
Note:Based on OECD aggregates. Directional accuracy measures the extent to which the two indicators change in a similar direction (e.g. an acceleration or deceleration). The directional accuracy measure is calculated over a 5-year rolling sample.
Source:OECD Main Economic Indicators database; Thomson Reuters; and OECD calculations.
1 2 http://dx.doi.org/10.1787/888933501439
It is also possible to evaluate the extent to which changes in the high-frequency indicators correctly signal major cyclical turning points in OECD quarterly GDP (or investment or consumption) growth. These turning points are dated by applying the widely-used Bry-Boschan algorithm that sets minimum requirements about the duration and amplification of phases and cycles, following Harding and Pagan (2002).2
● On this basis, IP growth appears to be a leading indicator of GDP growth, with its turning points lining up more frequently with those of GDP, or preceding turning points in GDP growth (see figure below). Major turning points in confidence measures also tend to lead GDP growth.
● However, there are also a fairly high number of turning points in the reference series that are either lagged, or missed by the indicator series.
● The turning points for IP growth and changes in business confidence line up more poorly with
investment growth and these indicators tend to miss or send more false signals regarding changes in investment cycles than is the case for GDP. This may reflect the fact that investment cycles (especially expansionary periods) tend to be longer than cycles for GDP and higher-frequency indicators. Changes in consumer confidence tend to lead or move contemporaneously with consumption growth, suggesting that confidence may also be a useful indicator in assessing turning points in consumption; however, its performance has also deteriorated since 2012, with a rising share of missing and false signals.
1. Specifically, a dummy variable is constructed which takes the value 1 if both the cyclical indicator (either year-on-year IP growth or the level of confidence) and annual growth in GDP (or investment/consumption) increases (or decreases) on a quarterly basis and is set to zero if they move in opposite directions. This dummy variable is then averaged over a 5-year rolling sample.
2. The algorithm identifies local peaks or troughs in a series as a maximum value or a minimum value within a centred 5-quarter window, forcing alternative peaks and troughs. Amongst a set of potential peaks and troughs established from the first step, turning points are determined by conditions related to the duration and amplification of phases and cycles.
2000 2005 2010 2015 0.0
0.2 0.4 0.6 0.8 1.0
GDP Investment
A. Industrial production Directional accuracy
2000 2005 2010 2015 0.0
0.2 0.4 0.6 0.8 1.0
Consumer confidence - GDP Consumer confidence - Consumption Business confidence - GDP Business confidence - Investment
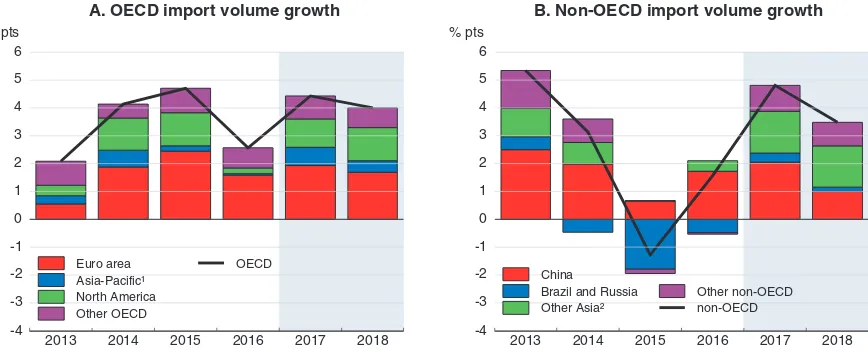
The current cyclical upturn is projected to help global GDP growth pick up to a little over 3½ per cent by 2018 (Box 1.2), with the composition of growth becoming more trade-intensive. Global trade growth began to recover from exceptionally low rates through the course of 2016, and global trade intensity is starting to rise, albeit from an historically-low level (Figure 1.5, Panel A). The trade recovery reflects a rebound in investment both in advanced and emerging market economies, given the higher trade-intensity of investment spending, and a resumption of import volume growth in the non-OECD economies. Trade growth is projected to average around 4% per annum through 2017-18, which remains modest by pre-crisis standards. This pick-up is broadly consistent with global investment intensity, which is projected to rise slightly in 2017 and 2018, but remain modest by pre-crisis standards (Figure 1.5, Panel B) despite strong policy-supported infrastructure investment in many emerging market economies in Asia, and a gradual stabilisation of spending in Brazil and Russia. In part, this reflects the likelihood that the current stimulus and credit-driven buoyancy of infrastructure and housing investment in China will diminish over the next two years, as rebalancing proceeds and measures are taken to deal with rising financial vulnerabilities. Across the advanced and emerging market economies, import volume growth in 2017-18 is generally strongest in those economies with comparatively robust investment growth (Figure 1.6).
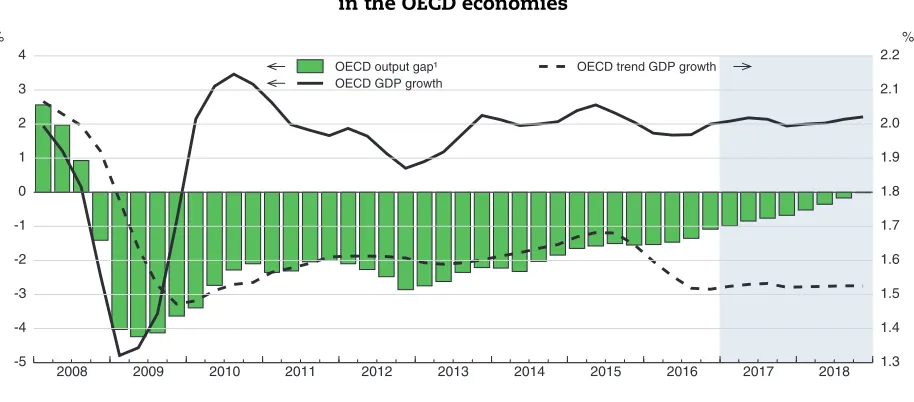
In the OECD economies, a key issue will be the extent to which the recovery can gain sufficient momentum to escape from the low-growth trap. Estimated cyclical slack is continuing to decline, but in part this stems from soft potential output growth – reflecting weak productivity and investment as a result of weak demand – rather than from more
Box 1.1. The usefulness of various cyclical indicators(cont.)
The timing of turning points in OECD cyclical indicators relative to OECD GDP, investment and consumption
Share of turning points, 1990-2016
Note:Based on OECD aggregates. Turning points are calculated on the quarterly growth rates to assess changing growth momentum. Leading signals are those that came before or were contemporaneous with GDP (or consumption/investment). Lagged turning points are those that occurred following those for GDP (or consumption/investment).
Source:OECD Economic Outlook 101 database; OECD Main Economic Indicators database; Thomson Reuters; and OECD calculations.
1 2 http://dx.doi.org/10.1787/888933501458
Leading Missing Lagging False Leading Missing
Lagging False Leading Missing Lagging False
0 10 20 30 40 50 60 %
0 10 20 30 40 50 60
%
Relative to GDP Relative to investment Relative to consumption
Box 1.2. Growth projections in the major economies
Global GDP growth is projected to rise to a little over 3½ per cent by 2018, helped by improving policy-supported outcomes in some emerging market economies, particularly in Asia, and the assumption of a moderately-supportive fiscal stance in a number of advanced economies, especially the United States in 2018. In the OECD economies, GDP growth is projected to be just over 2% in 2017-18 (table below). On a per capita basis, OECD GDP growth remains over ½ percentage point weaker than in the two decades prior to the crisis. Key features of the growth projections for the major economies are set out below.
In the United States, after a weak first quarter of 2017, GDP growth is projected to pick up to between 2¼-2½ per cent over 2017-18. Consumption growth continues to benefit from a firming labour market and increases in household wealth, and investment growth is recovering, helped by an upturn in energy sector spending and improved business confidence. An assumed fiscal easing of nearly ¾ per cent of GDP in 2018, via household and corporate tax reductions and a small rise in government spending, should provide an additional stimulus to domestic demand, especially business investment, despite somewhat higher long-term interest rates. In the absence of this easing, GDP growth would likely be closer to 2% in 2018.
GDP growth in Japan is set to strengthen to 1.4% this year, supported by stronger export growth, especially in Asian markets, and a modest fiscal easing. As fiscal support wanes in 2018, amidst a renewed decline in public investment, GDP growth could moderate to around 1%. Improved corporate profitability and rising labour shortages should help to underpin business investment through 2017-18, but private consumption is likely to remain subdued given still modest wage and income growth.
In the euro area, GDP growth is projected to average around 1¾ per cent per annum in 2017-18. Accommodative monetary policy and a small fiscal easing of ¼ per cent of GDP per annum in 2017 and 2018 will help to support area-wide activity, but still high unemployment, soft real wage growth and high non-performing loans constrain domestic demand growth in some countries. Stronger growth in non-EU markets, particularly Asia and the United States, should help to support export growth, but negative effects from weaker demand growth in the United Kingdom and uncertainty about the future course of the European Union could start to emerge towards the end of 2018.
GDP growth in the United Kingdom is projected to slow from a little under 1¾ per cent this year to 1% in 2018, despite the additional support from more favourable monetary conditions and the postponement of the sizeable fiscal tightening previously planned in 2017. The depreciation of sterling has improved export prospects somewhat, but has also pushed up inflation, damping household income growth and consumer spending. Business investment is projected to decline sharply, amidst continuing uncertainty about the future relationship between the United Kingdom and the European Union and lower corporate profit margins. The projections continue to assume that trade arrangements with the European Union will be based on WTO rules following the UK departure from the union in 2019.
In China, near-term demand is being supported by strong infrastructure and housing investment driven by expansionary fiscal policy, including via support for public investment from policy banks, and buoyant credit growth. As efforts intensify to manage financial risks and encourage the necessary transition towards consumption and service sectors, GDP growth is projected to ease gradually to between 6¼-6½ per cent in 2018.
In India, the impact of demonetisation has faded quickly, and GDP growth is projected to strengthen to around 7¾ per cent in fiscal year 2018/19. Sizeable increases in public sector wages and pensions are supporting private consumption, and structural reforms, particularly the introduction of the goods and services tax and measures to improve the ease of doing business, are projected to help private investment revive.
in 2017-18 (Figure 1.8, Panel A), helped by a gradual increase in spending as a result of higher commodity prices in the United States, Canada, Australia and Norway, and improved profitability in Japan and the euro area. This will, however, do little to reverse the substantially weaker growth of the productive capital stock experienced in recent years (Figure 1.8, Panel B).
In the United States, the May 2017 Semi-annual Economic Forecast from the Institute of Supply Management suggests that businesses are now more optimistic about investment spending in 2017 than in the previous report in December 2016, both in
Box 1.2. Growth projections in the major economies(cont.)
A resumption of growth in a number of major commodity-producing economies also accounts for a sizeable proportion of the improvement in global growth in 2017-18, although their collective contribution remains modest relative to 2013-14. In both Brazil and Russia, where output has begun to rise after protracted recessions, GDP growth is set to be supported in 2017-18 by firmer commodity prices, monetary policy easing as inflation wanes, and gradual improvements in sentiment. However, the near-term boost provided by higher oil prices in some oil-producing emerging market economies may be a little smaller than usual, given the extent to which a number of these countries are keeping supply fixed following the agreement of OPEC members and select non-OPEC producers to restrict near-term production levels, but GDP growth should pick up in 2018.
A modest pick up in global growth is projected
1 2 http://dx.doi.org/10.1787/888933505049
OECD area, unless noted otherwise
Average 2016 2017 2018
2004-2013 2014 2015 2016 2017 2018 Q4 Q4 Q4
Real GDP growth1
World2,7 3.9 3.4 3.1 3.0 3.5 3.6 3.3 3.5 3.7 OECD2,7 1.6 2.0 2.2 1.8 2.1 2.1 2.0 1.9 2.2
United States 1.6 2.4 2.6 1.6 2.1 2.4 2.0 2.1 2.5 Euro area7 0.8 1.2 1.5 1.7 1.8 1.8 1.8 1.9 1.7
Japan 0.8 0.3 1.1 1.0 1.4 1.0 1.7 1.3 1.0 Non-OECD2 6.6 4.6 3.9 4.1 4.6 4.8 4.4 4.8 4.9
China 10.3 7.3 6.9 6.7 6.6 6.4 6.7 6.5 6.3
Output gap3 -0.6 -2.1 -1.6 -1.4 -0.8 -0.3
Unemployment rate4 7.1 7.4 6.8 6.3 6.0 5.8 6.2 5.9 5.7
Inflation1,5 2.0 1.6 0.8 1.1 2.3 2.2 1.4 2.3 2.3
Fiscal balance6 -4.6 -3.5 -2.9 -3.0 -2.8 -2.7
World real trade growth1 5.4 3.7 2.7 2.4 4.6 3.8 3.3 3.6 4.3
1. Percentage changes; last three columns show the increase over a year earlier. 2. Moving nominal GDP weights, using purchasing power parities.
3. Per cent of potential GDP. 4. Per cent of labour force. 5. Private consumption deflator. 6. Per cent of GDP.
7. With growth in Ireland in 2015 computed using gross value added at constant prices excluding foreign-owned multinational enterprise dominated sectors.
Source: OECD Economic Outlook 101 database.
manufacturing and services sectors. Survey evidence from Europe suggests that companies are largely seeking to upgrade their existing capital assets rather than to expand capacity (Figure 1.9, Panel A). This is consistent with the recent Business and Industry Advisory Committee (BIAC) Business Climate Survey, which suggests that there
Figure 1.5. Global trade and investment intensity are set to increase Ratio of global trade and investment growth to global GDP growth
1. World trade volumes for goods plus services; global GDP at constant prices and market exchange rates. Based on growth through the year to the fourth quarter in the year shown. Period averages are the ratio of average annual world trade growth to average annual GDP growth in the period shown.
2. Fixed capital investment and GDP growth in the OECD, Brazil, China, Chinese Taipei, Hong Kong - China, India, Indonesia, Malaysia, the Philippines, Russia, Singapore, South Africa, Thailand and Vietnam, at constant prices.
Source:OECD Economic Outlook 101 database; IMF World Economic Outlook database; Consensus Economics; and OECD calculations.
1 2 http://dx.doi.org/10.1787/888933501724
Figure 1.6. Contributions to the growth of OECD and non-OECD import volumes Contributions to the year-on-year growth of total import volumes
1. Asia-Pacific includes Australia, Chile, Japan, Korea and New Zealand.
2. The group 'Other Asia' comprises Chinese Taipei, Hong Kong - China, India, Indonesia, Malaysia, the Philippines, Singapore, Thailand and Vietnam.
Source:OECD Economic Outlook 101 database.
1 2 http://dx.doi.org/10.1787/888933501743
2013 2014 2015 2016 2017 2018 -4 A. OECD import volume growth
has been only a modest improvement in the enabling conditions for private investment in many countries (Figure 1.9, Panel B).
Upgrading an ageing capital stock would not only contribute to the cyclical upturn, but would also help to boost total factor productivity and potential output, given the likely improvement in capital quality as a result of the diffusion of state-of-the-art technologies and software embodied in new equipment. Recent signs that the global IT cycle has started to regain momentum (Figure 1.10) suggest that a key part of any capital stock upgrade
Figure 1.7. Weaker supply growth is helping to narrow measured cyclical slack in the OECD economies
1. Per cent of potential GDP.
Source:OECD Economic Outlook 101 database.
1 2 http://dx.doi.org/10.1787/888933501762
2008 2009 2010 2011 2012 2013 2014 2015 2016 2017 2018 -5
Figure 1.8. Investment intensity is projected to improve in the OECD economies but capital stock growth is set to remain weak
1. Ratio of OECD investment growth to OECD GDP growth in period shown.
Source:OECD Economic Outlook 101 database; and OECD calculations.
1 2 http://dx.doi.org/10.1787/888933501781
2002 2004 2006 2008 2010 2012 2014 2016 2018 -0.5
could be the replacement of old equipment with new digital technologies.1More broadly, there is a substantial scope for firms in all countries and sectors to catch up with the technological frontier (EIB, 2017).
Figure 1.9. Surveys suggest that firms are likely to replace rather than expand capacity Percentage of respondents
1. Responses to the categories 'Replacing existing buildings, machinery, equipment and IT', 'Capacity expansion for existing products/ services', and ‘Developing or introducing new products, processes or services’.
2. Responses to the questions 'How have the enabling conditions for private investment in your country changed in the past year?' and 'In the coming year, how do you expect the enabling conditions for private investment in your country to change?'.
Source:EIB Group Survey on Investment and Investment Finance, 2017; and BIAC Business Climate Survey 2017.
1 2 http://dx.doi.org/10.1787/888933501800
Figure 1.10. The global IT cycle points to a possible upturn in high-tech investment Year-on-year percentage changes of the 3-month moving average
Note:World semi-conductor billings in nominal US dollars. Computer and electronics output is a weighted average of production of computer and electronic products (United States), output of computer, electronic and optical products (Germany), and production of information and communications electronics equipment plus electronic parts and devices (Japan).
Source:World Semi-Conductor Statistics; Eurostat; Board of Governors of the Federal Reserve System; Ministry of Economy, Trade and Industry, Japan; and OECD calculations.
1 2 http://dx.doi.org/10.1787/888933501819 A. Investment priorities of EU companies
in the next 3 years¹
Improvement Unchanged Weaker
Changes in the coming year Changes in the past year
B. Changes in the enabling conditions for private investment²
2000 2001 2002 2003 2004 2005 2006 2007 2008 2009 2010 2011 2012 2013 2014 2015 2016 -30
G3 computer and electronics output Global semi-conductor billings
Even with such capital upgrading, a much stronger recovery in investment and expansion in the capital stock will be needed to help strengthen productivity growth substantially, and ultimately real wages and incomes. As discussed below, enhanced use of fiscal initiatives and structural reforms to improve product market dynamism and competitive pressures would help to further boost investment and the diffusion of new technology.
Imbalances and vulnerabilities remain and wage growth is still modest
Labour markets are healing, but remaining cyclical slack will restrain wage growth
The key underpinnings of sustainable consumption growth are employment and wage growth. Both are ultimately dependent on private investment behaviour, via its impact on labour and total factor productivity growth. Employment growth, though modest, has recovered relatively well in recent years given the subdued upturn in output. Moreover, in many advanced economies, the underlying employment rate and the underlying labour force participation rate are now higher than in the decade prior to the crisis (Figure 1.11), with the United States a notable exception. In part, this reflects the cumulative impact of past labour market reforms to improve activation, reduce pathways to early retirement, enhance job creation, and lower barriers to female labour force participation. In a number of European countries, inflows of asylum seekers are also providing a modest boost to labour force growth, by close to 1% in Germany over 2015-18 and 0.5% in Sweden and Austria (Box 1.3).
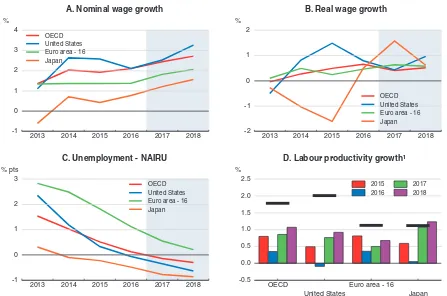
A durable and stronger upturn in household incomes and consumption requires stronger wage growth, since employment growth is likely to moderate as national labour markets slowly tighten and demographic headwinds start to limit feasible labour force growth. Nominal and real wage growth have been remarkably stable in the major economies in recent years, despite higher employment and lower unemployment. This is projected to change only slowly this year and next, in spite of further small declines in unemployment (Figure 1.12). The unemployment rate is now close to, or even below,
Figure 1.11. Underlying employment and participation rates have risen in many countries 15-74 age cohort
Source:OECD Economic Outlook 101 database; and OECD calculations.
1 2 http://dx.doi.org/10.1787/888933501838
40 50 60 70 80
% of trend labour force
SWE CAN USA JPN AUS GBR MEX DEU KOR FRA ESP ITA TUR 1997-2007 average 2016
A. Trend employment rates
40 50 60 70 80
% of working age population
SWE CAN USA JPN AUS GBR MEX DEU KOR FRA ESP ITA TUR 1997-2007 average 2016
Box 1.3. Economic impact of asylum seekers in selected countries
Europe (the European Union, Norway and Switzerland) has experienced the largest inflow of humanitarian migrants since World War II, with 3.6 million first-time asylum applications received since early 2013. In 2015, 1.3 million first-time asylum seekers entered European countries, but recent figures suggest a slowdown through the course of 2016, following the EU agreement with Turkey in March 2016. However, for 2016 as a whole, asylum applications were still elevated at 1.2 million (figure below). A large share of claims since early 2013 are from Syrian, Afghan and Iraqi nationals, reflecting conflicts in the region, although inflows also rose from other countries. By country of first reception in Europe, asylum applications as a share of the population have been highest in Sweden, Austria and Germany (taking into account withdrawn applications), as well as in Turkey. As of the end of 2016, based on Eurostat data, 1.5 million individuals had been granted some form of protection since early 2013, with the stock of pending applications for protection in Europe rising to 1.1 million.
Asylum applications to selected countries by nationality and age
1. Includes data for the EU28, Norway and Switzerland.
2. Net asylum applications are computed as first-time applications minus withdrawn applications, except for Turkey where the figure reports the average yearly change in the number of Syrian nationals under temporary protection over the period plus asylum applications by non-Syrian nationals. Countries with red columns are discussed in the text.
Source:Eurostat; UNHCR; and OECD calculations.
1 2 http://dx.doi.org/10.1787/888933501477
Assessing the economic impact of rising humanitarian migration on receiving countries is important, from a fiscal perspective and from the longer-term impacts of refugee integration into the labour market and the resulting addition to potential output. While the focus of this box is mainly on the short-term impact over 2016-18, the long-run impact will depend on whether immigrants remain in the country and the extent to which they integrate successfully into labour markets. The focus is on countries which have received a relatively high number of asylum applications as a share of the population, along with Greece and Italy, which have been key transit countries.
2013 2014 2015 2016 0
50 100 150 200 Thousands
Afghanistan Iraq Syria Other Aged 18-64
A. First-time asylum applications in European countries by nationality and age¹
0.0 0.2 0.4 0.6 0.8 1.0 %
Box 1.3. Economic impact of asylum seekers in selected countries(cont.)
Fiscal impact
Government spending in key receiving countries has increased as a result of the reception and processing costs of asylum seekers. This is projected to continue over in 2017-18. Comparing the level of expenditure between countries is difficult, given differences in the access to services, training and the labour market, as well as differences in the reporting of costs associated with reception, registration, processing and long-term integration services.
● For instance, some evidence suggests that the net fiscal cost for processing and accommodating asylum seekers (prior to acceptance) has been around€10,000 per application, but this figure can be significantly
higher if integration support is already provided during the asylum phase (OECD, 2017a).
● There is also a wide range of estimates of the annual cost per refugee in the early stages of reception (over a 12-month period) in reports of official development assistance (ODA) in some countries (OECD, 2016a). For the countries shown here, such estimates range from just over $4,500 in Austria to just under $32,000 in the Netherlands. The average is around $17,800, with a large share of the variance likely resulting from definitional differences.
Moreover, whether an asylum seeker is accepted or rejected, fiscal costs in the initial reception stage can be quite high. In Sweden, for instance, costs over the first 12 months for an asylum seeker granted residence were around $14,000, while fiscal costs associated with an unsuccessful applicant were around $12,000, based on 2014 data. This said, data on these cost breakdowns are limited across countries. Moreover, past experience may be a poor indicator of current costs given that current asylum seekers originate from different countries relative to past waves of migration.
With these caveats in mind, the estimated fiscal costs for the years 2015-18 associated with the recent wave of refugees are shown below, based where possible on available information. These estimates are for the total budgetary costs associated with the reception, processing and integration of new migrants (if available), include all levels of government (i.e. both central and subnational governments) and are net of contributions provided from external sources. For some countries, such as Denmark, they explicitly exclude additional costs on healthcare and public education. Where possible, an attempt is made to focus solely on the impact of the recent surge of refugees, rather than the total number of refugees, as some government spending occurs to provide basic services and training to past humanitarian migrants and a small inflow of asylum seekers would be expected given past norms.
Overall, based on OECD estimates, fiscal costs as a share of GDP are estimated to have peaked in 2016 in most countries, ranging from 0.1% of GDP in Switzerland to around 0.9% in Sweden (second figure, Panel A). Fiscal costs are expected to decline by roughly 0.1% of GDP on average in 2017, relative to 2016, and moderate a little further in 2018. This fiscal boost across the eight countries covered (excluding Turkey and Switzerland) amounts to a cumulative 0.6% of EU GDP from 2016-18 (1.2% of the aggregate GDP in the eight EU countries covered). This may understate EU-wide expenditure, as other countries in the union have also incurred expenditures to address higher numbers of asylum seekers. This boost to spending and demand will have had small, positive spillover effects on other European countries and trading partners.
Box 1.3. Economic impact of asylum seekers in selected countries(cont.)
Estimated fiscal costs associated with the wave of refugees and dynamics through time
1. Estimates for Belgium, Denmark and Italy refer to total spending on asylum seekers (including underlying and on past refugees) in the respective year. Belgium only includes estimates for 2015-17.
Source:OECD (2017a), “Who Bears the Cost of Integrating Refugees?”,Migration Policy Debates, January, OECD Publishing, Paris; and OECD calculations.
1 2 http://dx.doi.org/10.1787/888933501496
Labour market impact
The labour market impact of the recent inflow of asylum seekers will depend on their ability to access labour markets, the length of the application process, their success in gaining refugee status, and their language and skill levels. The typical period for asylum seekers to gain labour market access varies widely, from no waiting period in some countries under certain conditions (includes Greece, Norway and Sweden) and up to 12 months in the United Kingdom and the Czech Republic (third figure, Panel A). While data on the qualification levels of asylum seekers is scarce, some research suggests that there are large differences between the educational backgrounds of asylum seekers from the main countries of origin (OECD, 2017b).
Taking into account the varying timing for asylum seekers to access the labour market, as well as different skill levels, OECD estimates suggest that the cumulative inflow of refugees into the labour market over 2015-18 as a share of the labour force amounts to 2.6% in Turkey, 0.9% in Germany and 0.5% in Sweden and Austria, respectively. This boost is over and above the typical inflow of refugees normally seen on an annual basis. In many other countries, the impact is smaller, even if the absolute numbers entering the labour market can be high (third figure, Panel B). The overall impact on potential output is quite small in the short term, with the exception of perhaps Sweden and Turkey, which have received some of the largest inflows relative to their populations, but could build up over time. Going forward, the successful integration of refugees into labour markets will be a key determinant of their wellbeing as well as their broader impact on potential output and the fiscal balance.
0.0 0.1 0.2 0.3 0.4 0.5 0.6 0.7 0.8 0.9 % of GDP
CHE NLD ITA BEL GRC AUT DEU DNK TUR SWE 2015
2016
2017 2018
A. Refugee-related expenditures¹
1 2 3 4 5 6 7 8 9 10 20
-5000 0 5000 10000 15000
EUR per person
Australia Sweden
B. Net annual fiscal costs by duration of stay
Box 1.3. Economic impact of asylum seekers in selected countries(cont.)
The recent inflows of asylum seekers are likely to have a limited impact on wage developments in host economies. While they expand potential labour supply, especially in the medium term, their arrival is also associated with stronger demand for goods and services due to the higher level of fiscal support in the near term. Moreover, net effects depend on whether these new workers substitute for, or are complementary to, native workers. Overall, most studies suggest that immigration has little or no aggregate impact on the wages of native-born workers (Kerr and Kerr, 2011; OECD, 2016b). To the extent that there is some downward pressure on wages, it is more likely to occur in economies with relatively rigid product market regulations that inhibit the job creation that is ultimately necessary to absorb higher labour supply (Jean and Jimenez, 2007), and when the characteristics and skills of asylum seekers are similar to some types of native workers. Labour market institutions, such as minimum wage legislation or collective bargaining coverage, could limit any downward adjustment in wage levels, but could also make it more difficult for asylum seekers to gain employment.
Labour market integration of asylum seekers in key receiving countries
1. Canada, Greece, Norway and Sweden have no waiting period to access the labour market under certain conditions. Countries with red columns are discussed in the text.
2. The baseline excludes the typical annual inflow of refugees, prior to the recent surge.
Source:OECD Economic Outlook 101 database; OECD (2015a), “How will the refugee surge affect the European economy”,Migration Policy Debates, November, OECD Publishing, Paris; and OECD calculations.
1 2 http://dx.doi.org/10.1787/888933501515
Policy has an important role to play in determining the labour market impact of asylum seekers. Past research has shown that overall labour market conditions upon arrival are an important factor in the integration of refugees and early labour market access is a key determinant of long-term outcomes (OECD, 2017b). Cyclical labour market conditions in the largest receiving countries are fairly good at present, particularly in Germany and Sweden, which should help. While many of these countries provide early access to labour markets for asylum seekers and new policy measures have further liberalised entry, bottlenecks remain. For instance, in Sweden, progress could be made in simplifying procedures for migrants to get residence and work permits (OECD, 2017c). Boosting early labour market access, further increasing places for integration programmes and language training (including vocational language training), accurately assessing the skill levels of immigrants and tying the dispersion of asylum seekers more to areas with better labour market conditions in the host country could all improve the wellbeing of migrants and promote more inclusive growth (OECD, 2017b).
0 2 4 6 8 10 12 14 Months
CAN GRC NOR SWE AUT CHE DEU FIN BEL ITA NLD POL ESP TUR FRA HUN LUX SVN CZE GBR A. Waiting periods for accessing labour markets for asylum seekers¹
0.0
0.5 1.0 1.5 2.0 2.5 3.0
% of 2014 labour force
NLD GRC CHE BEL ITA AUT SWE DEU TUR B. Cumulative inflow of refugees into the labour
estimated long-run sustainable rates in a few economies, including the United States, Japan and Germany, although considerable cyclical slack still remains in economies hardest hit by the crisis and fiscal consolidation. In some OECD countries, the extent of remaining cyclical slack in labour markets is also higher than suggested by conventional headline measures of unemployment (Box 1.4). The subdued nature of economy-wide wage growth contrasts with the pick-up in the annual growth of minimum wages in some major economies, including this year (Figure 1.13).2
In part, low real wage growth per worker reflects continued sluggish labour productivity growth, with the average annual growth of OECD-wide output per employed person projected to pick up only gently in 2017-18 (Figure 1.12). However, for the typical worker, rising productivity may no longer be sufficient to raise real wages. The experience of the past two decades suggests that technological advances and productivity growth have decoupled from wage growth, especially in the lower part of the earnings
Figure 1.12. Wage growth remains weak despite declines in unemployment
Note:Nominal wages are measured as labour compensation per employee. Real wages are measured as nominal wages adjusted for the GDP deflator.
1. Horizontal lines show the average annual growth rate of labour productivity in the period 1997-2007.
Source:OECD Economic Outlook 101 database.
1 2 http://dx.doi.org/10.1787/888933501857
2013 2014 2015 2016 2017 2018 -1
2013 2014 2015 2016 2017 2018 -2 B. Real wage growth
2013 2014 2015 2016 2017 2018 -1
Box 1.4. Changes in the composition of employment and unemployment are affecting average wage growth
The weak response of wages to the declines in unemployment rates in the OECD economies is partly due to the degree of cyclical slack remaining in labour markets being greater than suggested by conventional measures of unemployment. Related changes in the composition of employment and the unemployed are also affecting economy-wide wage growth.
● Many countries still have a high level of involuntary part-time workers compared with the pre-crisis decade, implying that there is some scope to increase hours worked if demand strengthens (first figure below). In the OECD as a whole, the involuntary part-time rate in 2015-16 was over 1 percentage point higher than in the pre-crisis decade, with significantly larger increases in a number of European countries.
● There are also a comparatively high number of people only marginally attached to the labour market, but who might also return to the labour force if growth and job creation were to strengthen further. In contrast, the share of economic part-time workers has returned towards pre-crisis norms as the recovery has progressed.
● Employment rates have risen, but many new jobs are only part-time rather than full-time (second figure below), helping to hold down growth of wages per person.
● A further compositional effect is that the moderation of public pay that was introduced in a number
of advanced economies in the aftermath of the crisis may have contributed to the weakness of economy-wide wage growth, both by reducing pay in an important segment of the economy and possibly by reducing wage pressure in other sectors.
● Relatedly, evidence suggests that the main impact of labour market conditions on wage growth in recent years may have occurred via the wages of newly-hired workers rather than from those of incumbent workers (OECD, 2014, Chapter 2). In part this reflects the extent to which downward nominal wage rigidity and very-low price inflation have limited the ability of firms to lower wages for incumbent workers.
High levels of involuntary part-time work add to cyclical slack in the OECD area As a percentage of labour force
Source:OECD Economic Outlook 101 database; OECD Employment database; US Bureau of Labor Statistics; Eurostat; Statistics Bureau Japan; and OECD calculations.
1 2 http://dx.doi.org/10.1787/888933501534
1998 2000 2002 2004 2006 2008 2010 2012 2014 2016
0.0 0.5 1.0 1.5 2.0 2.5 3.0 3.5 4.0 %
5.0 5.5 6.0 6.5 7.0 7.5 8.0 8.5 9.0
%
Box 1.4. Changes in the composition of employment and unemployment are affecting average wage growth(cont.)
● On the other hand, high-levels of long-term unemployment in some countries (third figure below), and the associated losses in skills and employability (“hysteresis”), should act in an offsetting manner, since the impact of the long-term unemployed on wage bargains is small (Rusticelli, 2014). This makes current modest wage growth even more striking. However, a high level of long-term unemployment also implies that labour market reforms in conjunction with policy support for demand could have strong long-term effects on output (OECD, 2016c).
The share of part-time employment is higher than before the crisis Share of part-time employment in total employment
Note:Based on national definitions of the share of part-time employment in total employment.
Source:OECD Labour Force statistics database.
1 2 http://dx.doi.org/10.1787/888933501553
The proportion of unemployed for over one year is still above pre-crisis norms Share of those unemployed for over 1 year in total unemployment
Source:OECD Labour Force statistics database.
1 2 http://dx.doi.org/10.1787/888933501572
0 10 20 30 40 %
0 10 20 30 40
%
AUS GBR MEX SWE DEU CAN JPN USA
OECD FRA
ITA ESP TUR 1997-2007 average
2016 or latest
0
10 20 30 40 50 60 %
0 10 20 30 40 50 60
%
ITA
DEU FRA ESP
OECD
JPN GBR SWE AUS CAN USA
distribution, raising earnings inequality (Andrews et al., 2016; Schwellnus et al., 2017; Berlingieri et al., 2017).
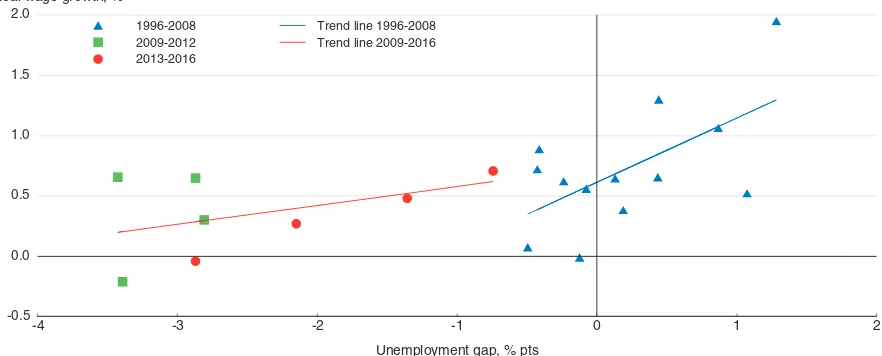
There is also some evidence that a given level of cyclical slack is now associated with a smaller impact on wage growth than before the crisis, even if allowance is made for changes in involuntary and economic part-time working (Figure 1.14). An implication is
Figure 1.13. Minimum wage growth is picking up in some countries Year-on-year percentage changes
Note:Estimates for the United States based on an employment-weighted average of state minimum wages, with the federal minimum wage used in those states either without a separate minimum wage or in which the state-minimum is below the federal rate.
Source:OECD Minimum Wage database; and United States Department of Labor.
1 2 http://dx.doi.org/10.1787/888933501876
0
1 2 3 4 5 6 7 8 9 %
0 1 2 3 4 5 6 7 8 9
%
USA CAN FRA DEU JPN GBR AUS ESP KOR
2013 2014 2015 2016 2017
Figure 1.14. The impact of labour market slack on wage growth has declined in the OECD
Note:Real wages are measured as the annual growth of compensation per employee in the OECD economies deflated using the GDP deflator. The unemployment gap is the difference between the average broad unemployment rate over 1993-2007 and the current broad unemployment rate. The broad unemployment rate is the sum of the claimant unemployment rate plus the economic part-time work rate plus the involuntary part-time work rate.
Source:OECD Economic Outlook 101 database; OECD Labour Force Statistics; US Bureau of Labor Statistics; Eurostat; Statistics Bureau Japan; and OECD calculations.
1 2 http://dx.doi.org/10.1787/888933501895
-4 -3 -2 -1 0 1 2
-0.5 0.0 0.5 1.0 1.5 2.0
Real wage growth, %
1996-2008 2009-2012 2013-2016
Trend line 1996-2008 Trend line 2009-2016
that real wage growth might remain subdued even with continued improvements in national labour markets unless there are significant non-linear effects of slack on wage growth after labour markets tighten beyond a certain point (Nalewaik, 2016).
Factors that may have reduced the responsiveness of wages to labour market slack include weaker bargaining power of workers due to rapid technological change, the automation of certain tasks, increasing global production integration and, in particular, the offshoring of low-skill labour intensive tasks (Figure 1.15). These factors are interrelated and difficult to untangle fully, since stronger trade integration directly affects productivity growth and incentives to innovate (Chapter 2; Bloom et al., 2016; Égert and Gal, 2017). Firm-level evidence suggests that both globalisation and digitalisation are associated with higher wage divergence (Berlingieri et al., 2017).
Overall, wage pressures should eventually show up as labour markets continue to tighten. However, nominal and real wage growth in the advanced economies are projected to increase only gently in 2017-18 (Figure 1.12), and remain well below pre-crisis norms. Productivity growth is subdued, labour market slack is more extensive than suggested by conventional unemployment rates and the influence of a given level of slack on real wage growth is weaker than prior to the crisis. Hence, additional policy support for demand and long-term supply is needed to eliminate fully existing labour market slack and strengthen productivity growth, thereby bringing about the durable strengthening of real wages needed to sustain consumption growth.
Headline inflation has risen but underlying inflationary pressures are projected to
remain subdued
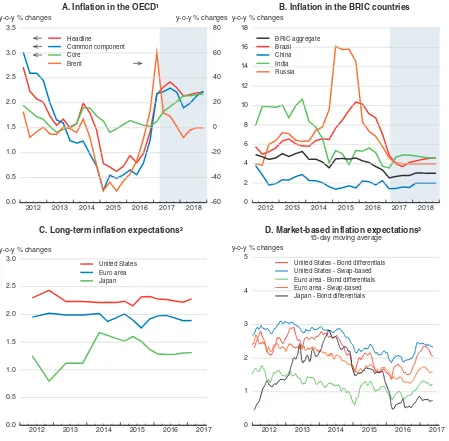
Higher commodity prices have boosted headline inflation in the major economies, but core inflation remains modest (Figure 1.16). Commodity prices including energy, metals and non-agricultural food commodities have risen since 2016Q3, reflecting both stronger demand and idiosyncratic supply constraints. Oil prices have increased since November,
Figure 1.15. Changes in trade and technology are both associated with changes in labour shares in advanced economies
Change between 1995 and 2011, in percentage points
Source:Schwellnus et al. (2017), “The Role of Trade, Technology and Public Policies in Determining the Labour Share: Empirical Evidence”,
OECD Economics Department Working Papers, forthcoming, OECD Publishing, Paris.
1 2 http://dx.doi.org/10.1787/888933501914
0 1 2 3 4
-20 -15 -10 -5 0 5 10 15
A. Correlation between labour share and value-added imports from China
Change in labour share, % pts
Change in value-added imports from China as a share of total final demand, % pts
-1 0 1 2
-20 -15 -10 -5 0 5 10 15
B. Correlation between labour share and R&D expenditures
Change in labour share, % pts
following the agreement of OPEC members and select non-OPEC producers to restrict near-term production levels. In contrast, survey measures of longer-term inflation expectations have remained fairly flat since 2016 in major economies, but market-based inflation expectations have moved up slightly, albeit remaining subdued by historical standards. Core inflation (excluding food and energy prices) has changed little in most
Figure 1.16. Inflationary pressures in the OECD and emerging market economies are projected to remain modest
1. Based on the consumer expenditure deflator for the United States, the harmonised consumer price indices for euro area economies and the consumer price index in remaining OECD countries. The OECD average is constructed using PPP GDP weights. The OECD common component is based on the first principal component of the headline inflation series in OECD economies.
2. Inflation expectations are based on an average of 6 to 10-year ahead inflation forecasts by professional forecasters from Consensus Economics.
3. Inflation expectations implied by the yield differential are based on the difference between 10-year government benchmark bonds and inflation-indexed bonds. Swap-based inflation expectations are based on 5-year and 10-year inflation swaps.
Source:OECD Economic Outlook 101 database; Consensus Economics; Thomson Reuters; and OECD calculations.
1 2 http://dx.doi.org/10.1787/888933501933
2012 2013 2014 2015 2016 2017 2018 0.0
A. Inflation in the OECD¹
2012 2013 2014 2015 2016 2017 2018 0
B. Inflation in the BRIC countries
2012 2013 2014 2015 2016 2017 0.0
2012 2013 2014 2015 2016 2017 0
United States - Bond differentials United States - Swap-based Euro area - Bond differentials Euro area - Swap-based Japan - Bond differentials
advanced economies, although the United Kingdom is a notable exception following the depreciation of sterling. In China, consumer price inflation has moderated since January, although producer prices have been increasing since early 2016, reflecting commodity price developments and reduced over-capacity, after having been on a declining trend for five years. In some other large emerging market economies, recent currency movements are having a sizeable impact on inflation, with inflation declining sharply in Brazil and Russia, but rising markedly in Turkey.
In the absence of significant further moves in commodity prices, exchange rates and inflation expectations, core inflation is projected to edge up slowly as economic slack declines in the advanced economies over the next 18 months. Inflation is projected to be around 2¼ per cent in late 2018 in the United States, where the recovery is relatively advanced, but to remain at 1% and just over 1½ per cent, respectively in Japan and the euro area. Amongst major emerging market economies, consumer price inflation is projected to remain low in China, ease in Russia and remain subdued in Brazil. In India, inflationary pressures are expected to increase from current low levels, albeit remaining within the inflation target band.
Global current account imbalances have narrowed modestly but the regional
composition has changed sharply
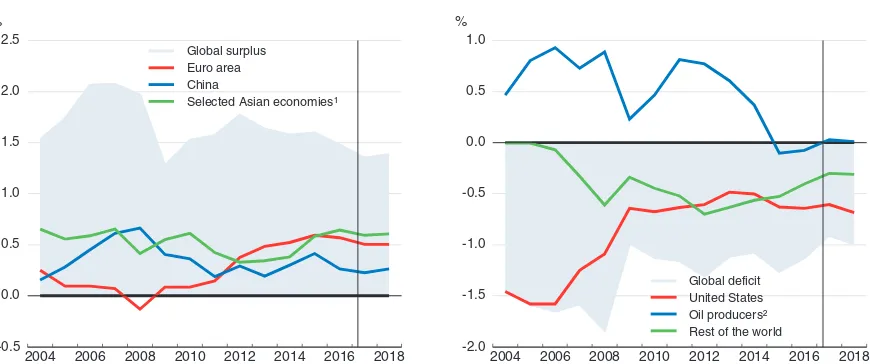
Although current account balances are not a target for policy, examining how they have evolved can yield a perspective on the underlying demand and production imbalances which are relevant for policy. Global current account imbalances have narrowed, with the surplus counterpart well below pre-crisis levels at around 1½ per cent of world GDP in 2016 (Figure 1.17). This narrowing has been accompanied by sizeable
Figure 1.17. The composition of global current account balances has changed As a percentage of world GDP
Note:Regional aggregates are calculated inclusive of intra-regional trade. The surplus and deficit part of the global current account balance may differ due to statistical discrepancies.
1. Selected Asian economies include Chinese Taipei, Hong Kong - China, Japan, Korea, Malaysia, the Philippines, Singapore, Thailand and Vietnam.
2. Oil producers include Algeria, Angola, Azerbaijan, Bahrain, Brunei, Chad, Ecuador, Equatorial Guinea, Gabon, Iran, Iraq, Kazakhstan, Kuwait, Libya, Nigeria, Oman, Qatar, Republic of Congo, Russia, Saudi Arabia, Sudan, Timor-Leste, Trinidad and Tobago, Turkmenistan, the United Arab Emirates, Venezuela and Yemen.
Source:OECD Economic Outlook 101 database.
1 2 http://dx.doi.org/10.1787/888933501952
2004 2006 2008 2010 2012 2014 2016 2018 -0.5
0.0 0.5 1.0 1.5 2.0 2.5 %
Global surplus Euro area China
Selected Asian economies¹
2004 2006 2008 2010 2012 2014 2016 2018 -2.0
-1.5 -1.0 -0.5 0.0 0.5 1.0 %
regional shifts. The large current account surpluses of oil-producing countries have turned into deficits, reflecting the past fall in oil prices. The Chinese surplus has narrowed, but the euro area surplus has increased. The US current account deficit narrowed until around 2013, but has since widened again, albeit remaining below pre-crisis levels.
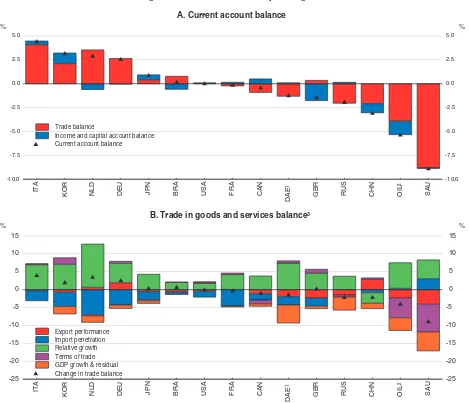
Looking from the country perspective, changes in current account balances between 2009 and 2016 are largely driven by changes in trade in goods and services, with income and capital accounts playing a significant role only in a few countries (Figure 1.18).3The euro area countries, Japan and Korea have benefited from high export market growth (that increases exports) relative to total final expenditure growth (that increases imports). The opposite has been true for China. The large increase in the surplus of the euro area countries has reflected tight fiscal policy, which has weighed on domestic demand and compounded the effect of the persistent regulatory barriers on competition in the domestic market that restrain investment. In most of the countries shown, the increasing import intensity of total final expenditure, reflecting rising trade openness and the global fragmentation of production, has led to a deterioration in trade balances. Similarly, most of the countries have lost market shares, reducing the benefits from rising foreign demand, with the notable exceptions of China and Germany. Oil-importing countries, as well as Korea and some European economies, have also benefited from positive terms of trade developments, but this has acted against oil-exporting countries until recently.
Exchange rate changes since 2009 seem to have had only a modest overall impact on trade balances. Cross-country experience suggests that an appreciation of the domestic currency in real effective terms is only weakly associated with declines in market shares over time, and vice versa (Figure 1.19).4Thus, the large effective appreciation of the US dollar in 2014-16 has not so far resulted in significant export market losses, and the depreciation of sterling in 2008-09 was not followed by gains in export performance. On the import side, currency appreciation seems to co-move with higher import penetration, but again the cross-country correlation is quite low. An important reason for the weak volume response to currency movements appears to be a tendency to price to markets, with profits adjusting to currency changes. The small responsiveness of trade volumes to exchange rates could also result from a still high share of imported inputs in production of goods for exports (Ollivaud et al., 2015), despite some unwinding of global value chains since the Great Recession (Haugh et al., 2016).
In view of the low responsiveness of trade flows to exchange rate moves, expenditure-switching in response to changes in the relative prices of domestic versus foreign products is unlikely to reduce trade imbalances significantly. Thus a reduction of current account surpluses will require stronger domestic demand, all else equal. Depending on country circumstances, this could involve either more private consumption or more domestic investment. For instance, in Asian emerging market economies, and in particular in China, higher domestic demand could be achieved by reducing precautionary household saving via a more generous and inclusive social security system (including public health care, pensions and unemployment benefits). In Japan and Korea, raising both
3. The large change in the United Kingdom is attributable to the fall in net income from FDI investment.
private consumption and investment is desirable. In Germany and the Netherlands, and to a lesser extent in other euro area countries, boosting private investment and easing the fiscal stance would help to reduce large current account surpluses.
By contrast, protectionism will not reduce trade imbalances but will weaken economic and productivity growth. Raising trade barriers is also likely to result in retaliation. Simulations in the OECD METRO model (OECD, 2015b) of an illustrative increase in trade
Figure 1.18. Decomposition of changes in external balances Changes between 2016 and 2009, as a percentage of GDP
1. Dynamic Asia Economies include Chinese Taipei, Hong Kong - China, Malaysia, the Philippines, Singapore, Thailand and Vietnam. 2. Oil producers include Algeria, Angola, Azerbaijan, Bahrain, Brunei, Chad, Ecuador, Equatorial Guinea, Gabon, Iran, Iraq, Kazakhstan,
Kuwait, Libya, Nigeria, Oman, Qatar, Republic of Congo, Sudan, Timor-Leste, Trinidad and Tobago, Turkmenistan, the United Arab Emirates, Venezuela and Yemen.
3. Export performance is the ratio of the growth of goods and services exports to a weighted average of the growth of import volumes in partner countries. Import penetration is the share of import volumes in total final expenditure. Relative growth is the difference between foreign demand growth and the growth of total final expenditure. The terms of trade is the ratio of export to import prices. The GDP growth and residual component measures the contribution of nominal GDP growth and the decomposition discrepancy to changes in the trade balance as a share of GDP.
Source:OECD Economic Outlook 101 database; and OECD calculations.
1 2 http://dx.doi.org/10.1787/888933501971
KOR NLD DEU JPN BRA USA FRA CAN
DAE¹ GBR RUS CHN OIL² SAU Trade balance
Income and capital account balance Current account balance
KOR NLD DEU JPN BRA USA FRA CAN
DAE¹ GBR RUS CHN OIL² SAU Export performance
costs on all goods (but not services) by 10 percentage points by major global trading economies (China, Europe and the United States)5suggest that export volumes could decline by more than import volumes in Europe and the United States (OECD, 2016c). Assuming no changes in export and import prices, this would likely result in an even larger deficit in goods trade in the United States. Moreover, such protectionist measures would also likely reduce GDP in the main trading areas by around 2½ per cent in the medium term. These negative effects could be even larger if retaliatory actions were to generate additional adverse effects on trade from disruption to global value chains, and the resulting uncertainty were to result in a slowdown of investment, leading to further drops in incomes and productivity.
Financial market disconnects and vulnerabilities could derail the recovery
Anomalies in government bond markets persist
Despite only a gradual increase in long-term rates in the United States in the last year, there is still a risk of a swift snap-back. While the normalisation of interest rates in the economy is desirable with stronger GDP growth and higher inflation, the financial market volatility that may arise during the process, could have negative spillovers to other assets in the United States and elsewhere, including government and corporate bonds, equities and property prices.6A sudden increase in US long-term government bond yields could, for instance, happen when the Federal Reserve decides to reduce the size of its balance sheet, reversing downward pressures on term premia from earlier asset purchases (D'Amico et
Figure 1.19. Changes in export performance and import penetration seem not to respond strongly to changes in real effective exchange rates
Note:Percent changes between 2016 and 2009 are calculated on annual data for 44 countries (most OECD countries and several non-OECD emerging market economies). Export performance is the ratio of the growth of goods and services exports to a weighted average of the growth of import volumes in partner countries. Import penetration is the share of import volumes in total final expenditure. A positive change in the real effective exchange rate indicates a currency appreciation.
Source:OECD Economic Outlook 101 database.
1 2 http://dx.doi.org/10.1787/888933501990
-40 -20 0 20 40
-30 -20 -10 0 10 20 30 40 50
A. Export performance
Change in export performance, %
Change in real effective exchange rate, %
-20 0 20 40
-30 -20 -10 0 10 20 30 40 50
B. Import penetration
Change in import penetration, %
Change in real effective exchange rate, %
5. This magnitude is roughly equivalent to an average increase of tariffs to the bound tariff rates in 2001, the year when the trade negotiations under the Doha Development Round started.
al., 2012; Li and Wei, 2014).7This, together with increases in policy rates, could make market participants revise their expectations of future policy interest rates excessively. So far, market indicators point to a much more gradual increase in policy rates than projected by policymakers. There is also a risk that the initial rise in bond yields could be magnified by bond sales by investors who bet on bond price gains, or by pension funds and insurance companies, as discussed below.
In Europe and Japan, a large share of government bonds still trade at negative yields (Figure 1.20). Moreover, currently around 10% of total outstanding conventional government bonds in Denmark, Japan and the Netherlands, and around 18% in Germany, have been sold with negative interest rates at auctions. This abnormal asset pricing, stemming partly from extraordinary monetary policy stimulus, has adverse implications for bond holders, in particular banks, pension funds and insurance companies (OECD, 2016c). The reaction of pension funds and life insurance companies to the low-interest rate environment could have actually amplified downward pressures on government bond yields, as they have increased demand for longer-term government securities to match the increase in their discounted future liabilities (Domanski et al., 2017). In the euro area, the ECB's Asset Purchase Programme has contributed to the widening of so called TARGET2 imbalances to record highs (De Nederlandsche Bank, 2016; Deutsche Bundesbank, 2016; ECB, 2016; Auer and Bogdanova, 2017; Box 1.5).
Equity prices have risen apparently in excess of fundamentals
Global equity prices have increased on average by more than 10% since November last year, reaching historic highs in the United States and Germany (Figure 1.21). The recent rise has been driven mainly by improved risk tolerance, following heightened risk aversion in early 2016. Prices have increased by more than expected earnings and despite an increase
7. If term premia were to move from their recent level of close-to-zero to the average levels over the five years prior to the crisis, 10-year government bond yields could increase by around 110 basis points. Estimates of term premia are, however, highly uncertain (Li et al., 2017).
Figure 1.20. The share of negative-yield bonds in total outstanding government bonds remains high
Note:Estimated based on benchmark sovereign bond yields as of 18 May 2017.
Source:Thomson Reuters; Bloomberg; and OECD calculations.
1 2 http://dx.doi.org/10.1787/888933502009
0
15 30 45 60 75 90 %
0 15 30 45 60 75 90
%