Consolidated Financial Statements
With Independent Auditors’ Report
December 31, 2006
With Comparative Figures for 2005
WITH COMPARATIVE FIGURES FOR 2005
Table of Contents
Page
Independent Auditors’ Report
Consolidated Balance Sheets ………. 1-2
Consolidated Statements of Income ……….. 3
Consolidated Statements of Changes in Shareholders’ Equity ………. 4
Consolidated Statements of Cash Flows ……….. 5-6
Notes to the Consolidated Financial Statements .……… 7-54
Independent Auditors’ Report
Report No. RPC-6573
The Shareholders, and the Boards of Commissioners and Directors PT Indocement Tunggal Prakarsa Tbk.
We have audited the consolidated balance sheet of PT Indocement Tunggal Prakarsa Tbk. (the “Company”) and Subsidiaries as of December 31, 2006, and the related consolidated statements of income, changes in shareholders’ equity and cash flows for the year then ended. These financial statements are the responsibility of the Company’s management. Our responsibility is to express an opinion on these financial statements based on our audit. We did not audit the financial statements of all associated companies, the investments in which are accounted for in the consolidated financial statements using the equity method. The carrying values of these investments represent approximately 0.51% of the total consolidated assets as of December 31, 2006, while the related equity in net earnings of these associated companies amounted to Rp9,686,380,530 in 2006. The consolidated financial statements of PT Indocement Tunggal Prakarsa Tbk. and Subsidiaries for the year ended December 31, 2005, were audited by Prasetio, Sarwoko & Sandjaja, whose report dated January 20, 2006, expressed an unqualified opinion on those statements.
We conducted our audit in accordance with auditing standards established by the Indonesian Institute of Accountants. Those standards require that we plan and perform the audit to obtain reasonable assurance about whether the financial statements are free of material misstatement. An audit includes examining, on a test basis, evidence supporting the amounts and disclosures in the financial statements. An audit also includes assessing the accounting principles used and significant estimates made by management, as well as evaluating the overall financial statement presentation. We believe that our audit provides a reasonable basis for our opinion.
In our opinion, the 2006 financial statements referred to above present fairly, in all material respects, the financial position of PT Indocement Tunggal Prakarsa Tbk. and Subsidiaries as of December 31, 2006, and the results of their operations and their cash flows for the year then ended in conformity with generally accepted accounting principles in Indonesia.
Purwantono, Sarwoko & Sandjaja
Benyanto Suherman
Public Accountant License No. 05.1.0973
The accompanying notes form an integral part of these consolidated financial statements.
Notes 2006 2005
ASSETS
CURRENT ASSETS
Cash and cash equivalents 2c,3 43,386,264,747 498,010,383,632
Time deposits 2c 8,786,299,848 -
Short-term investments 2d 1,300,650,000 5,428,752,650
Trade receivables 2e,4,12
Related party 2f,23 35,942,984,396 47,897,758,168
Third parties - net of allowance for doubtful accounts of Rp11,067,732,391 in 2006
and Rp13,835,340,496 in 2005 24j 581,313,208,397 505,963,586,184
Other receivables from third parties - net of allowance for doubtful accounts of
Rp7,371,980,358 in 2006 and 2005 2e,5 11,962,963,023 5,448,888,761
Inventories - net 2g,6,12 953,204,236,576 911,291,789,489
Advances and deposits 6,24a 72,485,222,241 119,605,903,683
Prepaid taxes 11 14,984,540,549 37,854,330,331
Prepaid expenses 2h 18,336,034,367 24,263,350,909
TOTAL CURRENT ASSETS 1,741,702,404,144 2,155,764,743,807
NON-CURRENT ASSETS
Long-term derivative assets 2q,25 - 84,171,508,110
Due from related parties 2f,23 49,961,946,164 57,224,578,033
Deferred tax assets - net 2r,11 5,894,750,585 5,404,241,660
Long-term investments and advances to associated company - net of allowance for doubtful accounts of Rp13,720,944,026
in 2006 and 2005 2b,2f,7,23 49,020,750,634 42,873,603,424
Fixed assets - net of accumulated depreciation, amortization and depletion of
Rp4,328,988,778,381 in 2006 and 2i,2j,2k,
Rp3,848,727,414,347 in 2005 2l,8,12 7,679,069,065,279 7,811,938,786,956
Restricted cash and time deposits 12,13 479,000,000 302,771,129,921
Other non-current assets 2h,2m,8 72,152,413,936 76,231,152,013
TOTAL NON-CURRENT ASSETS 7,856,577,926,598 8,380,615,000,117
TOTAL ASSETS 9,598,280,330,742 10,536,379,743,924
Notes 2006 2005
Other payables to third parties 8,17,24i 115,383,815,567 84,159,162,713
Accrued expenses 12,20 183,463,901,989 157,216,319,564
Taxes payable 2r,11 69,089,659,782 34,552,510,560
Derivative liabilities - net 2q,25 3,738,655,113 14,030,194,787
Current maturities of long-term debts
Loans from banks and financial institutions 2f,12,23 252,930,774,797 393,200,000,000
Obligations under capital lease 2k,8,13 2,993,554,562 1,912,022,428
TOTAL CURRENT LIABILITIES 812,180,007,701 855,844,362,864
NON-CURRENT LIABILITIES
Long-term debts - net of current maturities
Loans from banks and financial institutions 2f,12,23 1,972,974,161,926 3,476,891,067,797
Obligations under capital lease 2k,8,13 5,912,495,283 119,749,997
Long-term derivative liabilities 2q,25 75,939,001,160 -
Due to related party 2f,23 5,482,141,192 5,695,739,069
Deferred tax liabilities - net 2r,11 606,268,637,255 495,137,737,395
Estimated liability for employee benefits 2o,22 54,187,223,918 47,867,513,812 Estimated liability for post-retirement health-
care benefits 2o,22 7,557,608,000 4,409,314,000
Provision for recultivation 24q 17,843,913,938 12,716,256,641
Deferred gain on sale-and-leaseback
transactions - net 2k 7,172,805,899 8,316,073,554
TOTAL NON-CURRENT LIABILITIES 2,753,337,988,571 4,051,153,452,265
SHAREHOLDERS’ EQUITY
Capital stock - Rp500 par value per share
Authorized - 8,000,000,000 shares
Issued and fully paid - 3,681,231,699 shares 14 1,840,615,849,500 1,840,615,849,500
Additional paid-in capital 2t,15 1,194,236,402,048 1,194,236,402,048
Other paid-in capital 16 338,250,000,000 338,250,000,000
Revaluation increment in fixed assets 2i,8,11 229,970,296,236 229,970,296,236
Differences arising from restructuring transactions among entities under
common control 2b 1,165,715,376,569 1,165,715,376,569
Differences arising from changes in the equity
of Subsidiaries 2b 973,936,686 6,333,962,836
Retained earnings
Appropriated 18 150,000,000,000 125,000,000,000
Unappropriated 1,113,000,473,431 729,260,041,606
TOTAL SHAREHOLDERS’ EQUITY 6,032,762,334,470 5,629,381,928,795
TOTAL LIABILITIES AND SHAREHOLDERS’ EQUITY 9,598,280,330,742 10,536,379,743,924
The accompanying notes form an integral part of these consolidated financial statements.
GROSS PROFIT 2,147,795,509,713 2,019,899,332,505
OPERATING EXPENSES 2f,2n,21,22,
23,24i,24k
Delivery and selling 887,351,398,943 613,587,028,536
General and administrative 192,768,213,358 192,357,458,781
Total Operating Expenses 1,080,119,612,301 805,944,487,317
INCOME FROM OPERATIONS 1,067,675,897,412 1,213,954,845,188
OTHER INCOME (EXPENSE)
Foreign exchange gain - net 2p,2q,25 49,289,270,983 49,959,182,624
Interest income 26,943,365,574 24,944,082,851
Interest expense 12,13 (301,027,932,756) (263,474,390,735)
Others - net 2d,2f,2i,2m,
2n,12,23,24m 9,630,123,767 34,381,842,416
Other Expense - Net 215,165,172,432 154,189,282,844
EQUITY IN NET EARNINGS OF
ASSOCIATED COMPANIES - NET 2b,7 9,686,380,530 18,046,318,226
Deferred 110,640,390,935 333,873,864,342
Total Corporate Income Tax Expense 269,395,088,735 338,126,002,942
NET INCOME 592,802,016,775 739,685,877,628
BASIC EARNINGS PER SHARE 2u 161.03 200.93
Differences Arising
from Restructuring Differences Arising Unrealized
Additional Revaluation Transactions among from Changes Losses on Retained Earnings Net
Paid-in Capital * Increment Entities under in the Equity Available-for-Sale Shareholders’
Notes Capital Stock (Notes 15 and 16) in Fixed Assets Common Control of Subsidiaries Securities - Net Appropriated Unappropriated Equity
Balance as of December 31, 2004 1,840,615,849,500 1,532,486,402,048 - 1,165,715,376,569 5,447,335,825 (3,045,917,820 ) 100,000,000,000 14,574,163,978 4,655,793,210,100
Net income - - - - - - - 739,685,877,628 739,685,877,628
Changes in the equity of a Subsidiary arising from foreign
currency translation adjustment 2b - - - - 1,339,027,011 - - - 1,339,027,011
Realized loss on sale of investments in available-for-sale securities 2b,2d - - - - - 166,314,209 - - 166,314,209
Recovery from decline in market values of investments
in available-for-sale securities 2d - - - - - 554,910,000 - - 554,910,000
Write-off of investments in available-for-sale securities
with permanent decline in market value 2b,2d - - - - - 2,324,693,611 - - 2,324,693,611
Appropriation of retained earnings for general reserve 18 - - - - - - 25,000,000,000 (25,000,000,000 ) -
Change in the equity of a Subsidiary arising from the decline in market values of its investments in available-for-sale
securities 2b,2d - - - - (452,400,000 ) - - - (452,400,000 )
Revaluation increment in fixed assets 8 - 229,970,296,236 - - - - - 229,970,296,236
Balance as of December 31, 2005 1,840,615,849,500 1,532,486,402,048 229,970,296,236 1,165,715,376,569 6,333,962,836 - 125,000,000,000 729,260,041,606 5,629,381,928,795
Net income - - - - - - - 592,802,016,775 592,802,016,775
Changes in the equity of a Subsidiary arising from foreign
currency translation adjustment 2b - - - - (1,458,076,150 ) - - - (1,458,076,150 )
Appropriation of retained earnings for general reserve 18 - - - - - - 25,000,000,000 (25,000,000,000 ) -
Distributions of cash dividends 17 - - - - - - - (184,061,584,950 ) (184,061,584,950 )
Change in the equity of a Subsidiary arising from the decline in market values of its investments in available-for-sale
securities 2b,2d - - - - (3,901,950,000 ) - - - (3,901,950,000 )
Balance as of December 31, 2006 1,840,615,849,500 1,532,486,402,048 229,970,296,236 1,165,715,376,569 973,936,686 - 150,000,000,000 1,113,000,473,431 6,032,762,334,470
The accompanying notes form an integral part of these consolidated financial statements.
CASH FLOWS FROM OPERATING ACTIVITIES
Collections from customers 6,811,980,979,629 5,950,081,359,459
Payments to suppliers and contractors, and for
salaries and other employees’ benefits (4,932,197,408,179) (4,240,613,316,254)
Cash provided by operations 1,879,783,571,450 1,709,468,043,205
Receipts of interest income 22,924,457,557 16,126,669,839
Proceeds from claims for tax refund 11 18,852,275,968 22,644,517,528
Payments of taxes (538,569,746,637) (388,306,921,298)
Payment of interest expense and
other financial charges (207,888,924,625) (39,037,547,060)
Net receipts from other operating activities 20,222,897,936 870,572,669
Net Cash Provided by Operating Activities 1,195,324,531,649 1,321,765,334,883
CASH FLOWS FROM INVESTING ACTIVITIES
Cash dividends received 7 2,099,307,170 12,577,602,055
Proceeds from sale of fixed assets 8 1,933,553,401 551,172,068
Proceeds from sale of marketable securities 138,377,257 103,377,617
Purchases of fixed assets (277,126,849,133) (150,274,790,566)
Net placement of time deposits (8,786,299,848) -
Advance to purchase shares of stock 24a (1,800,000,000) -
Investment in shares of stock (18,150,000) -
Refund of investment in associated company 7 - 6,600,000,000
Net Cash Used in Investing Activities (283,560,061,153) (130,442,638,826)
CASH FLOWS FROM FINANCING ACTIVITIES
Proceeds from long-term borrowings 352,164,804,781 -
Payment of bank loans (872,572,006,605) -
Payment of dividends (162,395,684,385) -
Net payment for derivative transactions (53,724,729,500) (3,211,404,898)
Payment of obligations under capital lease 13 (11,956,542,200) (2,245,547,785)
Net Cash Used in Financing Activities (748,484,157,909) (5,456,952,683)
NET EFFECT OF CHANGES IN EXCHANGE
RATES ON CASH AND CASH EQUIVALENTS (5,199,415,065) 1,590,627,958
NET RECLASSIFICATION OF CASH AND CASH EQUIVALENTS TO OTHER ASSETS
(RESTRICTED CASH AND TIME DEPOSITS) (612,705,016,407) (996,878,506,103)
NET INCREASE (DECREASE) IN CASH AND
CASH EQUIVALENTS (454,624,118,885) 190,577,865,229
CASH AND CASH EQUIVALENTS
AT BEGINNING OF YEAR 3 498,010,383,632 307,432,518,403
CASH AND CASH EQUIVALENTS
AT END OF YEAR 3 43,386,264,747 498,010,383,632
Notes 2006 2005
Activities not affecting cash and cash equivalents: Payment of bank loans from restricted cash
accounts (including debt buy-back of
Rp64,477,910,000 in 2005) 12 1,943,252,376,230 767,339,804,256
Proceeds from long-term borrowings deposited
to restricted cash accounts 12 1,141,479,940,019 -
Payment of interest using restricted cash
accounts 12 93,012,389,053 182,047,495,964
Interest earned on restricted cash accounts 12 1,559,750,096 4,882,240,714
Recognition of revaluation increment in fixed
assets 8 - 328,528,994,622
Payment to facility and security agent using
PT Indocement Tunggal Prakarsa Tbk. (the “Company”) was incorporated in Indonesia on January 16, 1985 based on notarial deed No. 227 of Ridwan Suselo, S.H. Its deed of incorporation was approved by the Ministry of Justice in its decision letter No. C2-2876HT.01.01.Th.85 dated May 17, 1985 and was published in Supplement No. 57 of State Gazette No. 946 dated July 16, 1985. The Company’s articles of association has been amended from time to time, the latest amendment of which was covered by notarial deed No. 57 dated June 28, 2006 of Amrul Partomuan Pohan, S.H., LLM concerning, among others, the change in the members of the Company’s boards of commissioners and directors. Such amendments were registered with the Ministry of Justice and Human Rights on July 24, 2006.
The Company started its commercial operations in 1985.
As stated in Article 3 of the Company’s articles of association, the scope of its activities comprises, among others, the manufacture of cement, building materials, construction and trading. Currently, the Company and Subsidiaries are involved in several businesses consisting of the manufacture and sale of cement (as core business) and ready mix concrete.
The Company’s head office is located at Wisma Indocement 8th Floor, Jl. Jend. Sudirman Kav. 70-71, Jakarta. Its factories are located in Citeureup - West Java, Cirebon - West Java and Tarjun - South Kalimantan.
The cement business includes the operations of the Company’s twelve (12) plants located in three different sites: nine at the Citeureup - Bogor site, two at the Palimanan - Cirebon site and one at the Tarjun - South Kalimantan site, with a total combined annual production capacity of approximately 15.4 million tons of clinker. The ready mix concrete manufacturing business comprises the operation of the Company’s two subsidiaries.
Based on the minutes of the extraordinary general meeting of the Company’s shareholders (EGMS) held on October 2, 1989, which were covered by notarial deed No. 4 of Amrul Partomuan Pohan, S.H., LLM., the shareholders approved, among others, the offering of 598,881,000 shares to the public. Based on the minutes of the EGMS held on March 18, 1991, which were covered by notarial deed No. 53 of the same notary, the shareholders approved the issuance of convertible bonds with a total nominal value of US$75 million. On June 20, 1991, in accordance with the above-mentioned shareholders’ approval, the Company issued and listed US$75 million worth of 6.75% Euro Convertible Bonds (the “Euro Bonds”) on the Luxembourg Stock Exchange at 100% issue price, with an original maturity in 2001. The Euro Bonds were convertible into common shares starting August 1, 1991 up to May 20, 2001 at the option of the bondholders at the initial conversion price of Rp14,450 per share, with a fixed rate of exchange upon conversion of US$1 to Rp1,946.
In 1994, the Company issued 8,555,640 shares on the partial conversion of the Euro Bonds worth US$35,140,000. Accordingly, the Company transferred and reclassified the corresponding portion of the related bonds payable amounting to Rp8,555,640,000 to capital stock and Rp67,320,100,000 to additional paid-in capital. The remaining balance of the Euro Bonds with total nominal value of US$39,860,000 was fully redeemed and settled in 1994.
1. GENERAL (continued)
In the EGMS held on June 25, 1996, the shareholders resolved to split the par value of the Company’s shares from Rp1,000 per share to Rp500 per share. Accordingly, the number of issued and fully paid capital stock was also increased from 1,207,226,660 shares to 2,414,453,320 shares. This shareholders’ resolution was approved by the Ministry of Justice in its decision letter No. C2-HT.01.04.A.4465 dated July 29, 1996.
In the EGMS held on June 26, 2000, the shareholders approved the increase in the Company’s authorized capital stock from Rp2 trillion divided into 4 billion shares with par value of Rp500 per share to Rp4 trillion divided into 8 billion shares with the same par value. Such increase in the Company’s authorized capital stock was approved by the Ministry of Law and Legislation in its decision letter No. C-13322 HT.01.04.TH.2000 dated July 7, 2000.
On December 29, 2000, the Company issued 69,863,127 shares to Marubeni Corporation as a result of the conversion into equity of the latter’s receivable from the Company (debt-to-equity swap).
In the EGMS held on March 29, 2001, the shareholders approved the rights issue offering with pre-emptive rights to purchase new shares at Rp1,200 per share. The total number of shares allocated for the rights issue was 1,895,752,069 shares with an option to receive Warrant C if the shareholders did not exercise their rights under certain terms and conditions.
As of May 1, 2001 (the last exercise date), the total shares issued for rights exercised were as follows:
· 1,196,874,999 shares to Kimmeridge Enterprise Pte., Ltd. (Kimmeridge), a subsidiary of
HeidelbergCement (formerly Heidelberger Zement AG (HZ)) (HC), on April 26, 2001, through the conversion of US$149,886,295 debt
· 32,073 shares to public shareholders.
The number of shares issued for the exercise of Warrant C totaled 8,180 shares.
As of December 31, 2006 and 2005, the members of the Company’s boards of commissioners and directors are as follows:
2006 2005
Board of Commissioners
President Daniel Hugues Jules Gauthier Daniel Hugues Jules Gauthier
Vice President Sudwikatmono Sudwikatmono
Vice President I Nyoman Tjager I Nyoman Tjager
Commissioner Sri Prakash Parikesit Suprapto
Commissioner Lorenz Naeger Lorenz Naeger
Commissioner Bernhard Scheifele Bernhard Scheifele
Commissioner Ali Emir Adiguzel Ali Emir Adiguzel
Board of Directors
President Daniel Eugene Antoine Lavalle Daniel Eugene Antoine Lavalle
Vice President Tedy Djuhar Tedy Djuhar
Director Hans Oivind Hoidalen Hans Oivind Hoidalen
Director Nelson G. D. Borch Nelson G. D. Borch
Director Christian Kartawijaya Christian Kartawijaya
Director Kuky Permana Kumalaputra Thomas Willi Kern
Director Benny Setiawan Santoso Benny Setiawan Santoso
Director Ernst Gerard Jelito Iwa Kartiwa
Total salaries and other compensation benefits paid to the Company’s boards of commissioners and directors amounted to Rp28 billion for the years ended December 31, 2006 and 2005. As of December 31, 2006 and 2005, the Company and Subsidiaries have a total of 6,637 and 6,678 permanent employees, respectively (unaudited).
2. SUMMARY OF SIGNIFICANT ACCOUNTING POLICIES
a. Basis of Preparation of the Consolidated Financial Statements
The accompanying consolidated financial statements have been prepared in accordance with generally accepted accounting principles and practices in Indonesia, which are based on Statements of Financial Accounting Standards (PSAK), the Capital Market Supervisory Agency’s (Bapepam) regulations, and Guidelines for Financial Statements Presentation and Disclosures for publicly listed companies issued by the Bapepam for manufacturing and investment companies. The consolidated financial statements have been prepared on the accrual basis using the historical cost concept of accounting, except for inventories which are valued at the lower of cost or net realizable value (market), derivative instruments and short-term investments which are stated at market values, certain investments in shares of stock which are accounted for under the equity method, and certain fixed assets which are stated at revalued amounts.
The consolidated statements of cash flows present receipts and payments of cash and cash equivalents classified into operating, investing and financing activities. The cash flows from operating activities are presented using the direct method.
The reporting currency used in the preparation of the consolidated financial statements is the Indonesian rupiah.
b. Principles of Consolidation
The consolidated financial statements include the accounts of the Company and those of its direct and indirect subsidiaries (collectively referred to as the “Subsidiaries”) as follows:
2. SUMMARY OF SIGNIFICANT ACCOUNTING POLICIES (continued)
b. Principles of Consolidation (continued)
DAP was established in 1998 for the purpose of acting as the Company’s main domestic distributor of certain cement products.
MBG was acquired in 2004 and is a company which has obtained the right to use (“hak pengelolaan”) the Lembar port in Lombok (where the Company built its terminal), for a period of 20 years from PT (PERSERO) Pelabuhan Indonesia III starting January 1, 2001.
As of December 31, 2006, MBG has not yet started its commercial operations.
The Company also has five (5) other subsidiaries, all with effective percentages of ownership of 99.99%. The total cost of investments in these entities amounted to Rp20,000,000. Since these entities have no activities and the total cost of the investments in these subsidiaries is immaterial, their accounts were no longer consolidated into the consolidated financial statements. Instead, the investments in these subsidiaries are presented as part of “Long-term Investments and Advances to Associated Company” in the consolidated balance sheets. The details of these subsidiaries are as follows:
Year of Country of Total Assets as of Incorporation Domicile December 31, 2006
PT Bhakti Sari Perkasa Abadi 1998 Indonesia 5,000,000 PT Lentera Abadi Sejahtera 1998 Indonesia 5,000,000 PT Mandiri Sejahtera Sentra 1998 Indonesia 5,000,000 PT Sari Bhakti Sejati 1998 Indonesia 5,000,000 PT Makmur Abadi Perkasa Mandiri 1998 Indonesia -
All significant intercompany accounts and transactions have been eliminated.
Investments in associated companies wherein the Company or its Subsidiaries have ownership interests of at least 20% but not exceeding 50% are accounted for under the equity method, whereby the costs of such investments are increased or decreased by the Company’s or Subsidiaries’ share in the net earnings (losses) of the investees since the date of acquisition and are reduced by cash dividends received by the Company or Subsidiaries from the investees. The share in net earnings (losses) of the investees is adjusted for the straight-line amortization, over a twenty-year period (in view of the good future business prospects of the investees), of the difference between the costs of such investments and the Company’s or Subsidiaries’ proportionate share in the fair value of the underlying net assets of investees at date of acquisition (goodwill).
A subsidiary’s investment in an associated company which uses the U.S. dollar as its functional and reporting currency is translated into rupiah using the exchange rate prevailing at balance sheet date, while the equity in the net earnings (losses) of the associated company is translated using the average rate during the year. Exchange differences arising from the translation of the investment are recorded by the Company as “Differences Arising from Changes in the Equity of Subsidiaries” account which is presented under the Shareholders’ Equity section of the consolidated balance sheets.
b. Principles of Consolidation (continued)
In compliance with PSAK No. 38 (Revised 2004), “Accounting for Restructuring of Entities under Common Control”, the differences between the cost/proceeds of net assets acquired/disposed of in connection with restructuring transactions among entities under common control and their net book values are recorded and presented as “Differences Arising from Restructuring Transactions Among Entities under Common Control” under the Shareholders’ Equity section of the consolidated balance sheets. This PSAK also provides for the realization of the restructuring differences to current year operation if the conditions stated in the PSAK are fulfilled.
In compliance with PSAK No. 40, “Accounting for Changes in the Value of Equity of a Subsidiary/ Associated Company”, the differences between the carrying amount of the Company’s investment in, and the value of the underlying net assets of, the subsidiary/investee arising from changes in the latter’s equity which are not resulting from transactions between the Company and the concerned subsidiary/investee, are recorded and presented as “Differences Arising from Changes in the Equity of Subsidiaries” under the Shareholders’ Equity section of the consolidated balance sheets. Accordingly, the resulting difference arising from the change in the equity of PT Indomix Perkasa in connection with its application of the provisions of PSAK No. 50, “Accounting for Investments in Certain Securities”, is recorded and presented under this account (see item d below).
c. Cash Equivalents
Time deposits and other short-term investments with maturities of three months or less at the time of placement or purchase and not pledged as collateral for loans and other borrowings are considered as “Cash Equivalents”.
d. Short-term Investments
Investments in equity securities listed on the stock exchanges are classified as “Short-term Investments”.
Equity securities classified as available-for-sale are stated at market values. Any unrealized gains or losses on appreciation/depreciation in market values of the equity securities are recorded and presented as part of “Unrealized Gains/Losses on Available-for-Sale Securities” under the Shareholders’ Equity section of the consolidated balance sheets. These are credited or charged to operations upon realization.
When a decline in the fair value of an available-for-sale equity securities has been recognized directly to equity and there is objective evidence that the equity securities are impaired, the cumulative losses that had been recognized directly in equity are removed from equity and recognized in profit and loss even though the equity securities have not been derecognized.
e. Allowance for Doubtful Accounts
Allowance for doubtful accounts is provided based on a review of the status of the individual receivable accounts at the end of the year.
f. Transactions with Related Parties
The Company and Subsidiaries have transactions with certain parties which have related party relationships as defined under PSAK No. 7, “Related Party Disclosures”.
2. SUMMARY OF SIGNIFICANT ACCOUNTING POLICIES (continued)
g. Inventories
Inventories are stated at the lower of cost or net realizable value. Cost is determined using the weighted average method, except for spare parts which use the moving average method. Allowance for inventory losses is provided to reduce the carrying value of inventories to their net realizable value.
Net realizable value is the estimated selling price in the ordinary course of business less estimated cost of completion and estimated cost necessary to make the sale.
h. Prepaid Expenses
Prepaid expenses are amortized over the periods benefited using the straight-line method. The non-current portion of prepaid expenses is shown as part of “Other Non-non-current Assets” in the consolidated balance sheets.
i. Fixed Assets
Fixed assets are stated at cost, except for certain assets revalued in accordance with government regulations, less accumulated depreciation, amortization and depletion. Certain machinery and equipment related to the production of cement are depreciated using the unit-of-production method, while all other fixed assets are depreciated using the straight-line method based on their estimated useful lives as follows:
Years
Land improvements; quarry; and buildings and structures 8 - 30
Machinery and equipment 5 - 10
Leasehold improvements; furniture, fixtures and office
equipment; and tools and other equipment 5
Transportation equipment 5
Land is stated at cost and is not depreciated.
Construction in progress is stated at cost. Cost is reduced by the amount of revenue generated from the sale of finished products during the trial production run less the related cost of production. The accumulated cost will be reclassified to the appropriate fixed assets account when the construction is substantially completed and the constructed asset is ready for its intended use.
The costs of maintenance and repairs are charged to operations as incurred; significant renewals and betterments which meet the capitalization criteria under PSAK No. 16, “Fixed Assets”, are capitalized. When assets are retired or otherwise disposed of, their carrying values and the related accumulated depreciation, amortization or depletion are removed from the accounts, and any resulting gains or losses are credited or charged to current operations.
j. Impairment of Assets
k. Leases
Lease transactions are accounted for under the capital lease method when the required capitalization criteria under PSAK No. 30, “Accounting for Leases”, are met. Otherwise, lease transactions are accounted for under the operating lease method. Assets under capital lease (presented as part of “Fixed Assets” in the consolidated balance sheets) are recorded based on the present value of the lease payments at the beginning of the lease term plus residual value (option price) to be paid at the end of the lease period. Depreciation of leased assets is computed based on the methods and estimated useful lives used for similar fixed assets acquired under direct ownership.
Gain on sale-and-leaseback transactions is deferred and amortized using the same basis and methods as mentioned above.
Obligations under capital lease are presented at the present value of the remaining lease payments to be made.
l. Capitalization of Borrowing Costs
In accordance with revised PSAK No. 26, “Borrowing Costs”, interest charges and foreign exchange differences incurred on borrowings and other related costs to finance the construction or installation of major facilities are capitalized. Capitalization of these borrowing costs ceases when the construction or installation is completed and the related asset is ready for its intended use. In 2006 and 2005, no borrowing costs were capitalized.
m. Deferred Charges
In accordance with PSAK No. 47, “Accounting for Land”, costs incurred in connection with the acquisition/renewal of landrights, such as legal fees, land remeasurement fees, notarial fees, taxes and other expenses, are deferred and amortized using the straight-line method over the legal terms of the related landrights.
n. Revenue and Expense Recognition
Revenues are recognized when the products are delivered and the risks and benefits of ownership are transferred to the customers and/or when the services are rendered. Costs and expenses are generally recognized and charged to operations when they are incurred.
o. Provision for Employee Benefits
(i) Retirement Benefits
The Company has a defined contribution retirement plan (Pension Plan) covering all of its qualified permanent employees and an unfunded employee benefit liability determined in accordance with the existing Collective Labor Agreement (CLA). The unfunded employee benefit liability was calculated by comparing the benefit that will be received by an employee at normal pension age from the Pension Plan with the benefit as stipulated in the CLA after deducting the accumulated employee contribution and the related investment results. If the employer-funded portion of the Pension Plan benefit is less than the benefit as required by the CLA, the Company provides for such shortage.
2. SUMMARY OF SIGNIFICANT ACCOUNTING POLICIES (continued)
o. Provision for Employee Benefits (continued)
(i) Retirement Benefits (continued)
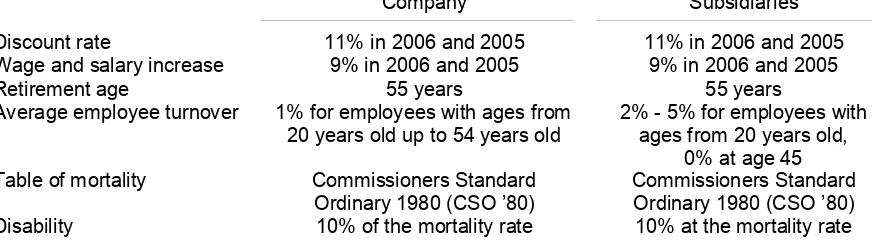
Under PSAK No. 24 (Revised 2004), the cost of providing employee benefits under the CLA/Law is determined using the projected-unit-credit actuarial valuation method. Actuarial gains or losses are recognized as income or expense when the net cumulative unrecognized actuarial gains or losses for each individual plan at the end of the previous reporting year exceed 10% of the present value of the defined benefit obligation at that date. These gains or losses are amortized on a straight-line basis over the expected average remaining working lives of the employees. Further, past service costs arising from the introduction of a defined benefit plan or changes in the benefit payable of an existing plan are required to be amortized over the period until the benefits concerned become vested.
(ii) Post-retirement Healthcare Benefits
In March 2005, the Company issued a policy regarding post-retirement healthcare benefits wherein employees who reach normal retirement age as of January 1, 2003 onwards are entitled to receive healthcare benefits for 5 years from their normal retirement date. The amount of post-retirement healthcare benefits is equivalent to the benefits limited to reimbursement for in-patient hospital bills under the same standard as that which an employee used to have prior to his retirement, for a period not exceeding 60 days per year.
p. Foreign Currency Transactions and Balances
Transactions involving foreign currencies are recorded in rupiah at the middle rates of exchange prevailing at the time the transactions are made. At balance sheet date, monetary assets and liabilities denominated in foreign currencies are adjusted to reflect the rates of exchange quoted at the closing of the last banking day of the year. The resulting gains or losses are credited or charged to current operations, except for those capitalized under PSAK No. 26 (Note 2l).
As of December 31, 2006 and 2005, the rates of exchange used are as follows:
2006 2005
Euro (EUR1) 11,858.15 11,659.87
U.S. dollar (US$1) 9,020.00 9,830.00
Japanese yen (JP¥100) 7,579.53 8,342.18
Transactions in other foreign currencies are insignificant.
q. Derivative Instruments
q. Derivative Instruments (continued)
The accounting for changes in the fair value of a derivative depends on the documented use of the derivative and the resulting designation. The Company has entered into forward and option currency contracts, and also cross currency interest rate swap to hedge market risks arising from fluctuations in exchange rates relating to its foreign currency denominated loans. However, based on the specific requirements for hedge accounting under PSAK No. 55, the said instruments can not be designated as hedge activities for accounting purposes and accordingly, changes in the fair value of such instruments are recorded directly in earnings.
r. Corporate Income Tax
Current tax expense is provided based on the estimated taxable income for the year. Deferred tax assets and liabilities are recognized for temporary differences between the financial and the tax bases of assets and liabilities at each reporting date. Future tax benefits, such as the carry-forward of unused tax losses, are also recognized to the extent that realization of such benefits is probable.
Deferred tax assets and liabilities are measured at the tax rates that are expected to be applied to the period when any of the assets is realized or any of the liabilities is settled, based on tax rates (and tax laws) that have been enacted or substantively enacted at the balance sheet date.
Amendment to a tax obligation is recorded when an assessment is received or, if appealed, when the result of the appeal is determined.
s. Segment Reporting
The Company and Subsidiaries’ businesses are grouped into three major operating businesses: cement, ready mix concrete and other businesses. Financial information on business segments is presented in Note 19.
t. Stock Issuance Costs
Based on decision letter No. KEP-06/PM/2000 dated March 13, 2000 of the Chairman of Bapepam, all costs related to the issuance of equity securities should be offset against additional paid-in capital.
u. Earnings per Share
Basic earnings per share is computed by dividing net income by the weighted average number of shares outstanding during the year, which is 3,681,231,699 shares in 2006 and 2005.
v. Use of Estimates
3. CASH AND CASH EQUIVALENTS
The details of cash and cash equivalents are as follows:
2006 2005
Cash on hand 945,527,897 903,672,897
Cash in banks
PT Bank Central Asia Tbk.
Rupiah 18,398,346,973 4,736,046,427
U.S. dollar (US$60,855 in 2006 and
US$468,385 in 2005) 548,909,304 4,604,224,845
Euro (EUR5,139 in 2006 and
EUR290,674 in 2005) 60,942,827 3,389,219,653
PT Bank Mandiri (Persero) Tbk.
Rupiah 5,268,311,427 19,529,839,532
U.S. dollar (US$323,021 in 2006 and
US$161,058 in 2005) 2,913,650,322 1,583,199,157
Euro (EUR52,531 in 2006 and
EUR668,901 in 2005) 622,925,577 7,799,293,806
ABN-AMRO Bank N.V.
U.S. dollar (US$259,970 in 2006 and
US$316,559 in 2005) 2,344,926,784 3,111,779,492
Rupiah 1,649,410,336 1,447,689,689
Japanese yen (JP¥9,805,537 in 2006 and
JP¥28,641,411 in 2005) 743,213,619 2,389,318,060
Euro (EUR28,921 in 2006 and
EUR455,502 in 2005) 342,952,521 5,311,098,069
The Hongkong and Shanghai Banking Corporation Ltd., Jakarta Branch
Rupiah 3,614,520,665 10,341,049,894
PT Bank Lippo Tbk.
PT Bank Central Asia Tbk. 1,500,000,000 59,500,000,000
Interest rates per annum:
2006 2005
Rupiah time deposits 8.25% - 13.00% 5.00% - 14.00%
U.S. dollar time deposits 3.70% - 5.10% 1.75% - 3.75%
4. TRADE RECEIVABLES
The details of trade receivables are as follows:
2006 2005
Related Party (Note 23)
Cement business
HCT Services Asia Pte., Ltd., Singapore (US$3,984,810 in 2006 and
US$4,872,610 in 2005) 35,942,984,396 47,897,758,168
Third Parties
Cement and ready mix concrete business 592,380,940,788 519,798,926,680
Allowance for doubtful accounts (11,067,732,391) (13,835,340,496)
Net 581,313,208,397 505,963,586,184
The movements of allowance for doubtful accounts are as follows:
2006 2005
Balance at beginning of year 13,835,340,496 13,822,091,743
Provision during the year 2,663,022,870 6,682,663,190
Receivables written off during the year (5,430,630,975) (6,655,585,161)
Reversal of allowance on doubtful accounts
collected during the year - (13,829,276)
Balance at end of year 11,067,732,391 13,835,340,496
Based on the review of the status of the individual receivable accounts at the end of the year, management believes that the above allowance for doubtful accounts is sufficient to cover any possible losses that may arise from uncollectible accounts.
Trade receivables were used as collateral for the long-term loans from banks and financial institutions (Note 12).
4. TRADE RECEIVABLES (continued)
The details of other receivables are as follows:
2006 2005
Claim for tax refund 5,849,231,775 -
Payments for tax assessments being contested 5,502,658,681 5,502,658,681
Others 7,983,052,925 7,318,210,438
Total 19,334,943,381 12,820,869,119
Allowance for doubtful accounts (7,371,980,358) (7,371,980,358)
Net 11,962,963,023 5,448,888,761
The movements of allowance for doubtful accounts are as follows:
2006 2005
Balance at beginning of year 7,371,980,358 8,503,980,725
Receivables written off during the year - (1,130,934,917)
Reversal of allowance on doubtful accounts
collected during the year - (1,065,450)
Balance at end of year 7,371,980,358 7,371,980,358
Based on the review of the status of the individual receivable accounts at the end of the year, management believes that the above allowance for doubtful accounts is sufficient to cover any possible losses that may arise from uncollectible accounts.
6. INVENTORIES
Inventories consist of:
2006 2005
Finished goods 66,209,610,931 68,680,550,631
Work in process 113,362,558,381 108,997,225,500
Raw materials 215,808,190,887 184,632,037,563
Fuel and lubricants 163,152,907,815 201,858,531,698
Spare parts 445,332,570,557 385,307,557,542
Total 1,003,865,838,571 949,475,902,934
Allowance for losses (50,661,601,995) (38,184,113,445)
Net 953,204,236,576 911,291,789,489
With the exception of inventories owned by Indomix Perkasa and PBI amounting to Rp9.65 billion, all of the inventories are insured against fire and other risks under a combined insurance policy package (Note 8).
The inventories were used as collateral for the long-term loans from banks and financial institutions (Note 12).
The movements of allowance for inventory losses are as follows:
2006 2005
Balance at beginning of year 38,184,113,445 44,075,191,481
Provisions during the year 14,258,869,633 812,733,614
Reversals during the year (1,781,381,083) (1,366,739,241)
Inventories written off during the year - (5,337,072,409)
Balance at end of year 50,661,601,995 38,184,113,445
6. INVENTORIES (continued)
Management believes that the above allowance for inventory losses is sufficient to reduce the carrying amounts of inventories to their net realizable values.
The Company made advance payments to several foreign suppliers for the purchase of certain inventories. The outstanding balances of the purchase advances as of December 31, 2006 and 2005 amounting to Rp35,359,059,771 and Rp74,188,520,465, respectively, are presented as part of “Advances and Deposits” in the consolidated balance sheets.
7. LONG-TERM INVESTMENTS AND ADVANCES TO ASSOCIATED COMPANY
The details of this account are as follows:
The principal activities of the above investees are as follows:
Investee Country of Domicile Principal Business Activity Stillwater Shipping Corporation Liberia Shipping
PT Cibinong Center Industrial Estate Indonesia Development of industrial estates PT Pama Indo Mining Indonesia Mining
PT Indo Clean Set Cement Indonesia Production of clean set cement
The details of the equity in net earnings of associated companies, net of goodwill amortization, for the years ended December 31, 2006 and 2005 are as follows:
2006 2005
Stillwater Shipping Corporation 5,934,060,720 11,231,810,109
PT Pama Indo Mining 2,805,446,256 1,860,874,187
PT Cibinong Center Industrial Estate 946,873,554 4,953,633,930
Company’s investment in CCIE was reduced by its proportionate share of Rp6,600,000,000.
The Company and Subsidiaries received cash dividends from PT Pama Indo Mining amounting to Rp2,099,307,170 in 2006 and Rp2,267,602,055 in 2005, and from Stillwater Shipping Corporation amounting to US$1,000,000 (equivalent to Rp10,240,000,000 excluding foreign exchange gain amounting to Rp70 million) in 2005.
Based on the minutes of the shareholders’ extraordinary meeting held on December 30, 2002, which were covered by notarial deed No. 2 dated January 7, 2003 of Notary Deni Thanur, S.E., S.H., M.Kn, the shareholders approved to liquidate PT Indo Clean Set Cement (ICSC). As of December 31, 2006, the liquidation process of ICSC is still ongoing. The additional equity in net losses of ICSC after 2002 has not been recognized in the consolidated financial statements since ICSC has ceased operations and the effects of the additional equity are immaterial to the consolidated financial statements.
8. FIXED ASSETS (continued)
Construction in progress 143,529,316,123 353,609,046,748 198,725,594,225 298,412,768,646
Balance as of Additions/ Disposals/ Balance as of Furniture, fixtures and office equipment 142,480,757,740 22,059,565,326 1,053,136,113 163,487,186,953 Tools and other equipment 41,068,377,149 6,241,398,925 94,929,176 47,214,846,898
* includes revaluation increment on machinery and transportation equipment amounting to Rp273,366,446,892 and Rp55,162,547,730, respectively
Construction in progress consists of:
2006 2005
Machineries under installation 274,629,534,016 128,627,246,888
Buildings and structures under construction 10,633,153,059 2,512,897,805
Others 13,150,081,571 12,389,171,430
8. FIXED ASSETS (continued)
In November 2005, the Company received a decision letter from the Tax Office which approved the revaluation of certain machinery and transportation equipment. The revaluation increment of Rp229,970,296,236 (net of deferred tax of Rp98,558,698,386) is presented in the shareholders’ equity section of the 2005 consolidated balance sheet, while the difference of Rp430,904,292,854 between the revalued amount and the fiscal book value was compensated against the Company’s tax loss carryforward (Note 11). The revaluation was conducted by PT Ujatek Baru, an independent appraiser, using the cost approach.
Fixed assets were used as collateral to secure the long-term loans from banks and financial institutions (Note 12).
Depreciation, amortization and depletion charges amounted to Rp517,178,497,254 in 2006 and Rp468,151,322,175 in 2005.
The Company and Subsidiaries insured their fixed assets and inventories against losses from fire and other insurable risks under several combined policies, with a total insurance coverage of Rp121,617,894,850 and US$2,619,720,480 as of December 31, 2006. In management’s opinion, the above insurance coverage is adequate to cover any possible losses that may arise from such risks.
Based on the review of asset values at the end of the year, management believes that there is no potential impairment in the values of the assets included in the consolidated financial statements.
The Company and Subsidiaries own building/construction rights or “Hak Guna Bangunan” (HGB), land use rights or “Hak Pakai” (HP) and land ownership rights or “Hak Milik” (HM) over land covering approximately 3,221.29 hectares, and local mining rights or “Surat Izin Penambangan Daerah” (SIPD) covering approximately 10,592.36 hectares at several locations in Indonesia, with legal terms ranging from 5 to 30 years. Management believes that such titles of land rights ownerships can be extended upon their expiration.
As of December 31, 2006, the Company is still in the process of obtaining the titles of ownership or rights over land covering a total area of approximately 33,170 square meters. The Company is also in the process of acquiring land rights covering a total area of approximately 2,685,831 square meters. The total expenditures amounting to Rp21,159,959,689 as of December 31, 2006 incurred in relation to the above land rights acquisition process are recorded as part of “Other Non-current Assets” in the consolidated balance sheets.
The Company made advance payments for the purchase of certain machinery, equipment and spare parts from several suppliers. The outstanding balances of the purchase advances as of December 31, 2006 and 2005 amounting to Rp7,524,902,055 and Rp24,590,662,409, respectively, are presented as part of “Other Non-current Assets” in the consolidated balance sheets.
9. SHORT-TERM LOAN
This account consists of the following:
2006 2005
Third Parties - Cement and ready mix concrete business
Rupiah 121,788,354,464 151,647,765,581
U.S. dollar (US$1,184,111 in 2006 and
US$1,013,796 in 2005) 10,680,678,063 9,991,399,978
Other foreign currencies 7,010,613,364 6,856,224,258
Total - Third Parties 139,479,645,891 168,495,389,817
Related Party - Cement business (Note 23) - 2,278,762,995
Total Trade Payables 139,479,645,891 170,774,152,812
10. TRADE PAYABLES (continued)
The above trade payables arose mostly from purchases of raw materials and other inventories from the Company’s main suppliers as follows:
Suppliers Materials Supplied Pertambangan Minyak dan Gas Bumi Negara (PERTAMINA) Fuel
PT Adaro Indonesia Coal
PT Masa Jaya Perkasa Coal
PT Trubaindo Coal Mining Coal Eurocan Pulp & Paper Co. Kraft paper Fujian Qingshan Paper Industry Co., Ltd. Kraft paper
Billerud AB Kraft paper
Value added tax 47,440,362,881 24,142,674,136
Total 69,089,659,782 34,552,510,560
b. The reconciliation between income before corporate income tax expense, as shown in the consolidated statements of income, and estimated taxable income of the Company for the years ended December 31, 2006 and 2005 is as follows:
2006 2005
Income before corporate income tax expense per
consolidated statements of income 862,197,105,510 1,077,811,880,570
Income of Subsidiaries before corporate income
tax expense - net (27,364,594,469) (14,285,907,710)
Reversal of inter-company eliminating entries
during consolidation (5,933,687,695) 72,113,420,472
Income before corporate income tax expense
attributable to the Company 828,898,823,346 1,135,639,393,332
2006 2005
and inventories against allowance) - net 12,477,488,550 (12,942,669,779) Provision for recultivation - net (Note 24q) 5,127,657,297 3,039,909,909
Provision for employee benefits - net 4,138,525,150 12,725,799,127
Provision for post-retirement healthcare
benefits - net 3,148,293,735 4,409,314,000
Depreciation of fixed assets (including
leased assets) (128,420,128,570) (170,004,805,594)
Payments of obligations under capital lease (10,044,519,772) -
Provision for trade discount - (13,543,264,140)
(113,572,683,610) (176,315,716,477)
Permanent differences Non-deductible expenses
Employees’ benefits 50,202,292,026 48,008,153,178
Donations 5,690,585,022 11,879,141,457
Public relations 3,516,640,788 3,877,345,366
Others 1,366,964,286 847,210,613
Income already subjected to final tax (20,404,361,731) (15,333,654,252)
Equity in net earnings of associated
companies - net (3,752,319,810) (6,814,508,117)
Cash dividend income - (74,950,000,000)
36,619,800,581 (32,486,311,755)
Estimated taxable income of the Company 751,945,940,317 926,837,365,100
Estimated tax loss carryforward at beginning of
year (256,930,304,261) (1,627,684,818,624)
Revaluation increment in fixed assets (Note 8) - 430,904,292,854
Corrections by the Tax Office 6,359,790,385 13,012,856,409
Estimated taxable income (tax loss
carryforward at end of year) 501,375,426,441 (256,930,304,261)
Under existing tax regulations, the tax loss carryforward can be utilized within five (5) fiscal years from the date the tax loss is incurred.
11. TAXATION (continued)
The Company’s estimated taxable income for 2005, as stated above, conforms with the amount reported in its 2005 corporate income tax return.
As of the independent auditors’ report date, the Tax Office is conducting an examination of the Company’s 2005 corporate income tax return.
c. The details of corporate income tax expense (benefit) are as follows:
2006 2005
Current
Company 150,395,127,800 -
Subsidiaries 8,359,570,000 4,252,138,600
158,754,697,800 4,252,138,600
Deferred
Company 111,130,899,860 335,084,539,785
Subsidiaries (490,508,925) (1,210,675,443)
d. The calculation of estimated claims for income tax refund is as follows:
2006 2005
Current income tax expense
Company 150,395,127,800 -
Subsidiaries 8,359,570,000 4,252,138,600
Total 158,754,697,800 4,252,138,600
Prepayments of income tax
Company 150,594,431,333 10,368,661,923
Subsidiaries 12,063,244,858 10,201,181,203
Total 162,657,676,191 20,569,843,126
Estimated claims for income tax refund - presented as part of “Prepaid Taxes” in the consolidated balance sheets
Company 199,303,533 10,368,661,923
Subsidiaries 3,771,750,599 6,221,833,272
Total for the current year 3,971,054,132 16,590,495,195
Claims for income tax refund from prior years: Company
2005 10,414,347,319 -
2004 - 8,383,878,232
Subsidiaries 361,252,286 12,622,709,918
In March 2006, the Company received a decision letter from the Tax Office wherein the Tax Office approved to refund the claim for 2004 income tax and increased the 2004 taxable income to Rp57,969,361,654. The difference of Rp6,359,790,385 between the amount of taxable income approved by the Tax Office and the amount reported was recognized as an adjustment to the Company’s tax loss carryforward in 2006.
In March 2005, the Company received a decision letter from the Tax Office wherein the Tax Office approved to refund the claim for 2003 income tax and increased the 2003 taxable income to Rp758,843,760,148. The difference of Rp13,012,856,409 between the amount of taxable income approved by the Tax Office and the amount reported was recognized as an adjustment to the Company’s tax loss carryforward in 2005.
In December 2006, DAP received a decision letter from the Tax Office wherein the Tax Office approved to refund DAP’s 2005 claim for tax refund amounting to Rp5,849,231,775 and is presented as part of “Other Receivables from Third Parties” in the 2006 consolidated balance sheet.
In April 2006, DAP received a decision letter from the Tax Office wherein the Tax Office approved to refund DAP’s 2003 claim for tax refund amounting to Rp3,824,659,200, out of the total claim of Rp3,830,534,868.
In March 2006, DAP received a decision letter from the Tax Office wherein the Tax Office approved to refund DAP’s 2004 claim for tax refund amounting to Rp2,946,642,366, out of the total claim of Rp2,991,878,166.
In February 2004, DAP received a decision letter from the Tax Office wherein the Tax Office approved to refund DAP’s 2002 claim for tax refund amounting to Rp6,195,133,712, out of the total claim of Rp11,605,908,212. DAP has contested the result of the tax assessment and the disapproved portion of the claim has remained as part of “Prepaid Taxes” in the 2005 consolidated balance sheet. Furthermore, on August 16, 2006, the Tax Court issued a decision in favor of DAP and the refund was received by DAP in October 2006. The Tax Office, however, filed an objection to the Tax Court’s decision and asked for a judicial review by the Supreme Court. As of January 22, 2007 (the independent auditors’ report date), the Supreme Court has not rendered any decision on the matter.
e. The reconciliation between income before corporate income tax expense (after the reversal of inter-company eliminating entries during consolidation) multiplied by the applicable tax rate and corporate income tax expense as shown in the consolidated statements of income for the years ended December 31, 2006 and 2005 is as follows:
2006 2005
Income before corporate income tax expense 862,197,105,510 1,077,811,880,570 Reversal of inter-company eliminating entries
during consolidation (5,933,687,695) 72,113,420,472
Combined income, net of loss, before income tax
of the Company and Subsidiaries 856,263,417,815 1,149,925,301,042
11. TAXATION (continued)
2006 2005
Tax expense at the applicable tax rate 256,826,525,024 344,942,589,901
Tax effects on permanent differences:
Non-deductible expenses 19,007,464,625 20,137,594,656
Income already subjected to final tax (7,216,463,107) (6,439,377,804)
Equity in net earnings of associated
companies - net (1,125,695,943) (2,044,352,435)
Cash dividend income - (22,485,000,000)
Others (27,820,259) (124,066,688)
Tax corrections 1,931,078,395 4,138,615,312
Corporate income tax expense per consolidated
statements of income 269,395,088,735 338,126,002,942
f. Deferred tax assets (liabilities) consist of:
Deferred Tax
Estimated liability for employee benefits 13,156,508,384 1,241,557,545 14,398,065,929 Allowance for doubtful accounts and
inventory losses 9,412,817,503 3,743,246,565 13,156,064,068 Reserve for recultivation 3,814,876,992 1,538,297,189 5,353,174,181 Obligation under capital lease - 2,635,889,954 2,635,889,954 Estimated liability for post-
retirement healthcare benefits 1,322,794,200 944,488,121 2,267,282,321 Tax loss carryforward 77,079,091,278 (77,079,091,278 ) - Others 833,851,800 - 833,851,800
Sub-total 105,619,940,157 (66,975,611,904 ) 38,644,328,253 Subsidiaries 6,566,388,568 1,076,090,653 7,642,479,221
Total 112,186,328,725 (65,899,521,251 ) 46,286,807,474
accounting bases (600,757,677,552) (38,589,443,368) (639,347,120,920) Net book value of assets under
capital lease - (5,565,844,588) (5,565,844,588)
Sub-total (600,757,677,552) (44,155,287,956) (644,912,965,508) Subsidiaries (1,162,146,908) (585,581,728) (1,747,728,636)
Total (601,919,824,460) (44,740,869,684) (646,660,694,144)
Net Deferred Tax Assets:
Subsidiaries 5,404,241,660 490,508,925 5,894,750,585
Net Deferred Tax Liabilities:
Company (495,137,737,395) (111,130,899,860) (606,268,637,255)
Deferred Tax Benefit (Expense) Allowance for doubtful accounts
and inventory losses 13,295,618,437 (3,882,800,934) - 9,412,817,503
Total 523,802,677,491 (282,579,819,299) (129,036,529,467) 112,186,328,725
Deferred Tax Liabilities:
Management believes that the above deferred tax assets can be fully recovered in future periods.
12. LONG-TERM LOANS FROM BANKS AND FINANCIAL INSTITUTIONS
This account consists of loans from:
2006 2005
Third parties
Rupiah 331,578,947,368 56,966,532,575
U.S. dollar 299,084,210,555 1,045,147,844,896
Japanese yen 242,241,778,800 1,293,476,690,326
Sub-total 872,904,936,723 2,395,591,067,797
12. LONG-TERM LOANS FROM BANKS AND FINANCIAL INSTITUTIONS (continued)
Less current maturities 252,930,774,797 393,200,000,000
Long-term maturities 1,972,974,161,926 3,476,891,067,797
The balances of the above loans in their original currencies are as follows:
2006 2005*
Rupiah
Third parties
PT Bank Central Asia Tbk. 331,578,947,368 40,891,386,095
PT Bank Mandiri (Persero) Tbk. - 16,075,146,480
Total rupiah loans 331,578,947,368 56,966,532,575
Bayerische Hypo und Vereinsbank AG, Singapore - 15,611,392
Other creditors (each below US$10 million) - 61,435,464
Japan Bank for International Cooperation, Tokyo - 2,495,181,503
Total Japanese yen loans JP¥ 3,196,000,000 JP¥ 15,505,259,900
*based on the confirmation from JPMorgan Chase Bank, N.A., as the facility agent
The ranges of interest rates per annum for the above indebtedness are as follows:
2006 2005
Japanese yen 1.01% - 3.80% 2.30% - 3.80%
U.S. dollar 5.25% - 6.88% 3.37% - 6.17%