Consolidated Financial Statements
Three Months Ended March 31, 2005 and 2004
CONSOLIDATED FINANCIAL STATEMENTS THREE MONTHS ENDED MARCH 31, 2005 AND 2004
Table of Contents
Page
Consolidated Balance Sheets ………. 1-2
Consolidated Statements of Income ……….. 3
Consolidated Statements of Changes in Shareholders’ Equity ………. 4
Consolidated Statements of Cash Flows ……….. 5
Notes to the Consolidated Financial Statements .……… 6-47
Notes 2005 2004
ASSETS
CURRENT ASSETS
Cash and cash equivalents 2c,3 361,549,478,050 414,509,193,205
Short-term investments 2d 9,815,112,650 5,556,047,050
Trade receivables 2e,4,11
Related party 2f,21 23,604,552,326 10,127,152,985
Third parties - net of allowance for doubtful accounts of Rp13,942,091,743
in 2005 and Rp13,332,091,743in 2004 22e 391,742,264,168 282,782,482,699
Other receivables from third parties - net of allowance for doubtful accounts of
Rp7,373,045,808 in 2005 and 2e,2q,
Rp1,389,089,659 in 2004 5,22m 27,188,812,855 20,751,194,830
Inventories - net 2g,6,11 738,513,718,956 695,437,124,779
Advances and deposits 6 62,255,568,038 55,980,659,719
Prepaid taxes 10 46,948,809,486 50,134,591,740
Prepaid expenses 2h 29,043,948,712 44,395,004,528
TOTAL CURRENT ASSETS 1,690,662,265,241 1,579,673,451,535
NON-CURRENT ASSETS
Due from related parties 2f,21 64,022,266,092 65,535,994,418
Deferred tax assets - net 2r,10 3,958,532,827 3,534,953,508
Long-term investments and advances to
associated companies - net of allowance for doubtful accounts of Rp13,720,944,026 in
2005 and Rp13,431,144,026 in 2004 2b,2f,7 45,171,836,469 26,604,668,925
Fixed assets - net of accumulated depreciation, amortization and depletion of
Rp3,496,000,714,273 in 2005 and 2i,2j,2k,2l,
Rp3,018,343,082,828 in 2004 8,11 7,690,263,762,086 8,083,607,731,697
Restricted cash and time deposits 11,12 289,963,629,909 311,621,263,555
Other non-current assets 2h,2m,8 74,663,213,491 32,498,972,006
TOTAL NON-CURRENT ASSETS 8,168,043,240,874 8,523,403,584,109
TOTAL ASSETS 9,858,705,506,115 10,103,077,035,644
The accompanying notes form an integral part of these consolidated financial statements.
Other payables to third parties 8,22d,22m 112,259,484,915 48,181,058,000
Accrued expenses 2f,11,18,21 111,665,799,896 109,257,989,000
Taxes payable 2r,10 47,984,407,756 42,786,475,922
Current maturities of long-term liabilities
Loans from banks and financial institutions 2f,11,21 379,200,000,000 558,155,000,000
Obligations under capital lease 2k,8,12 1,912,022,428 2,193,967,666
Others 2o,20,22l 9,084,518,190 6,062,667,633
Other current liabilities 15,474,946,676 6,707,925,300
TOTAL CURRENT LIABILITIES 785,908,173,637 850,957,015,976
NON-CURRENT LIABILITIES
Due to related parties 2f,21 3,576,050,432 4,714,173,292
Deferred tax liabilities - net 2r,10 131,683,591,548 230,688,838
Long-term liabilities - net of current maturities
Loans from banks and financial institutions 2f,11,21 4,076,420,085,501 4,686,454,967,788
Obligations under capital lease 2k,8,12 1,553,766,818 3,063,099,614
Others 2o,20,22l 41,040,243,741 17,272,253,276
Deferred gain on sale-and-leaseback
transactions - net 2k 9,173,524,296 10,316,791,951
TOTAL NON-CURRENT LIABILITIES 4,263,447,262,336 4,722,051,974,759
SHAREHOLDERS’ EQUITY
Capital stock - Rp500 par value per share
Authorized - 8,000,000,000 shares
Issued and fully paid - 3,681,231,699 shares 13 1,840,615,849,500 1,840,615,849,500
Additional paid-in capital 2t,14 1,194,236,402,048 1,194,236,402,048
Other paid-in capital 15 338,250,000,000 338,250,000,000
Differences arising from changes in the equity
of Subsidiaries 2b 9,612,382,709 (1,293,791,078)
Differences arising from restructuring transactions among entities under
common control 2b (330,799,198,508) (330,799,198,508)
Unrealized losses on available-for-sale
securities - net 2d (3,045,917,820) (3,007,183,420)
Retained earnings
Appropriated 16 100,000,000,000 75,000,000,000
Unappropriated 1,660,480,552,213 1,417,065,966,367
NET SHAREHOLDERS’ EQUITY 4,809,350,070,142 4,530,068,044,909
TOTAL LIABILITIES AND SHAREHOLDERS’ EQUITY 9,858,705,506,115 10,103,077,035,644
NET REVENUES 2f,2n,17,
21,22e,22g 1,202,336,548,699 954,155,422,891
COST OF REVENUES 2f,2n,18, 20,
21,22h,22i,22j 762,982,326,784 648,726,247,131
GROSS PROFIT 439,354,221,915 305,429,175,760
OPERATING EXPENSES 2f,2n,19,20,
21,22d,22f
Delivery and selling 124,206,563,260 99,982,913,514
General and administrative 43,617,449,486 38,606,805,062
Total Operating Expenses 167,824,012,746 138,589,718,576
INCOME FROM OPERATIONS 271,530,209,169 166,839,457,184
OTHER INCOME (EXPENSES)
Interest income 3 4,525,970,387 3,225,715,447
Foreign exchange loss - net 2p,2q,22m (37,988,042,388) (121,001,231,506)
Interest expense 11 (44,756,159,112) (46,984,456,403)
Others - net 2m 25,533,334,073 1,853,184,881
Other Expenses - Net (52,684,897,040) (162,906,787,581)
EQUITY IN NET EARNINGS OF
ASSOCIATED COMPANIES - NET 2b,7 2,256,329,343 1,739,788,369
INCOME BEFORE CORPORATE INCOME
TAX EXPENSE 221,101,641,472 5,672,457,972
CORPORATE INCOME TAX EXPENSE 2r,10
Current 1,285,702,600 4,988,401,750
Deferred 70,424,125,714 3,683,402,352
Total Corporate Income Tax Expense 71,709,828,314 8,671,804,102
NET INCOME (LOSS) 149,391,813,158 (2,999,346,130)
BASIC EARNINGS (LOSSES) PER SHARE 2u 40.58 (0.81)
The accompanying notes form an integral part of these consolidated financial statements.
Differences Arising
from Restructuring Unrealized
Additional Differences Arising Transactions Among Losses on Retained Earnings Net Paid-in Capital * from Changes in the Entities Under Available-for-Sale Shareholders'
Notes Capital Stock (Notes 14 and 15) Equity of Subsidiaries Common Control Securities - Net Appropriated Unappropriated Equity
Balance as of December 31, 2003 1,840,615,849,500 1,532,486,402,048 (841,391,078 ) (330,799,198,508 ) (3,069,178,320 ) 75,000,000,000 1,420,065,312,497 4,533,457,796,139
Net loss - - - - - - (2,999,346,130 ) (2,999,346,130 ) Recovery from decline in market values of investments in
available-for-sale securities 2d - - - - 61,994,900 - - 61,994,900 Change in Subsidiary's equity arising from the decline
in market values of its investments in available-
for-sale securities 2b, 2d - - (452,400,000 ) - - - - (452,400,000 )
Balance as of March 31, 2004 1,840,615,849,500 1,532,486,402,048 (1,293,791,078 ) (330,799,198,508 ) (3,007,183,420 ) 75,000,000,000 1,417,065,966,367 4,530,068,044,909
Balance as of December 31, 2004 1,840,615,849,500 1,532,486,402,048 5,447,335,825 (330,799,198,508) (3,045,917,820 ) 100,000,000,000 1,511,088,739,055 4,655,793,210,100
Net income - - - 149,391,813,158 149,391,813,158 Changes in the equity of a Subsidiary arising from
foreign currency translation adjustment 2b - - 319,646,884 - - - - 319,646,884 Changes in the equity of a Subsidiary arising from the
recovery from decline in market values of its
investments in available-for-sale securities 2b,2d - - 3,845,400,000 - - - - 3,845,400,000
Balance as of March 31, 2005 1,840,615,849,500 1,532,486,402,048 9,612,382,709 (330,799,198,508) (3,045,917,820 ) 100,000,000,000 1,660,480,552,213 4,809,350,070,142
CASH FLOWS FROM OPERATING ACTIVITIES
Collections from customers 1,329,297,528,436 1,062,032,896,848
Payments to suppliers and contractors, and for
salaries and other employees’ benefits (944,234,296,235) (723,135,554,982)
Cash provided by operations 385,063,232,201 338,897,341,866
Receipts of interest income 2,652,445,282 2,658,053,038
Payments of taxes (77,417,867,952) (74,794,289,317)
Net receipts from other operating activities 15,930,408,864 17,736,492,371
Net Cash Provided by Operating Activities 326,228,218,395 284,497,597,958
CASH FLOWS FROM INVESTING ACTIVITIES
Proceeds from sale of fixed assets 8 16,397,068 9,200,000
Purchases of fixed assets (38,061,171,694) (15,624,351,268)
Net Cash Used in Investing Activities (38,044,774,626) (15,615,151,268)
CASH FLOWS FROM FINANCING ACTIVITIES
Net proceeds from derivative transactions 2,592,204,500 -
Payment of obligations under capital lease 12 (572,399,918) -
Net Cash Provided by Financing Activities 2,019,804,582 -
NET EFFECT OF CHANGES IN EXCHANGE
RATES ON CASH AND CASH EQUIVALENTS 530,752,926 2,830,930,953
NET RECLASSIFICATION OF CASH AND CASH EQUIVALENTS TO OTHER ASSETS (RESTRICTED
CASH AND TIME DEPOSITS) (236,617,041,630) (157,288,938,891)
NET INCREASE IN CASH AND CASH
EQUIVALENTS 54,116,959,647 114,424,438,752
CASH AND CASH EQUIVALENTS
AT BEGINNING OF PERIOD 3 307,432,518,403 300,084,754,453
CASH AND CASH EQUIVALENTS
AT END OF PERIOD 3 361,549,478,050 414,509,193,205
Activities not affecting cash and cash equivalents: Payment of bank loans from restricted cash
accounts 11 153,164,422,824 179,502,324,406
Payment of interest using restricted cash
accounts 11 37,851,862,502 41,680,659,805
Interest earned on restricted cash accounts 11 843,031,532 428,477,220
Payments to facility and security agents using
1. GENERAL
PT Indocement Tunggal Prakarsa Tbk. (the “Company”) was incorporated in Indonesia on January 16, 1985 based on notarial deed No. 27 of Ridwan Suselo, S.H. Its deed of incorporation was approved by the Ministry of Justice in its decision letter No. C2-2876HT.01.01.Th.85 dated May 17, 1985 and was published in Supplement No. 57 of State Gazette No. 946 dated July 16, 1985. The Company’s articles of association has been amended from time to time, the latest amendment of which was covered by notarial deed No. 15 dated February 23, 2005 of Amrul Partomuan Pohan, S.H., LLM. concerning, among others, the change in the members of the Company’s boards of commissioners. Such amendments were registered with the Ministry of Justice and Human Rights.
The Company started its commercial operations in 1985.
As stated in Article 3 of the Company’s articles of association, the scope of its activities comprises, among others, the manufacture of cement, building materials, construction and trading. Currently, the Company and Subsidiaries are involved in several businesses consisting of the manufacture and sale of cement (as core business) and ready mix concrete.
The Company’s head office is located at Wisma Indocement 8th Floor, Jl. Jend. Sudirman Kav 70-71,
Jakarta. Its factories are located in Citeureup West Java, Cirebon West Java, and Tarjun -South Kalimantan.
The cement business includes the operations of the Company’s twelve (12) plants located in three different sites: nine at the Citeureup - Bogor site, two at the Palimanan - Cirebon site and one at the Tarjun - South Kalimantan site, with a total combined annual production capacity of approximately 15.4 million tons of clinker. The ready mix concrete manufacturing business comprises the operation of the Company’s two subsidiaries.
Based on the minutes of the extraordinary general meeting of the Company’s shareholders (EGMS) held on October 2, 1989, which were covered by notarial deed No. 4 of Amrul Partomuan Pohan, S.H., LLM., the shareholders approved, among others, the offering of 598,881,000 shares to the public. Also, based on the minutes of the EGMS held on March 18, 1991, which were covered by notarial deed No. 53 of the same notary, the shareholders approved the issuance of convertible bonds with a total nominal value of US$75 million.
On June 20, 1991, in accordance with the above-mentioned shareholders’ approval, the Company issued and listed US$75 million worth of 6.75% Euro Convertible Bonds (the “Euro Bonds”) on the Luxembourg Stock Exchange at 100% issue price, with an original maturity in 2001 if these were not converted into shares. The Euro Bonds were convertible into common shares starting August 1, 1991 up to May 20, 2001 at the option of the bondholders at the initial conversion price of Rp14,450 per share, with a fixed rate of exchange upon conversion of US$1 to Rp1,946.
In the EGMS held on June 15, 1994, the shareholders approved the increase in the Company’s authorized capital stock from Rp750 billion to Rp2,000 billion, and the issuance of one bonus share for every share held by the shareholders as of August 23, 1994, or a total of 599,790,020 bonus shares.
In the EGMS held on June 26, 1996, the shareholders resolved to split the par value of the Company’s shares from Rp1,000 per share to Rp500 per share. Accordingly, the number of issued and paid-in capital stock was also increased from 1,207,226,660 shares to 2,414,453,320 shares. This shareholders’ resolution was approved by the Ministry of Justice in its decision letter No. C2-HT.01.04.A.4465 dated July 29, 1996.
On December 29, 2000, the Company issued 69,863,127 shares to Marubeni Corporation as a result of the conversion into equity of the latter’s receivable from the Company (debt-to-equity swap).
In the EGMS held on March 29, 2001, the shareholders approved the rights issue offering with pre-emptive rights to purchase new shares at Rp1,200 per share. The total number of shares allocated for the rights issue was 1,895,752,069 shares with an option to receive Warrant C if the shareholders did
not exercise their rights under certain terms and conditions stated in Note 13.
As of May 1, 2001 (the last exercise date), the total shares issued for rights exercised were as follows:
• 1,196,874,999 shares to Kimmeridge Enterprise Pte., Ltd. ("Kimmeridge"), a subsidiary of
HeidelbergCement (formerly Heidelberger Zement AG (HZ)) (HC), on April 26, 2001, through the conversion of US$149,886,295 debt.
• 32,073 shares to public shareholders.
The number of shares issued for the exercise of Warrant C totaled 8,180 shares.
On November 20, 2003, the Company received a copy of a letter from HC Indocement GMBH to the Chairman of the Badan Pengawas Pasar Modal (Bapepam) regarding the transfer of 2,254,739,197 shares of the Company from Kimmeridge Enterprise Pte., Ltd., to HC Indocement GMBH.
On December 1, 2003, the Company received a copy of a letter from HC Indocement GMBH to the Chairman of the Bapepam which states that HC Indocement GMBH has purchased 143,241,666 shares from the Government of the Republic Indonesia (GOI) through the exercise of the put option of GOI on October 30, 2003. After this acquisition, the number of shares owned by HC Indocement GMBH totaled 2,397,980,863 shares.
As of March 31, 2005 and 2004, the members of the Company’s boards of commissioners and directors are as follows:
2005 2004
Board of Commissioners
President Daniel Hugues Jules Gauthier Paul Marie Vanfrachem
Vice President Sudwikatmono Sudwikatmono
Vice President I Nyoman Tjager I Nyoman Tjager
Commissioner DR. Bernd Scheifele Hans Erwin Bauer
Commissioner Parikesit Suprapto Parikesit Suprapto
Commissioner Emir Adiguzel Hans Hakan Fernvik
Commissioner Lorenz Naeger Horst Robert Wolf
Commissioner - Ibrahim Risjad
1. GENERAL (continued)
2005 2004
Board of Directors
President Daniel Eugene Antoine Lavalle Daniel Eugene Antoine Lavalle
Vice President Tedy Djuhar Tedy Djuhar
Director Thomas Willi Kern Thomas Willi Kern
Director Hans Oivind Hoidalen Hans Oivind Hoidalen
Director Iwa Kartiwa Iwa Kartiwa
Director Nelson G. D. Borch Nelson G. D. Borch
Director Benny Setiawan Santoso Benny Setiawan Santoso
Director Christian Kartawijaya Bradley Reginald Taylor
Director Philippe Albert Kaplan
-Total salaries and other compensation benefits paid to the Company’s boards of commissioners and directors amounted to Rp7 billion and Rp6.8 billion for the three months ended March 31, 2005 and 2004, respectively. As of March 31, 2005 and 2004, the Company and Subsidiaries have a total of 6,815 and 7,045 permanent employees, respectively.
2. SUMMARY OF SIGNIFICANT ACCOUNTING POLICIES
a. Basis of Preparation of the Consolidated Financial Statements
The accompanying consolidated financial statements have been prepared in accordance with generally accepted accounting principles and practices in Indonesia, which are based on Statements of Financial Accounting Standards (PSAK), the Capital Market Supervisory Agency’s (Bapepam) regulations, and Guidelines for Financial Statements Presentation and Disclosures for publicly listed companies issued by the Bapepam for manufacturing and investment companies. The consolidated financial statements have been prepared on the accrual basis using the historical cost concept of accounting, except for inventories which are valued at the lower of cost or net realizable value (market), derivative instruments and short-term investments which are stated at market values, certain investments in shares of stock which are accounted for under the equity method, and certain fixed assets which are stated at revalued amounts.
The consolidated statements of cash flows present receipts and payments of cash and cash equivalents classified into operating, investing and financing activities. The cash flows from operating activities are presented using the direct method.
The reporting currency used in the preparation of the consolidated financial statements is the Indonesian rupiah.
b. Principles of Consolidation
The consolidated financial statements include the accounts of the Company and those of its direct and indirect subsidiaries (collectively referred to as the “Subsidiaries”) as follows:
b. Principles of Consolidation (continued)
DAP was established in 1998 for the purpose of acting as the Company’s main domestic distributor of certain cement products.
On July 9, 2004, DAP and Indomix, subsidiaries, acquired 1,000 shares of MBG at book value, representing 100% ownership from PT Total Galaxy and Mr. Freddysun, third parties. MBG is a company which has obtained the right to use (“hak pengelolaan”) the Lembar port (Lombok), where the Company built its terminal, for 20 years from PT (PERSERO) Pelabuhan Indonesia III since January 1, 2001.
As of March 31, 2005, MBG has not yet started its commercial operations.
The Company also has five (5) other subsidiaries, all with effective percentages of ownership of 99.99%. The total cost of investments in these entities amounted to Rp20,000,000. Since these entities have no activities and the total cost of the investments in these subsidiaries is immaterial, their accounts were no longer consolidated into the consolidated financial statements. Instead, the investments in these subsidiaries are presented as part of “Long-term Investments and Advances to Associated Companies” in the consolidated balance sheets. The details of these subsidiaries are as follows:
2. SUMMARY OF SIGNIFICANT ACCOUNTING POLICIES (continued)
b. Principles of Consolidation (continued)
Investments in associated companies wherein the Company or its Subsidiaries have ownership interests of at least 20% but not exceeding 50% are accounted for under the equity method, whereby the costs of such investments are increased or decreased by the Company’s or Subsidiaries’ share in the net earnings (losses) of the investees since the date of acquisition and are reduced by cash dividends received by the Company or Subsidiaries from the investees. The share in net earnings (losses) of the investees is adjusted for the straight-line amortization, over a twenty-year period (in view of the good future business prospects of the investees), of the difference between the costs of such investments and the Company’s or Subsidiaries’ proportionate share in the book value of the underlying net assets of investees at date of acquisition (goodwill).
A subsidiary’s investment in an associated company which uses the U.S. dollar as its functional and reporting currency is translated into rupiah using the exchange rate prevailing at balance sheet date, while the equity in the net earnings (losses) of the associated company is translated using the average rate during the year. Exchange differences arising from the translation of the investment are recorded by the Company as “Differences Arising from Changes in the Equity of Subsidiaries” account which is presented under the Stockholders’ Equity section of the consolidated balance sheets.
All other investments are carried at cost.
In compliance with PSAK No. 38, “Accounting for Restructuring Transactions Among Entities under Common Control”, the differences between the cost/proceeds of net assets acquired/disposed in connection with restructuring transactions among entities under common control compared to their net book values are recorded and presented as “Differences Arising from Restructuring Transactions Among Entities under Common Control” under the Shareholders’ Equity section of the consolidated balance sheets.
In compliance with PSAK No. 40, “Accounting for Changes in the Value of Equity of a Subsidiary/ Associated Company”, the difference between the carrying amount of the Company’s investment in, and the value of the underlying net assets of, the subsidiary/investee arising from changes in the latter’s equity which are not resulting from transactions between the Company and the concerned subsidiary/investee, is recorded and presented as “Differences Arising from Changes in the Equity of Subsidiaries” under the Shareholders’ Equity section of the consolidated balance sheets. Accordingly, the resulting difference arising from the changes in equity of PT Indomix Perkasa in connection with its application of the provisions of PSAK No. 50, “Accounting for Investments in
Certain Securities”, is recorded and presented under this account (see item d below).
c. Cash Equivalents
Time deposits and other short-term investments with maturities of three months or less at the time of placement or purchase and not pledged as collateral for loans and other borrowings are considered as “Cash Equivalents”.
d. Short-term Investments
Investments in equity securities listed on the stock exchanges are classified as “Short-term Investments”.
e. Allowance for Doubtful Accounts
Allowance for doubtful accounts is provided based on a review of the status of the individual receivable accounts at the end of the year.
f. Transactions with Related Parties
The Company and Subsidiaries have transactions with certain parties which have related party relationships as defined under PSAK No. 7, “Related Party Disclosures”.
All significant transactions and balances with related parties, whether or not conducted using terms and conditions similar to those granted to third parties, are disclosed in Note 21.
g. Inventories
Inventories are stated at the lower of cost or net realizable value. Cost is determined using the moving average method. Allowance for inventory losses is provided to reduce the carrying value of inventories to their net realizable values.
Net realizable value is the estimated selling price in the ordinary course of business, less estimated cost of completion and estimated cost necessary to make the sale.
h. Prepaid Expenses
Prepaid expenses are amortized over the periods benefited using the straight-line method. The non-current portion of prepaid expenses is shown as part of “Other Non-non-current Assets” in the consolidated balance sheets.
i. Fixed Assets
Fixed assets are stated at cost, except for certain assets revalued in accordance with government regulations, less accumulated depreciation, amortization and depletion. Certain machinery and equipment related to the production of cement are depreciated using the unit-of-production method, while all other fixed assets are depreciated using the straight-line method based on their estimated useful lives as follows:
Years
Land improvements; quarry; and buildings and structures 8 - 30
Machinery and equipment 5 - 10
Leasehold improvements; furniture, fixtures and office
equipment; and tools and other equipment 5
Transportation equipment 5
Land is stated at cost and is not depreciated.
Construction in progress is stated at cost (see item l below). Cost is reduced by the amount of
2. SUMMARY OF SIGNIFICANT ACCOUNTING POLICIES (continued)
i. Fixed Assets (continued)
The costs of maintenance and repairs are charged to operations as incurred; significant renewals and betterments which meet the capitalization criteria under PSAK No. 16, “Fixed Assets”, are capitalized. When assets are retired or otherwise disposed of, their carrying values and the related accumulated depreciation, amortization or depletion are removed from the accounts, and any resulting gains or losses are credited or charged to current operations.
j. Impairment of Assets
The recoverable amount of an asset is estimated whenever events or changes in circumstances indicate that its carrying amount may not be fully recoverable. Impairment in asset value, if any, is recognized as a loss in the current year’s statement of income.
k. Leases
Lease transactions are accounted for under the capital lease method when the required capitalization criteria under PSAK No. 30, “Accounting for Leases”, are met. Otherwise, lease transactions are accounted for under the operating lease method. Assets under capital lease (presented as part of “Fixed Assets” in the consolidated balance sheets) are recorded based on the present value of the lease payments at the beginning of the lease term plus residual value (option price) to be paid at the end of the lease period. Depreciation of leased assets is computed based on the methods and estimated useful lives used for similar fixed assets acquired under direct ownership.
Gain on sale-and-leaseback transaction is deferred and amortized using the same basis and methods as mentioned above.
Obligations under capital lease are presented at the present value of the remaining lease payments to be made.
l. Capitalization of Borrowing Costs
In accordance with revised PSAK No. 26, “Borrowing Costs”, interest charges and foreign exchange differences incurred on borrowings and other related costs to finance the construction or installation of major facilities are capitalized. Capitalization of these borrowing costs ceases when the construction or installation is completed and the related asset is ready for its intended use. In 2005 and 2004, no borrowing costs were capitalized.
m. Deferred Charges
In accordance with PSAK No. 47, “Accounting for Land”, costs incurred in connection with the acquisitions/renewal of landrights, such as legal fees, land remeasurement fees, notarial fees, taxes and other expenses, are deferred and amortized using the straight-line method over the legal terms of the related landrights.
n. Revenue and Expense Recognition
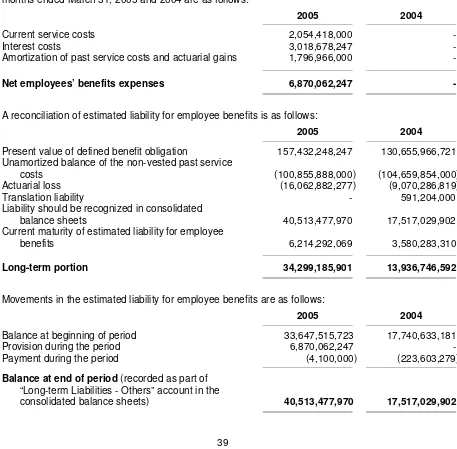
o. Provision for Employee Benefits
The Company has a defined contribution retirement plan (Pension Plan) covering all of its qualified permanent employees and an unfunded employee benefit liability in accordance with the existing Company’s Collective Labor Agreement (CLA). The provision for the CLA has been calculated by comparing the benefit that will be received by an employee at normal pension age from the Pension Plan with the benefit as stipulated in the CLA after deducting the accumulated employee contribution and the related investment results. If the employer-funded portion of the Pension Plan benefit is less than the benefit as required by the CLA, the Company provides for such shortage. Prior to January 1, 2004, the Company determined its employee benefit liability under the CLA based on an actuarial valuation and amortized unrecognized past service costs over the estimated average remaining years of service of qualified employees.
On the other hand, the Subsidiaries do not maintain any pension plan for the benefit of their employees. However, retirement benefit expenses for those Subsidiaries are accrued based on Labor Law No. 13/2003 dated March 25, 2003 (“the Law”).
Effective January 1, 2004, the Company decided to early adopt PSAK No. 24 (Revised 2004) - Employee Benefits, on a retrospective basis and changed its previous accounting method for employee benefits to the method required under this revised PSAK.
Under PSAK No. 24 (Revised 2004), the cost of providing employee benefits under the CLA/Law is determined using the projected unit credit actuarial valuation method. Actuarial gains and losses are recognized as income or expense when the net cumulative unrecognized actuarial gains and losses for each individual plan at the end of the previous reporting year exceeds the higher of 10% of the present value of defined benefit obligation and the fair value of plan assets at that date. These gains or losses are amortized on a straight-line basis over the expected average remaining working lives of the employees. Further, past service costs arising from the introduction of a defined benefit plan or changes in the benefit payable of an existing plan are required to be amortized over the period until the benefits concerned become vested.
p. Foreign Currency Transactions and Balances
Transactions involving foreign currencies are recorded in rupiah at the middle rates of exchange prevailing at transaction date. At balance sheet date, monetary assets and liabilities denominated in foreign currencies are adjusted to reflect the rates of exchange quoted at the closing of the last banking day of the year. The resulting gains or losses are credited or charged to current operations, except for those capitalized under PSAK No. 26.
As of March 31, 2005 and 2004, the rates of exchange used are as follows:
2005 2004
Euro (EUR1) 12,249.12 10,486.89
U.S. dollar (US$1) 9,480.00 8,587.00
Japanese yen (JP¥100) 8,848.25 8,212.13
2. SUMMARY OF SIGNIFICANT ACCOUNTING POLICIES (continued)
q. Derivative Instruments
PSAK No. 55, “Accounting for Derivative Instruments and Hedging Activities”, establishes the accounting and reporting standards requiring that every derivative instrument (including certain derivatives embedded in other contracts) be recorded in the balance sheets as either an asset or liability measured at its fair value. PSAK No. 55 requires that changes in the derivative’s fair value be recognized currently in earnings unless specific hedges allow a derivative’s gain or loss to offset related results on the hedged item in the statements of income. PSAK No. 55 also requires that an entity formally document, designate, and assess the effectiveness of transactions that are accounted for under the hedge accounting treatment.
The accounting for changes in the fair value of a derivative depends on the documented use of the derivative and the resulting designation. The Company has entered into forward and option currency contracts to hedge market risks arising from fluctuations in exchange rates relating to its foreign currency denominated loans. However, based on the specific requirements for hedge accounting under PSAK No. 55, the said instruments can not be designated as hedge activities for accounting purposes and accordingly, changes in the fair value of such instruments are recorded directly in earnings.
r. Corporate Income Tax
Current tax expense is provided based on the estimated taxable income for the year. Deferred tax assets and liabilities are recognized for temporary differences between the financial and the tax bases of assets and liabilities at each reporting date. Future tax benefits, such as the carry-forward of unused tax losses, are also recognized to the extent that realization of such benefits is probable.
Deferred tax assets and liabilities are measured at the tax rates that are expected to be applied to the period when the asset is realized or the liability is settled, based on tax rates (and tax laws) that have been enacted or substantively enacted at the balance sheet date.
Amendment to a tax obligation is recorded when an assessment is received or, if appealed, when the result of the appeal is determined.
s. Segment Reporting
The Company and Subsidiaries’ businesses are grouped into three major operating businesses: cement, ready mix concrete and other businesses. Financial information on business segments is presented in Note 17.
A business segment is a distinguishable component based on the industry or group of products or services and is subject to risks and returns that are different from those of other segments.
t. Stock Issuance Cost
u. Net Earnings (Losses) per Share
Basic earnings (losses) per share is computed by dividing net earnings (losses) by the weighted average number of shares outstanding during the year, which is 3,681,231,699 shares in 2005 and 3,681,231,049 shares in 2004.
In accordance with PSAK No. 56, “Earnings per Share”, the Company did not consider the dilutive effects of its outstanding warrants issued in computing earnings per share since the exercise price of the outstanding warrants is higher than the market price of the Company’s shares listed on the stock exchange.
3. CASH AND CASH EQUIVALENTS
The details of cash and cash equivalents are as follows:
2005 2004
US$23,711,360 in 2004) 51,767,275,030 203,609,447,805
Euro
(EUR796,241 in 2005) 9,753,250,701 -
Rupiah 1,412,617,324 1,963,274,857
PT Bank Mandiri (Persero) Tbk.
Rupiah 19,910,589,701 6,351,839,242
Euro
(EUR624,380 in 2005 and
EUR942,429 in 2004) 7,648,110,200 9,883,144,956
U.S. dollar
(US$344,546 in 2005 and
US$231,874 in 2004) 3,266,299,208 1,991,103,583
PT Bank Central Asia Tbk.
Rupiah 11,242,389,133 7,885,609,029
Euro
(EUR830,847 in 2005 and
EUR5,714 in 2004) 10,177,149,749 59,922,299
U.S. dollar
(US$656,004 in 2005 and
US$344,907 in 2004) 6,218,917,825 2,961,712,631
The Hongkong and Shanghai Banking Corporation Ltd., Jakarta Branch
Rupiah 6,632,706,318 2,694,313,806
PT Bank Lippo Tbk.
3. CASH AND CASH EQUIVALENTS (continued)
Other foreign currencies 87,160,925 154,381,721
Rupiah time deposits
ABN-AMRO Bank N.V. 163,627,761,603 40,000,000,000
PT Bank Mandiri (Persero) Tbk. 4,500,000,000 131,000,000,000
PT Bank Central Asia Tbk. 3,000,000,000 3,038,558,015
U.S. dollar time deposits (US$6,000,000)
ABN-AMRO Bank N.V. 56,880,000,000 -
Total 361,549,478,050 414,509,193,205
Interest rates per annum ranged from 5.00% to 6.90% in 2005 and from 5.75% to 7.93% in 2004 for the rupiah time deposits and ranged from 1.75% to 2.20% in 2005 for the U.S. dollar time deposits.
4. TRADE RECEIVABLES
The details of trade receivables are as follows:
2005 2004
Related Party (see Note 21)
Cement business
HCT Services Asia Pte., Ltd. (formerly HC Trading International Inc.), Singapore (US$2,489,932 in 2005 and
US$1,179,359 in 2004) 23,604,552,326 10,127,152,985
Third Parties
Cement and ready mix concrete
business 405,684,355,911 296,114,574,442
Other businesses - -
Total 405,684,355,911 296,114,574,442
Allowance for doubtful accounts (13,942,091,743) (13,332,091,743)
Net 391,742,264,168 282,782,482,699
The movements of allowance for doubtful accounts are as follows:
2005 2004
Balance at beginning of period 13,822,091,743 13,332,091,743
Provision during the period 120,000,000 -
Balance at end of period 13,942,091,743 13,332,091,743
Based on the review of the status of the individual receivable accounts at the end of the year, management believes that the above allowance for doubtful accounts is sufficient to cover any possible losses that may arise from uncollectible accounts.
Trade receivables are used as collateral for the long-term loans from banks and financial institutions (see Note 11).
5. OTHER RECEIVABLES
The details of other receivables are as follows:
2005 2004
PERTAMINA 18,991,408,836 -
Claim to the Tax Office 5,502,658,681 5,502,658,681
Market value of option and forward exchange
contracts (see Note 22m) 5,685,936,911 4,449,104,077
Others 4,381,854,235 12,188,521,731
Total 34,561,858,663 22,140,284,489
Allowance for doubtful accounts (7,373,045,808) (1,389,089,659)
Net 27,188,812,855 20,751,194,830
The movements of allowance for doubtful accounts are as follows:
2005 2004
Balance at beginning of period 8,503,980,725 1,389,089,659
Receivables written off during the period (1,130,934,917) -
Balance at end of period 7,373,045,808 1,389,089,659
Based on the review of the status of the individual receivable accounts at the end of the year, management believes that the above allowance for doubtful accounts is sufficient to cover any possible losses that may arise from uncollectible accounts.
6. INVENTORIES
Inventories consist of:
2005 2004
Finished goods 42,050,258,083 57,108,536,748
Work in process 75,727,565,730 78,037,166,287
Raw materials 36,212,831,228 25,933,334,259
Fuel and lubricants 101,959,677,443 56,827,910,926
Spare parts 526,504,239,594 517,458,910,623
Materials in transit and others 134,338,359 134,338,359
Total 782,588,910,437 735,500,197,202
Allowance for inventory losses (44,075,191,481) (40,063,072,423)
Net 738,513,718,956 695,437,124,779
The inventories are used as collateral for the long-term loans from banks and financial institutions (see Note 11).
The movements of allowance for inventory losses are as follows:
2005 2004
Balance at beginning of period 44,075,191,481 40,063,072,423
Provisions during the period - -
Obsolete inventory sold during the period - -
Inventories written off during the period - -
Balance at end of period 44,075,191,481 40,063,072,423
Management believes that the above allowance for inventory losses is sufficient to reduce the carrying amounts of inventories to their net realizable values.
The Company made advance payments to several foreign suppliers for the purchase of certain inventories. The outstanding balances of the purchase advances as of March 31, 2005 and 2004 amounting to Rp34,382,932,432 and Rp33,156,449,139, respectively, are presented as part of “Advances and Deposits” in the consolidated balance sheets.
7. LONG-TERM INVESTMENTS AND ADVANCES TO ASSOCIATED COMPANY
This account consists of long-term investments and advances to an associated companies. The details of this account are as follows:
7. LONG-TERM INVESTMENTS AND ADVANCES TO ASSOCIATED COMPANIES (continued)
The principal activities of the above investees are as follows:
Investee Country of Domicile Principal Business Activity
PT Cibinong Center Industrial Estate Indonesia Development of industrial estates
Stillwater Shipping Corporation Liberia Shipping
PT Pama Indo Mining Indonesia Mining
PT Indo Clean Set Cement Indonesia Production of clean set cement
The details of the equity in net earnings of associated companies, net of goodwill amortization, for the three months ended March 31, 2005 and 2004 are as follows:
2005 2004
Stillwater Shipping Corporation 1,301,708,256 860,473,659
PT Pama Indo Mining 695,975,648 627,509,415
PT Cibinong Center Industrial Estate 258,645,439 251,805,295
Total 2,256,329,343 1,739,788,369
Fixed assets consist of:
Furniture, fixtures and office equipment 142,480,757,740 5,218,677,418 43,155,253 147,656,279,905
8. FIXED ASSETS (continued)
Furniture, fixtures and office equipment 120,497,102,926 5,260,137,533 338,059,246 125,419,181,213
Tools and other equipment 35,989,900,653 1,281,625,149 293,682 37,271,232,120
Machineries under installation 77,530,726,757 81,855,896,369
Buildings and structures under construction 13,069,486,508 10,126,675,365
Others 15,734,571,762 8,958,838,212
Total 106,334,785,027 100,941,409,946
Below are the percentage of completion and estimated completion period of the construction in progress as of March 31, 2005:
Estimated Percentage Estimated Completion
of Completion Period
Machineries under installation 5 - 90% 6 to 24 months
Buildings and structures under construction 5 - 98 1 to 24 months
Others 20 - 95 1 to 12 months
Fixed assets are used as collateral to secure the long-term loans from banks and financial institutions (see Note 11).
Depreciation, amortization and depletion charges amounted to Rp106,489,715,741 and Rp108,047,967,802 for the three months ended March 31, 2005 and 2004, respectively.
The Company and Subsidiaries insured their fixed assets and inventories against losses from fire and other insurable risks under several combined policies, with a total insurance coverage of Rp195,818,794,650 and US$2,339,142,516 as of March 31, 2005. In management’s opinion, the above insurance coverage is adequate to cover any possible losses that may arise from such risks.
Based on the review of asset values at the end of the period, management believes that there is no potential impairment in the values of the assets included in the consolidated financial statements.
The Company and Subsidiaries own building/construction rights or “Hak Guna Bangunan” (HGB), land use rights or “Hak Pakai” (HP) and land ownership or “Hak Milik” (HM) over land covering approximately 3,193.9 hectares, and local mining rights or “Surat Izin Penambangan Daerah” (SIPD) covering approximately 11,022.05 hectares at several locations in Indonesia, with legal terms ranging from 5 to 30 years. Management believes that such titles of land rights ownerships can be extended upon their expiration.
As of March 31, 2005, the Company is still in the process of obtaining the titles of ownership or rights over land covering a total area of approximately 1,186,932 square meters. In addition, the Company is also in the process of acquiring land rights covering a total area of approximately 32,125 square meters. The total expenditures incurred in relation to the above land rights acquisition process amounting to Rp18,418,707,063 as of March 31, 2005, are recorded as part of “Other Non-current Assets” in the consolidated balance sheets.
The Company made advance payments for the purchase of certain machinery, equipment and spare parts from several suppliers. The outstanding balances of the purchase advances as of March 31, 2005 and 2004 amounting to Rp10,965,808,862 and Rp2,467,677,182, respectively, are presented as part of “Other Non-current Assets” in the consolidated balance sheets.
9. TRADE PAYABLES
Rupiah 92,424,771,395 66,759,544,203
U.S. dollar
(US$394,987 in 2005 and
US$96,423 in 2004) 3,744,481,387 827,985,272
Other foreign currencies 12,157,740,994 8,011,713,224
Sub-total 108,326,993,776 75,599,242,699
Other businesses - -
Total - Third Parties 108,326,993,776 75,599,242,699
Related Party - Cement business (see Note 21) - 2,012,689,756
Total Trade Payables 108,326,993,776 77,611,932,455
The above trade payables arose mostly from purchases of raw materials and other inventories. The main suppliers of the Company are as follows:
Supplier Materials Supplied
Topniche Associates Pte., Ltd. Gypsum
PT Bahari Cakrawala Sebuku Pertambangan Minyak dan Gas Bumi Negara (PERTAMINA)
Billerud AB.
Article 29/Corporate income tax 795,581,251 3,457,479,414
Value added tax 38,983,402,439 32,309,365,920
Total 47,984,407,756 42,786,475,922
b. The reconciliation between income before corporate income tax expense, as shown in the consolidated statements of income, and estimated taxable income of the Company for the three months ended March 31, 2005 and 2004 is as follows:
2005 2004
Income before corporate income tax expense per
consolidated statements of income 221,101,641,472 5,672,457,972
Less:
Income of Subsidiaries before corporate income
tax expense - net (9,160,807,122) (16,452,276,624)
Income (loss) before tax expense attributable
to the Company 211,940,834,350 (10,779,818,652)
Add (deduct):
Temporary differences
Provision for employee benefits 6,870,062,247 -
10. TAXATION (continued)
2005 2004
Receivables written off during the period (1,130,934,917) -
Realization of recultivation expenses (see Note 22l) (65,062,771) -
Depreciation of fixed assets (46,926,914,864) (59,837,312,673)
(54,796,114,445) (59,837,312,673)
Permanent differences Non-deductible expenses
Employees’ benefits 8,181,277,708 8,935,488,811
Donations 2,244,715,009 2,451,912,894
Public relations 1,435,416,927 1,902,753,844
Others 224,832,796 165,057,517
Income already subjected to final tax (2,121,671,031) (1,882,788,449)
Equity in net earnings of associated
companies - net (954,621,087) (879,314,710)
9,009,950,322 10,693,109,907
Estimated taxable income (fiscal loss)
of the Company 166,154,670,227 (59,924,021,418)
Estimated tax loss carryforward at beginning of
period (1,627,684,818,624) (1,692,713,302,871)
Corrections by the Tax Office 13,012,856,409 13,418,912,977
Estimated tax loss carryforward at end of period (1,448,517,291,988) (1,739,218,411,312)
Under existing tax regulations, the tax loss carryforward can be utilized within five (5) fiscal years from the date the tax loss is incurred.
c. The details of corporate income tax expense are as follows:
2005 2004
Current income tax expense
Company - -
Subsidiaries 1,285,702,600 4,988,401,750
Total current income tax expense 1,285,702,600 4,988,401,750
Deferred income tax expense (benefit)
Company 70,189,092,324 3,999,661,270
Subsidiaries 235,033,390 (316,258,918)
Net income tax expense 70,424,125,714 3,683,402,352
Total 71,709,828,314 8,671,804,102
d. The calculation of estimated claims for tax refund and estimated corporate income tax payable are
Subsidiaries 1,285,702,600 4,988,401,750
Total 1,285,702,600 4,988,401,750
Prepayments of income tax
Company 32,785,810,537 34,524,129,267
Subsidiaries 14,653,120,298 17,009,938,030
Total 47,438,930,835 51,534,067,297
Estimated claims for tax refund - presented as part of “Prepaid Taxes” in the consolidated balance sheets
Company 32,785,810,537 34,524,129,267
Subsidiaries 14,162,998,949 15,479,015,694
Total 46,948,809,486 50,003,144,961
Estimated Corporate Income Tax Payable
Subsidiary 795,581,251 3,457,479,414
In March 2005, the Company received a decision letter from the Tax Office wherein the Tax Office approved the Company’s 2003 claim for tax refund amounting to Rp22,648,223,940 (net of additional taxes and penalties) and increased the taxable income to Rp758,843,760,148. The difference between the amount of taxable income approved by the Tax Office and the amount reported of Rp13,012,856,409 was recognized as an adjustment to the Company’s tax loss carryforward in 2005.
In March 2004, the Company received a decision letter from the Tax Office wherein the Tax Office approved the Company’s 2002 claim for tax refund amounting to Rp9,677,584,970 (net of additional taxes and penalties) and increased the taxable income to Rp1,080,012,260,671. The difference between the amount of taxable income approved by the Tax Office and the amount reported of Rp13,418,912,977 was recognized as an adjustment to the Company’s tax loss carryforward in 2004.
In March 2005, DAP received a decision letter from the Tax Office wherein the Tax Office disapproved DAP’s 2003 claim for tax refund amounting to Rp 3,830,534,868, and made additional tax assessment of Rp 37,447,192. DAP are in process of contested the result of the tax assessment and the unapproved amount has remained a part of “Prepaid Taxes” in the consolidated balance sheets.
10. TAXATION (continued)
e. The reconciliation between income before corporate income tax expense multiplied by the applicable tax rate and corporate income tax expense as shown in the consolidated statements of income for the three months ended March 31, 2005 and 2004 is as follows:
2005 2004
Income before corporate income tax expense 221,101,641,472 5,672,457,972
Tax expense at the applicable rate 65,361,384,600 1,411,746,760
Tax effects on permanent differences (mainly consisting of employees’ benefits,
donations and public relations expenses) 3,746,638,931 4,360,034,888
Tax corrections 3,903,856,923 4,025,673,893
Income already subjected to final tax (1,015,665,814) (814,960,063)
Equity in net earnings of associated
companies - net (286,386,326) (263,794,413 )
Others - (46,896,963 )
Tax expense per consolidated statements
of income 71,709,828,314 8,671,804,102
f. Deferred tax assets (liabilities) consist of:
Deferred Tax
Tax loss carryforward 488,305,445,587 (53,750,257,991 ) 434,555,187,596
Allowance for doubtful accounts and
inventory losses 13,295,618,437 (339,280,475 ) 12,956,337,962
Estimated liability for employee benefits 9,338,768,646 2,061,018,674 11,399,787,320
Reserve for recultivation 2,902,904,019 (19,518,831 ) 2,883,385,188
Accrual for trade discount 4,062,979,242 (4,062,979,242 ) -
Others 833,851,800 - 833,851,800
Sub-total 518,739,567,731 (56,111,017,865 ) 462,628,549,866
Subsidiaries 5,063,109,760 (91,631,708 ) 4,971,478,052
Total 523,802,677,491 (56,202,649,573 ) 467,600,027,918
Deferred Tax Liabilities:
Company
Difference in net book value of fixed assets between tax base and
accounting base (580,234,066,955) (14,078,074,459) (594,312,141,414)
Subsidiaries (869,543,543) (143,401,682) (1,012,945,225)
Deferred Tax
Benefit (Expense)
Credited (Charged) to
December 31, 2004 2005 Profit and Loss March 31, 2005
Total (581,103,610,498) (14,221,476,141) (595,325,086,639)
Net Deferred Tax Assets:
Company - - -
Subsidiaries 4,193,566,217 (235,033,390) 3,958,532,827
Tax loss carryforward 507,813,990,861 13,951,532,532 521,765,523,393
Allowance for doubtful accounts and
inventory losses 11,608,313,004 - 11,608,313,004
Estimated liability for employee benefits 4,909,405,499 - 4,909,405,499
Reserve for recultivation 1,745,367,302 - 1,745,367,302
Others 833,851,800 - 833,851,800
Sub-total 526,910,928,466 13,951,532,532 540,862,460,998
Subsidiaries 3,659,625,735 182,693,387 3,842,319,122
Total 530,570,554,201 14,134,225,919 544,704,780,120
Deferred Tax Liabilities:
Company
Difference in net book value of fixed assets between tax base and
accounting base (522,984,721,821) (17,951,193,802) (540,935,915,623)
Subsidiaries (598,165,169) 133,565,342 (464,599,827)
Total (523,582,886,990) (17,817,628,460) (541,400,515,450)
Net Deferred Tax Assets:
Company 3,926,206,645 (3,926,206,645) -
Subsidiaries 3,352,260,121 182,693,387 3,534,953,508
11. LONG-TERM LOANS FROM BANKS AND FINANCIAL INSTITUTIONS
This account consists of loans from:
2005 2004
Third parties
Japanese yen 1,683,770,111,690 2,819,704,767,782
U.S. dollar 1,214,710,957,056 2,183,152,914,431
Rupiah 72,209,745,331 135,103,403,897
Sub-total 2,970,690,814,077 5,137,961,086,110
Related parties (see Note 21)
U.S. dollar 1,484,929,271,424 106,648,881,678
Total 4,455,620,085,501 5,244,609,967,788
Less portions currently due 379,200,000,000 558,155,000,000
Long-term portion 4,076,420,085,501 4,686,454,967,788
The balances of the above loans in their original currencies are as follows:
2005 2004
Japanese yen Third parties
Marubeni Corporation, Tokyo JP¥ 14,870,770,355 JP¥ 28,513,746,070
Japan Bank for International Corporation, Tokyo 4,158,643,503 5,822,105,503
Total Japanese yen loans JP¥ 19,029,413,858 JP¥ 34,335,851,573
BNP Paribas, Singapore Branch 8,994,231 16,828,078
Mizuho Trust & Banking Co., Ltd., Tokyo 8,618,903 16,125,845
Credit Industriel et Commercial, Singapore 6,603,717 12,355,461
Kawasaki Heavy Industries Limited, Tokyo 5,980,433 11,189,304
Deutsche Bank AG, London 4,767,687 21,393,695
Citigroup Financial Products Inc. 2,273,062 12,335,294
Other creditors (each below US$10 million) 28,347,254 79,973,447
Related parties
HC Finance B.V., Netherlands 150,000,000 -
WestLB AG, Tokyo 5,631,166 10,535,830
WestLB Asia Pacific Ltd., Singapore 1,006,943 1,883,976
Total U.S. dollar loans US$ 284,772,176 US$ 266,659,112
Rupiah
Third parties
PT Bank Central Asia Tbk. (BCA) 51,833,180,688 86,425,961,734
PT Bank Mandiri (Persero) Tbk. 20,376,564,643 38,124,261,903
JPMorgan Europe Ltd., London - 10,553,180,260
Total rupiah loans 72,209,745,331 135,103,403,897
The interest rates per annum for the above indebtedness are as follows:
The above debts represent restructured debts under the Post HZ Entry Master Facility Agreement (HZMFA) dated December 29, 2000. The HZMFA provides for, among others, the mechanism, amounts and schedules of loan installment repayments, collateral, interest rates, restrictions on granting of guarantees or loans, issuance of warrants to the lenders, restrictions on issuance of new shares or other securities, restrictions on declarations and payments of cash dividends without prior written consent from the creditors, restrictions on capital expenditures, appointment of monitoring accountants, determination and transfer of surplus cash, and restrictions on derivative transactions.
Under the HZMFA, the Company, and all the lenders appointed BA Asia Limited (BAAL) to act as the Facility Agent, JPMorgan Chase Bank, N.A. (formerly The Chase Manhattan Bank), Jakarta Branch to act as the Security and Escrow Agent, and The Bank of America N.A., JPMorgan Chase Bank, N.A., The Fuji Bank, Limited and BNP Paribas to compose the Monitoring Committee. In April 2002, the Company received a letter from BAAL regarding the resignation of BAAL and The Bank of America N.A. as part of the Monitoring Committee, and their replacement by Marubeni Corporation. Also, in December 2002, the Company was notified by JPMorgan Chase Bank, N.A. that starting on December 10, 2002, the role of Facility Agent had been transferred from BAAL to JPMorgan Chase Bank, N.A.
The HZMFA also requires the Company to:
• Establish and maintain escrow accounts in JPMorgan Chase Bank, N.A. Usages or withdrawals of
funds from these escrow accounts shall be subjected to strict monitoring and review by the monitoring accountants.
• Maintain an aggregate balance for all other current bank accounts (other than the current bank
accounts agreed by the lenders) in an amount not exceeding the working capital buffers as defined in the HZMFA.
In compliance with the above requirements, the Company opened and maintains eleven (11) escrow accounts with JPMorgan Chase Bank, N.A. The balances of deposits maintained in such escrow accounts amounted to Rp284,227,562,629 (consisting of Rp2,104,074, US$25,921,474 and JP¥435,000,000) as of March 31, 2005, and Rp306,364,196,275 (consisting of Rp3,038,448, US$28,982,910 and JP¥700,000,000) as of March 31, 2004 which are presented as part of “Restricted Cash and Time Deposits” in the consolidated balance sheets.
Furthermore, as stated in the HZMFA, the loan repayment installments would be as follows:
(i) Fixed quarterly installment payments totaling US$10,500,000 in 2002; US$33,500,000 in 2003; US$58,750,000 in 2004; US$78,500,000 in 2005; US$84,500,000 in 2006; US$87,250,000 in 2007; and US$22,000,000 in 2008 (final).
11. LONG-TERM LOANS FROM BANKS AND FINANCIAL INSTITUTIONS (continued)
As specified in the HZMFA, the restructured loans are secured/collateralized by the following:
• All of the above-mentioned escrow accounts maintained in JPMorgan Chase Bank, N.A., including
all time deposit and demand deposit placements made from the funds in the escrow accounts.
• All receivables of the Company.
• All land, buildings, site improvements and other fixtures owned by the Company, except for:
- Cement plants 6, 7 and 8, including their supporting facilities and land
- Land where cement plants 1 and 2 are located
- Quarry and the expansion of the Citeureup cement plants, including the land located within
Kecamatan Citeureup, Cileungsi, Cibadak and Jonggol
• Fiduciary transfers of all proprietary rights over the inventories, and plant and equipment owned by
the Company, including the related insurance coverage and/or proceeds from insurance recoveries.
• Shares of Indomix and DAP.
Based on the EGMS held on February 23, 2005, the independent shareholders approved the proposed refinancing transaction by the Company through the partial purchase of US$150 million of its restructured debt under the HZMFA by HeidelbergCement Finance B.V. (HC Finance B.V.).
In order to be effective, the above proposed refinancing transaction will be subject to:
(a) Approval of all of the following by existing creditors under the HZMFA:
- Accession of HC Finance B.V. to the HZMFA (with pari passu rank to the security under the HZMFA and with different terms of payment)
- Amendment of the HZMFA to allow the Company to engage in currency hedges for tenures of up to 4 (four) years, and enter into swap transactions under International Swap and Derivative Association documentation in relation to the proposed refinancing transaction
- Amendment of the HZMFA to reduce the scheduled principal repayments to be US$40 million per annum or to be US$10 million quarterly starting April 2005 until January 2008.
(b) Acceptance by the swap provider of the terms and conditions of a comfort letter to be issued by HeidelbergCement AG pursuant to the proposed refinancing transaction.
On March 8, 2005, all the above conditions precedent are fulfilled and the refinancing transaction became effective.
The terms of the HC Finance B.V. loan is 4 (four) years and the principal of this loan will be fully repaid (bullet payment) at the end of the fourth year (2009). This loan will bear interest at 3 Months’ LIBOR + 1.8% with the payment interest schedule being the same with that of other MFA creditors.
To reduce the exposure to exchange rate fluctuation, at the same time with the above-mentioned refinancing transaction, the Company entered into a hedging transaction with a notional amount of US$150 million using the Cross Currency Interest Rate Swap (CCIRS) instrument with Standard Chartered Bank, Jakarta Branch. The CCIRS contract has the same period with the HC Finance B.V. loan (see Note 22m).
Total principal payments made amounted to Rp153,164,422,824 and Rp87,439,988,937 for the three months ended March 31, 2005 and 2004, respectively.
Total interest payments made by the Company through its escrow accounts amounted to Rp37,851,862,502 (consisting of US$2,078,717, JP¥179,224,412 and Rp2,334,644,901) for the three
As of March 31, 2004, the outstanding balance of the restructured debt amounted to Rp5,244,609,967,788 (equivalent to US$610,761,613). Since the Company was able to reduce its debt below the target debt level (equivalent to US$700 million) before December 31, 2003 and as confirmed by the Facility Agent on December 24, 2003, the Company, among others, can use at its own discretion, 50% of any excess money in the escrow account after the prepayments of the principal loan installments and interest payments. The remaining 50% of the excess should be used in the early repayment of the debt (prepayment). In addition, the Monitoring Accountant’s role has been limited to only performing monthly reviews of the Company’s cash sweep mechanism to the escrow account. Total prepayments made amounted to US$10,900,000 (equivalent to Rp92,062,335,469) for the three months ended March 31, 2004.
Prior to the achievement of the target debt level, any excess money in the escrow accounts after the principal loan installment repayments plus interest payments should be used as the early repayment of the debt (prepayment) with the maximum annual prepayment of US$27,000,000 in 2002; US$25,500,000 in 2003; US$28,500,000 in 2004; US$21,500,000 in 2005; US$16,500,000 in 2006; and US$24,000,000 in 2007. Any excess funds available in the escrow accounts after the above maximum annual prepayment will be used for debt buy-back.
In December 2004, the Company bought back portions of its restructured debt amounting to US$12,452,464 and JP¥2,800,000,000 from the creditors at a discount of US$122,229 (equivalent to Rp1,102,258,416).
12. OBLIGATIONS UNDER CAPITAL LEASE
On December 23, 2003 and August 23, 2004, PBI entered into sale-and-leaseback agreements with PT Central Sari Finance (CSF) involving certain machineries and transportation equipment with lease terms of 3 years.
The future minimum lease payments required under the lease agreements as of March 31, 2005 and 2004 are as follows:
Present value of minimum lease payments 3,465,789,246 5,257,067,280
Current maturities 1,912,022,428 2,193,967,666
Long-term portion 1,553,766,818 3,063,099,614
13. CAPITAL STOCK
a. Share Ownership
The details of share ownership as of March 31, 2005 and 2004 are as follows:
Number of Shares Percentage
Issued and of
Shareholders Fully Paid Ownership Amount
HC Indocement GMBH, Germany 2,397,980,863 65.14% 1,198,990,431,500
PT Mekar Perkasa 479,735,234 13.03 239,867,617,000
Public and cooperatives 803,515,602 21.83 401,757,801,000
Total 3,681,231,699 100.00 % 1,840,615,849,500
The Company’s shares are listed on the Jakarta and Surabaya Stock Exchanges.
b. Warrants A
As of March 31, 2005 and 2004, the Company has 153,382,977 Warrants A issued and outstanding. Up to March 31, 2005, no Warrant A has been exercised.
Warrants A were issued to the creditors of the Company in connection with the debt restructuring at a fixed realization price of Rp3,600 per share. The period of realization of Warrants A shall be from two (2) to four (4) years and nine (9) months after the effective date of the debt restructuring which was on December 29, 2000.
All of the above warrants, which are issued at no cost, are naked warrants and listed on the Jakarta and Surabaya Stock Exchanges.
14. ADDITIONAL PAID-IN CAPITAL
This account represents the excess of the amounts received and/or the carrying value of converted debentures and bonds over the par value of the shares issued after offsetting all the expenses related to the issuance of equity securities.
15. OTHER PAID-IN CAPITAL
This account represents the difference between the agreed exchange rate for the conversion of the foreign currency debentures into equity and the exchange rate at the date of the transaction.
16. RETAINED EARNINGS
BUSINESS SEGMENTS
The Company and Subsidiaries’ businesses are grouped into three major operating businesses: cement, ready mix concrete and other business.
The main activities of each operating business are as follows:
Cement : Produce and sell several types of cement
Ready mix concrete : Produce and sell ready mix concrete
Other business : Investing activity
The Company and Subsidiaries’ business segment information is as follows:
2005 Cement Ready Mix Concrete Other Business Elimination Consolidation Long-term investments and
advances to associated
depreciation, amortization and depletion expenses