Consolidated Financial Statements
Six Months Ended June 30, 2005 and 2004
Table of Contents
Page
Consolidated Balance Sheets ………. 1-2
Consolidated Statements of Income ……….. 3
Consolidated Statements of Changes in Shareholders’ Equity ………. 4
Consolidated Statements of Cash Flows ……….. 5
Notes to the Consolidated Financial Statements .……… 6-47
Cash and cash equivalents 2c,3 414,806,137,518 561,687,429,092
Short-term investments 2d 6,590,722,650 4,877,447,050
Trade receivables 2e,4,11
Related party 2f,21 45,622,131,754 23,654,548,316
Third parties - net of allowance for doubtful accounts of Rp12,647,108,011
in 2005 and Rp13,332,091,743in 2004 22e 452,734,832,356 363,519,166,623
Other receivables from third parties - net of allowance for doubtful accounts of
Rp7,373,045,808 in 2005 and 2e,2q,
Rp1,389,089,659 in 2004 5,22m 40,348,007,721 39,111,129,484
Inventories - net 2g,6,11 827,311,802,829 665,643,675,856
Advances and deposits 6 71,323,729,804 64,860,135,361
Prepaid taxes 10 30,628,550,724 38,623,992,408
Prepaid expenses 2h 26,508,204,520 35,477,081,967
TOTAL CURRENT ASSETS 1,915,874,119,876 1,797,454,606,157
NON-CURRENT ASSETS
Due from related parties 2f,21 61,363,175,090 66,529,518,787
Deferred tax assets - net 2r,10 3,940,202,710 41,777,222,485
Long-term investments and advances to
associated companies - net of allowance for doubtful accounts of Rp13,720,944,026 in
2005 and Rp13,431,144,026 in 2004 2b,2f,7 47,397,751,151 27,736,479,726
Fixed assets - net of accumulated depreciation, amortization and depletion of
Rp3,618,872,764,464 in 2005 and 2i,2j,2k,
Rp3,141,877,652,104 in 2004 2l,8,11 7,589,639,017,376 7,970,006,239,372
Restricted cash and time deposits 11,12 328,110,755,493 314,373,813,073
Other non-current assets 2h,2m,8 68,476,542,268 38,341,226,026
TOTAL NON-CURRENT ASSETS 8,098,927,444,088 8,458,764,499,469
TOTAL ASSETS 10,014,801,563,964 10,256,219,105,626
The accompanying notes form an integral part of these consolidated financial statements.
Loans from banks and financial institutions 2f,11,21 388,520,000,000 654,342,500,000
Obligations under capital lease 2k,8,12 1,912,022,428 2,190,444,700
Others 2o,20,22l 9,084,518,190 6,062,667,633
Other current liabilities 7,007,705,359 5,451,418,419
TOTAL CURRENT LIABILITIES 792,104,205,067 1,028,129,995,038
NON-CURRENT LIABILITIES
Due to related parties 2f,21 8,129,353,445 5,306,994,868
Deferred tax liabilities - net 2r,10 205,209,904,016 143,659,198
Long-term liabilities - net of current maturities
Loans from banks and financial institutions 2f,11,21 3,988,131,718,747 4,769,176,509,843
Obligations under capital lease 2k,8,12 1,075,761,211 2,628,533,640
Others 2o,20,22l 46,433,791,534 25,604,322,450
Deferred gain on sale and leaseback
transactions - net 2k 8,887,707,382 10,125,475,037
TOTAL NON-CURRENT LIABILITIES 4,257,868,236,335 4,812,985,495,036
SHAREHOLDERS’ EQUITY
Capital stock - Rp500 par value per share
Authorized - 8,000,000,000 shares
Issued and fully paid - 3,681,231,699 shares 13 1,840,615,849,500 1,840,615,849,500
Additional paid-in capital 2t,14 1,194,236,402,048 1,194,236,402,048
Other paid-in capital 15 338,250,000,000 338,250,000,000
Differences arising from changes in the equity
of Subsidiaries 2b 6,847,770,149 (1,962,395,327)
Differences arising from restructuring transactions among entities under
common control 2a,2b 1,165,715,376,569 1,165,715,376,569
Unrealized losses on available-for-sale
securities - net 2d (3,030,394,615) (3,007,183,420)
Retained earnings (deficit)
Appropriated 16 125,000,000,000 100,000,000,000
Unappropriated 2a 297,194,118,911 (218,744,433,818)
NET SHAREHOLDERS’ EQUITY 4,964,829,122,562 4,415,103,615,552
TOTAL LIABILITIES AND SHAREHOLDERS’ EQUITY 10,014,801,563,964 10,256,219,105,626
Notes 2005 2004
NET REVENUES 2f,2n,17,
21,22e,22g 2,537,157,793,430 2,032,748,411,949
COST OF REVENUES 2f,2n,18, 20,
21,22h,22i,22j 1,624,675,621,791 1,374,093,994,905
GROSS PROFIT 912,482,171,639 658,654,417,044
OPERATING EXPENSES 2f,2n,19,20,
21,22d,22f
Delivery and selling 272,642,806,527 220,922,257,593
General and administrative 88,455,598,238 79,121,042,034
Total Operating Expenses 361,098,404,765 300,043,299,627
INCOME FROM OPERATIONS 551,383,766,874 358,611,117,417
OTHER INCOME (EXPENSES)
Interest income 3 10,174,994,889 7,324,460,077
Foreign exchange loss - net 2p,2q,22m (27,886,992,134) (433,934,091,459)
Interest expense 11 (114,262,966,426) (92,827,996,999)
Others - net 2m 29,056,212,345 6,075,700,962
Other Expenses - Net (102,918,751,326) (513,361,927,419)
EQUITY IN NET EARNINGS OF
ASSOCIATED COMPANIES - NET 2b,7 4,080,056,585 4,472,402,399
INCOME (LOSS) BEFORE CORPORATE
INCOME TAX EXPENSE (BENEFIT) 452,545,072,133 (150,278,407,603)
CORPORATE INCOME TAX EXPENSE (BENEFIT) 2r,10
Current 956,348,900 1,662,659,900
Deferred 143,968,768,300 (34,645,896,265)
Total Corporate Income Tax Expense (Benefit) 144,925,117,200 (32,983,236,365)
NET INCOME (LOSS) 307,619,954,933 (117,295,171,238)
BASIC EARNINGS (LOSS) PER SHARE 2u 83.56 (31.86)
The accompanying notes form an integral part of these consolidated financial statements.
Additional Difference Arising Transactions Among Losses on Retained Earnings (Deficit) Net Paid-in Capital * from Changes in the Entities Under Available-for-Sale Shareholders' Notes Capital Stock (Notes 13 and 14) Equity of Subsidiaries Common Control Securities - Net Appropriated Unappropriated Equity
Balance as of December 31, 2003
(as previously reported) 1,840,615,849,500 1,532,486,402,048 (841,391,078 ) (330,799,198,508) (3,069,178,320 ) 75,000,000,000 1,420,065,312,497 4,533,457,796,139
Adjustment arising from adoption of PSAK No.38
(Revised 2004) 2a - - - 1,496,514,575,077 - - (1,496,514,575,077 ) -
Balance as of December 31, 2003 (as restated) 1,840,615,849,500 1,532,486,402,048 (841,391,078 ) 1,165,715,376.569 (3,069,178,320 ) 75,000,000,000 (76,449,262,580 ) 4,533,457,796,139
Net loss - - - - - - (117,295,171,238 ) (117,295,171,238 ) Appropriation of retained earnings for general reserve 16 - - - - - 25,000,000,000 (25,000,000,000 ) - Recovery from decline in market values of investments in
available-for-sale securities 2d - - - - 61,994,900 - - 61,994,900 Change in Subsidiary's equity arising from the decline
in market values of its investments in available-
for-sale securities 2b, 2d - - (1,121,004,249 ) - - - - (1,121,004,249 )
Balance as of June 30, 2004 (as restated) 1,840,615,849,500 1,532,486,402,048 (1,962,395,327 ) 1,165,715,376,569 (3,007,183,420 ) 100,000,000,000 (218,744,433,818 ) 4,415,103,615,552
Balance as of December 31, 2004
(as previously reported) 1,840,615,849,500 1,532,486,402,048 5,447,335,825 (330,799,198,508) (3,045,917,820 ) 100,000,000,000 1,511,088,739,055 4,655,793,210,100
Adjustment arising from adoption of PSAK No.38
(Revised 2004) 2a - - - 1,496,514,575,077 - - (1,496,514,575,077 ) -
Balance as of December 31, 2004 (as restated) 1,840,615,849,500 1,532,486,402,048 5,447,335,825 1,165,715,376,569 (3,045,917,820 ) 100,000,000,000 14,574,163,978 4,655,793,210,100
Net income - - - 307,619,954,933 307,619,954,933 Appropriation of retained earnings for general reserve 16 - - - - - 25,000,000,000 (25,000,000,000 ) - Recovery from decline in market values of investments in
available-for-sale securities 2d - - - - 15,523,205 - - 15,523,205 Changes in the equity of Subsidiaries arising from
foreign currency translation adjustment 2b - - 721,834,324 - - - - 721,834,324 Changes in the equity of Subsidiaries arising from
Notes 2005 2004
CASH FLOWS FROM OPERATING ACTIVITIES
Collections from customers 2,690,891,870,973 2,188,757,147,032
Payments to suppliers and contractors, and for
salaries and other employees’ benefits (1,964,600,809,645) (1,455,091,091,685)
Cash provided by operations 726,291,061,328 733,666,055,347
Proceeds from claims for tax refund 23,022,640,563 15,872,718,682
Receipts of interest income 6,168,180,504 5,370,237,315
Payments of taxes (169,264,253,836) (142,945,482,888)
Net receipts from other operating activities 17,329,485,454 24,352,786,291
Net Cash Provided by Operating Activities 603,547,114,013 636,316,314,747
CASH FLOWS FROM INVESTING ACTIVITIES
Proceeds from sale of fixed assets 8 415,572,068 70,700,000
Purchases of fixed assets (54,144,108,856) (32,087,264,712)
Cash dividend received - 1,600,803,229
Net Cash Used in Investing Activities (53,728,536,788) (30,415,761,483)
CASH FLOWS FROM FINANCING ACTIVITIES
Net proceeds from derivative transactions 5,670,216,750 1,646,616,000
Payment of obligations under capital lease 12 (1,136,436,361) (634,012,470)
Net Cash Provided by Financing Activities 4,533,780,389 1,012,603,530
NET EFFECT OF CHANGES IN EXCHANGE
RATES ON CASH AND CASH EQUIVALENTS 360,381,896 26,197,947,754
NET RECLASSIFICATION OF CASH AND CASH EQUIVALENTS TO OTHER ASSETS (RESTRICTED
CASH AND TIME DEPOSITS) (447,339,120,395) (371,508,429,909)
NET INCREASE IN CASH AND CASH
EQUIVALENTS 107,373,619,115 261,602,674,639
CASH AND CASH EQUIVALENTS
Activities not affecting cash and cash equivalents: Payment of bank loans from restricted cash
accounts 11 292,364,795,808 373,596,566,651
Payment of interest using restricted cash
accounts 11 78,112,158,496 81,228,149,224
Interest earned on restricted cash accounts 11 2,039,139,059 787,050,878
Payments to facility and security agents using
PT Indocement Tunggal Prakarsa Tbk. (the “Company”) was incorporated in Indonesia on January 16, 1985 based on notarial deed No. 27 of Ridwan Suselo, S.H. Its deed of incorporation was approved by the Ministry of Justice in its decision letter No. C2-2876HT.01.01.Th.85 dated May 17, 1985 and was published in Supplement No. 57 of State Gazette No. 946 dated July 16, 1985. The Company’s articles of association has been amended from time to time, the latest amendment of
which was covered by notarial deed No. 24 dated June 16, 2005 of DR. Amrul Partomuan
Pohan, S.H., LLM. concerning, among others, the change in the members of the Company’s boards of directors. Such amendments were registered with the Ministry of Justice and Human Rights.
The Company started its commercial operations in 1985.
As stated in Article 3 of the Company’s articles of association, the scope of its activities comprises, among others, the manufacture of cement, building materials, construction and trading. Currently, the Company and Subsidiaries are involved in several businesses consisting of the manufacture and sale of cement (as core business) and ready mix concrete.
The Company’s head office is located at Wisma Indocement 8th Floor, Jl. Jend. Sudirman Kav 70-71,
Jakarta. Its factories are located in Citeureup West Java, Cirebon West Java, and Tarjun -South Kalimantan.
The cement business includes the operations of the Company’s twelve (12) plants located in three different sites: nine at the Citeureup - Bogor site, two at the Palimanan - Cirebon site and one at the Tarjun - South Kalimantan site, with a total combined annual production capacity of approximately 15.4 million tons of clinker. The ready mix concrete manufacturing business comprises the operation of the Company’s two subsidiaries.
Based on the minutes of the extraordinary general meeting of the Company’s shareholders (EGMS) held on October 2, 1989, which were covered by notarial deed No. 4 of Amrul Partomuan Pohan, S.H., LLM., the shareholders approved, among others, the offering of 598,881,000 shares to the public. Also, based on the minutes of the EGMS held on March 18, 1991, which were covered by notarial deed No. 53 of the same notary, the shareholders approved the issuance of convertible bonds with a total nominal value of US$75 million.
On June 20, 1991, in accordance with the above-mentioned shareholders’ approval, the Company issued and listed US$75 million worth of 6.75% Euro Convertible Bonds (the “Euro Bonds”) on the Luxembourg Stock Exchange at 100% issue price, with an original maturity in 2001 if these were not converted into shares. The Euro Bonds were convertible into common shares starting August 1, 1991 up to May 20, 2001 at the option of the bondholders at the initial conversion price of Rp14,450 per share, with a fixed rate of exchange upon conversion of US$1 to Rp1,946.
1. GENERAL (continued)
In the EGMS held on June 15, 1994, the shareholders approved the increase in the Company’s authorized capital stock from Rp750 billion to Rp2,000 billion, and the issuance of one bonus share for every share held by the shareholders as of August 23, 1994, or a total of 599,790,020 bonus shares.
In the EGMS held on June 26, 1996, the shareholders resolved to split the par value of the Company’s shares from Rp1,000 per share to Rp500 per share. Accordingly, the number of issued and paid-in capital stock was also increased from 1,207,226,660 shares to 2,414,453,320 shares. This shareholders’ resolution was approved by the Ministry of Justice in its decision letter No. C2-HT.01.04.A.4465 dated July 29, 1996.
On December 29, 2000, the Company issued 69,863,127 shares to Marubeni Corporation as a result of the conversion into equity of the latter’s receivable from the Company (debt-to-equity swap).
In the EGMS held on March 29, 2001, the shareholders approved the rights issue offering with pre-emptive rights to purchase new shares at Rp1,200 per share. The total number of shares allocated for the rights issue was 1,895,752,069 shares with an option to receive Warrant C if the shareholders did
not exercise their rights under certain terms and conditions stated in Note 13.
As of May 1, 2001 (the last exercise date), the total shares issued for rights exercised were as follows:
• 1,196,874,999 shares to Kimmeridge Enterprise Pte., Ltd. ("Kimmeridge"), a subsidiary of
HeidelbergCement (formerly Heidelberger Zement AG (HZ)) (HC), on April 26, 2001, through the conversion of US$149,886,295 debt.
• 32,073 shares to public shareholders.
The number of shares issued for the exercise of Warrant C totaled 8,180 shares.
On November 20, 2003, the Company received a copy of a letter from HC Indocement GMBH to the Chairman of the Badan Pengawas Pasar Modal (Bapepam) regarding the transfer of 2,254,739,197 shares of the Company from Kimmeridge Enterprise Pte., Ltd., to HC Indocement GMBH.
On December 1, 2003, the Company received a copy of a letter from HC Indocement GMBH to the Chairman of the Bapepam which states that HC Indocement GMBH has purchased 143,241,666 shares from the Government of the Republic Indonesia (GOI) through the exercise of the put option of GOI on October 30, 2003. After this acquisition, the number of shares owned by HC Indocement GMBH totaled 2,397,980,863 shares.
As of June 30, 2005 and 2004, the members of the Company’s boards of commissioners and directors are as follows:
2005 2004
Board of Commissioners
President Daniel Hugues Jules Gauthier Jean-Claude Thierry A. Dosogne
Vice President Sudwikatmono Sudwikatmono
Vice President I Nyoman Tjager I Nyoman Tjager
Commissioner DR. Bernd Scheifele Hans Erwin Bauer
Commissioner Parikesit Suprapto Parikesit Suprapto
Commissioner Emir Adiguzel Horst Robert Wolf
2005 2004
Board of Directors
President Daniel Eugene Antoine Lavalle Daniel Eugene Antoine Lavalle
Vice President Tedy Djuhar Tedy Djuhar
Director Thomas Willi Kern Thomas Willi Kern
Director Hans Oivind Hoidalen Hans Oivind Hoidalen
Director Iwa Kartiwa Iwa Kartiwa
Director Nelson G. D. Borch Nelson G. D. Borch
Director Benny Setiawan Santoso Benny Setiawan Santoso
Director Christian Kartawijaya Bradley Reginald Taylor
Director DR. Albert Scheuer Christian Kartawijaya
Total salaries and other compensation benefits paid to the Company’s boards of commissioners and directors amounted to Rp12.36 billion and Rp11.32 billion for the six months ended June 30, 2005 and 2004, respectively. As of June 30, 2005 and 2004, the Company and Subsidiaries have a total of 6,731 and 7,147 permanent employees, respectively.
2. SUMMARY OF SIGNIFICANT ACCOUNTING POLICIES
a. Basis of Preparation of the Consolidated Financial Statements
The accompanying consolidated financial statements have been prepared in accordance with generally accepted accounting principles and practices in Indonesia, which are based on Statements of Financial Accounting Standards (PSAK), the Capital Market Supervisory Agency’s (Bapepam) regulations, and Guidelines for Financial Statements Presentation and Disclosures for publicly listed companies issued by the Bapepam for manufacturing and investment companies. The consolidated financial statements have been prepared on the accrual basis using the historical cost concept of accounting, except for inventories which are valued at the lower of cost or net realizable value (market), derivative instruments and short-term investments which are stated at market values, certain investments in shares of stock which are accounted for under the equity method, and certain fixed assets which are stated at revalued amounts.
The consolidated statements of cash flows present receipts and payments of cash and cash equivalents classified into operating, investing and financing activities. The cash flows from operating activities are presented using the direct method.
The reporting currency used in the preparation of the consolidated financial statements is the Indonesian rupiah.
2. SUMMARY OF SIGNIFICANT ACCOUNTING POLICIES (continued)
a. Basis of Preparation of the Consolidated Financial Statements (continued)
2004 2003
Differences Arising from Restructuring Transactions
Among Entities under Common Control
A previously reported (330,799,198,508) (330,799,198,508)
Adoption of PSAK No. 38 (Revised 2004) 1,496,514,575,077 1,496,514,575,077
As restated 1,165,715,376,569 1,165,715,376,569
Retained Earnings - Unappropriated
A previously reported 1,511,088,739,055 1,420,065,312,497
Adoption of PSAK No. 38 (Revised 2004) (1,496,514,575,077) (1,496,514,575,077)
As restated 14,574,163,978 (76,449,262,580)
b. Principles of Consolidation
The consolidated financial statements include the accounts of the Company and those of its direct and indirect subsidiaries (collectively referred to as the “Subsidiaries”) as follows:
Year of
DAP was established in 1998 for the purpose of acting as the Company’s main domestic distributor of certain cement products.
On July 9, 2004, DAP and Indomix, subsidiaries, acquired 1,000 shares of MBG at book value, representing 100% ownership from PT Total Galaxy and Mr. Freddysun, third parties. MBG is a company which has obtained the right to use (“hak pengelolaan”) the Lembar port (Lombok), where the Company built its terminal, for 20 years from PT (PERSERO) Pelabuhan Indonesia III since January 1, 2001.
b. Principles of Consolidation (continued)
The Company also has five (5) other subsidiaries, all with effective percentages of ownership of 99.99%. The total cost of investments in these entities amounted to Rp20,000,000. Since these entities have no activities and the total cost of the investments in these subsidiaries is immaterial, their accounts were no longer consolidated into the consolidated financial statements. Instead, the investments in these subsidiaries are presented as part of “Long-term Investments and Advances to Associated Companies” in the consolidated balance sheets. The details of these subsidiaries are as follows:
All significant intercompany accounts and transactions have been eliminated.
Investments in associated companies wherein the Company or its Subsidiaries have ownership interests of at least 20% but not exceeding 50% are accounted for under the equity method, whereby the costs of such investments are increased or decreased by the Company’s or Subsidiaries’ share in the net earnings (losses) of the investees since the date of acquisition and are reduced by cash dividends received by the Company or Subsidiaries from the investees. The share in net earnings (losses) of the investees is adjusted for the straight-line amortization, over a twenty-year period (in view of the good future business prospects of the investees), of the difference between the costs of such investments and the Company’s or Subsidiaries’ proportionate share in the book value of the underlying net assets of investees at date of acquisition (goodwill).
A subsidiary’s investment in an associated company which uses the U.S. dollar as its functional and reporting currency is translated into rupiah using the exchange rate prevailing at balance sheet date, while the equity in the net earnings (losses) of the associated company is translated using the average rate during the year. Exchange differences arising from the translation of the investment are recorded by the Company as “Differences Arising from Changes in the Equity of Subsidiaries” account which is presented under the Stockholders’ Equity section of the consolidated balance sheets.
All other investments are carried at cost.
In compliance with PSAK No. 38 (Revised 2004), “Accounting for Restructuring Transactions Among Entities under Common Control”, the differences between the cost/proceeds of net assets acquired/disposed in connection with restructuring transactions among entities under common control compared to their net book values are recorded and presented as “Differences Arising from Restructuring Transactions Among Entities under Common Control” under the Shareholders’ Equity section of the consolidated balance sheets.
In compliance with PSAK No. 40, “Accounting for Changes in the Value of Equity of a Subsidiary/ Associated Company”, the difference between the carrying amount of the Company’s investment in, and the value of the underlying net assets of, the subsidiary/investee arising from changes in the latter’s equity which are not resulting from transactions between the Company and the concerned subsidiary/investee, is recorded and presented as “Differences Arising from Changes in the Equity of Subsidiaries” under the Shareholders’ Equity section of the consolidated balance sheets. Accordingly, the resulting difference arising from the changes in equity of PT Indomix Perkasa in connection with its application of the provisions of PSAK No. 50, “Accounting for Investments in
2. SUMMARY OF SIGNIFICANT ACCOUNTING POLICIES (continued)
c. Cash Equivalents
Time deposits and other short-term investments with maturities of three months or less at the time of placement or purchase and not pledged as collateral for loans and other borrowings are considered as “Cash Equivalents”.
d. Short-term Investments
Investments in equity securities listed on the stock exchanges are classified as “Short-term Investments”.
Equity securities classified as available-for-sale are stated at market values. Any unrealized gains or losses on appreciation/depreciation in market values of the equity securities are recorded and presented as “Unrealized Losses on Available-for-Sale Securities - Net” under the Shareholders’ Equity section of the consolidated balance sheets. These are credited or charged to operations upon realization.
e. Allowance for Doubtful Accounts
Allowance for doubtful accounts is provided based on a review of the status of the individual receivable accounts at the end of the year.
f. Transactions with Related Parties
The Company and Subsidiaries have transactions with certain parties which have related party relationships as defined under PSAK No. 7, “Related Party Disclosures”.
All significant transactions and balances with related parties, whether or not conducted using terms and conditions similar to those granted to third parties, are disclosed in Note 21.
g. Inventories
Inventories are stated at the lower of cost or net realizable value. Cost is determined using the moving average method. Allowance for inventory losses is provided to reduce the carrying value of inventories to their net realizable values.
Net realizable value is the estimated selling price in the ordinary course of business, less estimated cost of completion and estimated cost necessary to make the sale.
h. Prepaid Expenses
i. Fixed Assets
Fixed assets are stated at cost, except for certain assets revalued in accordance with government regulations, less accumulated depreciation, amortization and depletion. Certain machinery and equipment related to the production of cement are depreciated using the unit-of-production method, while all other fixed assets are depreciated using the straight-line method based on their estimated useful lives as follows:
Years
Land improvements; quarry; and buildings and structures 8 - 30
Machinery and equipment 5 - 10
Leasehold improvements; furniture, fixtures and office
equipment; and tools and other equipment 5
Transportation equipment 5
Land is stated at cost and is not depreciated.
Construction in progress is stated at cost (see item l below). Cost is reduced by the amount of
revenue generated from the sale of finished products during the trial production run less the related cost of production. The accumulated cost will be reclassified to the appropriate fixed assets account when the construction is substantially completed and the asset constructed is ready for its intended use.
The costs of maintenance and repairs are charged to operations as incurred; significant renewals and betterments which meet the capitalization criteria under PSAK No. 16, “Fixed Assets”, are capitalized. When assets are retired or otherwise disposed of, their carrying values and the related accumulated depreciation, amortization or depletion are removed from the accounts, and any resulting gains or losses are credited or charged to current operations.
j. Impairment of Assets
The recoverable amount of an asset is estimated whenever events or changes in circumstances indicate that its carrying amount may not be fully recoverable. Impairment in asset value, if any, is recognized as a loss in the current year’s statement of income.
k. Leases
Lease transactions are accounted for under the capital lease method when the required capitalization criteria under PSAK No. 30, “Accounting for Leases”, are met. Otherwise, lease transactions are accounted for under the operating lease method. Assets under capital lease (presented as part of “Fixed Assets” in the consolidated balance sheets) are recorded based on the present value of the lease payments at the beginning of the lease term plus residual value (option price) to be paid at the end of the lease period. Depreciation of leased assets is computed based on the methods and estimated useful lives used for similar fixed assets acquired under direct ownership.
Gain on sale-and-leaseback transaction is deferred and amortized using the same basis and methods as mentioned above.
2. SUMMARY OF SIGNIFICANT ACCOUNTING POLICIES (continued)
l. Capitalization of Borrowing Costs
In accordance with revised PSAK No. 26, “Borrowing Costs”, interest charges and foreign exchange differences incurred on borrowings and other related costs to finance the construction or installation of major facilities are capitalized. Capitalization of these borrowing costs ceases when the construction or installation is completed and the related asset is ready for its intended use. In 2005 and 2004, no borrowing costs were capitalized.
m. Deferred Charges
In accordance with PSAK No. 47, “Accounting for Land”, costs incurred in connection with the acquisitions/renewal of landrights, such as legal fees, land remeasurement fees, notarial fees, taxes and other expenses, are deferred and amortized using the straight-line method over the legal terms of the related landrights.
n. Revenue and Expense Recognition
Revenues are recognized when the products are delivered and the risks and benefits of ownership are transferred to the customers and/or when the services are rendered. Cost and expenses are generally recognized and charged to operations when they are incurred.
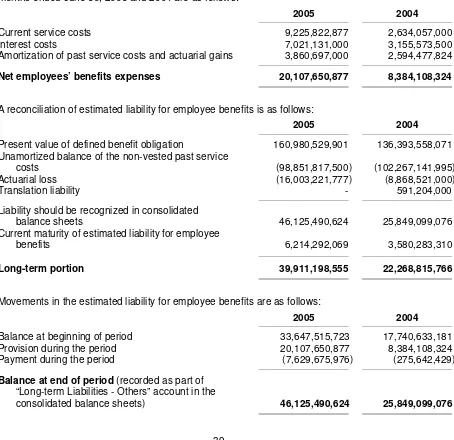
o. Provision for Employee Benefits
The Company has a defined contribution retirement plan (Pension Plan) covering all of its qualified permanent employees and an unfunded employee benefit liability in accordance with the existing Company’s Collective Labor Agreement (CLA). The provision for the CLA has been calculated by comparing the benefit that will be received by an employee at normal pension age from the Pension Plan with the benefit as stipulated in the CLA after deducting the accumulated employee contribution and the related investment results. If the employer-funded portion of the Pension Plan benefit is less than the benefit as required by the CLA, the Company provides for such shortage. Prior to January 1, 2004, the Company determined its employee benefit liability under the CLA based on an actuarial valuation and amortized unrecognized past service costs over the estimated average remaining years of service of qualified employees.
On the other hand, the Subsidiaries do not maintain any pension plan for the benefit of their employees. However, retirement benefit expenses for those Subsidiaries are accrued based on Labor Law No. 13/2003 dated March 25, 2003 (“the Law”).
Effective January 1, 2004, the Company decided to early adopt PSAK No. 24 (Revised 2004) - Employee Benefits, on a retrospective basis and changed its previous accounting method for employee benefits to the method required under this revised PSAK.
p. Foreign Currency Transactions and Balances
Transactions involving foreign currencies are recorded in rupiah at the middle rates of exchange prevailing at transaction date. At balance sheet date, monetary assets and liabilities denominated in foreign currencies are adjusted to reflect the rates of exchange quoted at the closing of the last banking day of the year. The resulting gains or losses are credited or charged to current operations, except for those capitalized under PSAK No. 26.
As of June 30, 2005 and 2004, the rates of exchange used are as follows:
2005 2004
Euro (EUR1) 11,732.83 11,384.16
U.S. dollar (US$1) 9,713.00 9,415.00
Japanese yen (JP¥100) 8,798.81 8,680.23
Transactions in other foreign currencies are considered insignificant.
q. Derivative Instruments
PSAK No. 55, “Accounting for Derivative Instruments and Hedging Activities”, establishes the accounting and reporting standards requiring that every derivative instrument (including certain derivatives embedded in other contracts) be recorded in the balance sheets as either an asset or liability measured at its fair value. PSAK No. 55 requires that changes in the derivative’s fair value be recognized currently in earnings unless specific hedges allow a derivative’s gain or loss to offset related results on the hedged item in the statements of income. PSAK No. 55 also requires that an entity formally document, designate, and assess the effectiveness of transactions that are accounted for under the hedge accounting treatment.
The accounting for changes in the fair value of a derivative depends on the documented use of the derivative and the resulting designation. The Company has entered into forward and option currency contracts to hedge market risks arising from fluctuations in exchange rates relating to its foreign currency denominated loans. However, based on the specific requirements for hedge accounting under PSAK No. 55, the said instruments can not be designated as hedge activities for accounting purposes and accordingly, changes in the fair value of such instruments are recorded directly in earnings.
r. Corporate Income Tax
Current tax expense is provided based on the estimated taxable income for the year. Deferred tax assets and liabilities are recognized for temporary differences between the financial and the tax bases of assets and liabilities at each reporting date. Future tax benefits, such as the carry-forward of unused tax losses, are also recognized to the extent that realization of such benefits is probable.
Deferred tax assets and liabilities are measured at the tax rates that are expected to be applied to the period when the asset is realized or the liability is settled, based on tax rates (and tax laws) that have been enacted or substantively enacted at the balance sheet date.
2. SUMMARY OF SIGNIFICANT ACCOUNTING POLICIES (continued)
s. Segment Reporting
The Company and Subsidiaries’ businesses are grouped into three major operating businesses: cement, ready mix concrete and other businesses. Financial information on business segments is presented in Note 17.
A business segment is a distinguishable component based on the industry or group of products or services and is subject to risks and returns that are different from those of other segments.
t. Stock Issuance Cost
Based on the decision letter No. KEP-06/PM/2000 dated March 13, 2000 of the Chairman of Bapepam, all expenses related to the issuance of equity securities should be offset against additional paid-in capital.
u. Net Earnings (Loss) per Share
Basic earnings (loss) per share is computed by dividing net earnings (loss) by the weighted average number of shares outstanding during the year, which is 3,681,231,699 shares in 2005 and 2004.
In accordance with PSAK No. 56, “Earnings per Share”, the Company did not consider the dilutive effects of its outstanding warrants issued in computing earnings per share since the exercise price of the outstanding warrants is higher than the market price of the Company’s shares listed on the stock exchange.
3. CASH AND CASH EQUIVALENTS
The details of cash and cash equivalents are as follows:
2005 2004
Cash on hand 732,589,697 670,872,017
Cash in banks
ABN-AMRO Bank N.V. U.S. dollar
(US$2,746,814 in 2005 and
US$28,015,965 in 2004) 26,679,800,594 263,770,310,382
Rupiah 21,823,385,670 26,737,397,419
Euro
(EUR555,852 in 2005) 6,521,712,211 -
PT Bank Mandiri (Persero) Tbk.
Rupiah 12,616,887,906 27,074,587,170
Euro
(EUR433,260 in 2005 and
EUR310,398 in 2004) 5,083,368,038 3,533,625,732
U.S. dollar
(US$65,911 in 2005 and
2005 2004
EUR188,704 in 2004) 4,709,272,033 2,148,232,203
The Hongkong and Shanghai Banking Corporation Ltd., Jakarta Branch
Other foreign currencies 47,949,292 124,135,014
Rupiah time deposits
ABN-AMRO Bank N.V. 221,144,143,069 200,000,000,000
PT Bank Mandiri (Persero) Tbk. 2,500,000,000 2,500,000,000
PT Bank Central Asia Tbk. 3,000,000,000 3,000,000,000
U.S. dollar time deposits (US$9,378,131)
ABN-AMRO Bank N.V. 91,089,783,392 -
Total 414,806,137,518 561,687,429,092
Interest rates per annum ranged from 5.00% to 7.35% in 2005 and from 4.75% to 7.93% in 2004 for the rupiah time deposits and ranged from 1.75% to 2.75% in 2005 for the U.S. dollar time deposits.
4. TRADE RECEIVABLES
The details of trade receivables are as follows:
2005 2004
Related Party (see Note 21)
Cement business
HCT Services Asia Pte., Ltd. (formerly HC Trading International Inc.), Singapore (US$4,697,018 in 2005 and
US$2,512,432 in 2004) 45,622,131,754 23,654,548,316
Third Parties
Cement and ready mix concrete
business 465,381,940,367 376,851,258,366
Allowance for doubtful accounts (12,647,108,011) (13,332,091,743)
Net 452,734,832,356 363,519,166,623
4. TRADE RECEIVABLES (continued)
The movements of allowance for doubtful accounts are as follows:
2005 2004
Balance at beginning of period 13,822,091,743 13,332,091,743
Provision during the period 240,000,000 -
Receivables written off during the period (1,414,983,732) -
Balance at end of period 12,647,108,011 13,332,091,743
Based on the review of the status of the individual receivable accounts at the end of the year, management believes that the above allowance for doubtful accounts is sufficient to cover any possible losses that may arise from uncollectible accounts.
Trade receivables are used as collateral for the long-term loans from banks and financial institutions (see Note 11).
The details of other receivables are as follows:
2005 2004
PERTAMINA 19,226,030,144 5,764,182,047
Market value of option, forward exchange
contracts and CCIRS (see Note 22m) 17,542,808,284 16,560,220,952
Claim to the Tax Office 5,502,658,681 5,502,658,681
Others 5,449,556,420 12,673,157,463
Total 47,721,053,529 40,500,219,143
Allowance for doubtful accounts (7,373,045,808) (1,389,089,659)
Net 40,348,007,721 39,111,129,484
The movements of allowance for doubtful accounts are as follows:
2005 2004
Balance at beginning of period 8,503,980,725 1,389,089,659
Receivables written off during the period (1,130,934,917) -
Balance at end of period 7,373,045,808 1,389,089,659
Based on the review of the status of the individual receivable accounts at the end of the year, management believes that the above allowance for doubtful accounts is sufficient to cover any possible losses that may arise from uncollectible accounts.
6. INVENTORIES
Inventories consist of:
2005 2004
Finished goods 68,308,505,167 39,867,658,456
Work in process 118,977,692,975 83,930,787,240
Raw materials 29,373,798,027 25,208,406,672
Fuel and lubricants 112,745,196,201 60,440,398,223
Spare parts 541,847,463,581 496,125,159,329
Materials in transit and others 134,338,359 134,338,359
Total 871,386,994,310 705,706,748,279
Allowance for inventory losses (44,075,191,481) (40,063,072,423)
Net 827,311,802,829 665,643,675,856
6. INVENTORIES (continued)
The inventories are used as collateral for the long-term loans from banks and financial institutions (see Note 11).
The movements of allowance for inventory losses are as follows:
2005 2004
Balance at beginning of period 44,075,191,481 40,063,072,423
Provisions during the period - -
Obsolete inventory sold during the period - -
Inventories written off during the period - -
Balance at end of period 44,075,191,481 40,063,072,423
Management believes that the above allowance for inventory losses is sufficient to reduce the carrying amounts of inventories to their net realizable values.
The Company made advance payments to several foreign suppliers for the purchase of certain inventories. The outstanding balances of the purchase advances as of June 30, 2005 and 2004 amounting to Rp37,137,524,497 and Rp41,290,561,647, respectively, are presented as part of “Advances and Deposits” in the consolidated balance sheets.
7. LONG-TERM INVESTMENTS AND ADVANCES TO ASSOCIATED COMPANY
This account consists of long-term investments and advances to an associated companies. The details of this account are as follows:
2004
The principal activities of the above investees are as follows:
Investee Country of Domicile Principal Business Activity
PT Cibinong Center Industrial Estate Indonesia Development of industrial estates
Stillwater Shipping Corporation Liberia Shipping
PT Pama Indo Mining Indonesia Mining
PT Indo Clean Set Cement Indonesia Production of clean set cement
The details of the equity in net earnings of associated companies, net of goodwill amortization, for the six months ended June 30, 2005 and 2004 are as follows:
2005 2004
Stillwater Shipping Corporation 2,336,988,886 2,264,713,164
PT Pama Indo Mining 889,545,975 1,395,755,870
PT Cibinong Center Industrial Estate 853,521,724 811,933,365
Total 4,080,056,585 4,472,402,399
Based on the minutes of the shareholders’ extraordinary meeting held on December 30, 2002, which were covered by notarial deed No. 2 dated January 7, 2003 of Notary Deni Thanur, S.E., S.H., M.Kn, the shareholders approved to liquidate PT Indo Clean Set Cement (ICSC). As of June 30, 2005, the liquidation process of ICSC is still ongoing. The additional equity in net losses of ICSC after 2002 has not been recognized in the consolidated financial statements since ICSC has ceased operations and the effects of the additional equity are immaterial to the consolidated financial statements.
8. FIXED ASSETS
Furniture, fixtures and office equipment 142,480,757,740 10,549,771,377 326,321,401 152,704,207,716
Balance as of Additions/ Disposals/ Balance as of
Furniture, fixtures and office equipment 120,497,102,926 11,235,295,911 557,277,840 131,175,120,997
Tools and other equipment 35,989,900,653 2,565,317,636 31,812,859 38,523,405,430
Machineries under installation 81,899,414,168 85,201,433,952
Buildings and structures under construction 13,304,315,765 8,888,002,994
Others 12,955,289,621 7,899,767,878
Total 108,159,019,554 101,989,204,824
8. FIXED ASSETS (continued)
Below are the percentage of completion and estimated completion period of the construction in progress as of June 30, 2005:
Estimated Percentage Estimated Completion
of Completion Period
Machineries under installation 5 - 95% 3 to 24 months
Buildings and structures under construction 10 - 99 1 to 24 months
Others 25 - 99 2 to 12 months
Fixed assets are used as collateral to secure the long-term loans from banks and financial institutions (see Note 11).
Depreciation, amortization and depletion charges amounted to Rp231,813,012,416 and Rp232,801,682,872 for the six months ended June 30, 2005 and 2004, respectively.
The Company and Subsidiaries insured their fixed assets and inventories against losses from fire and other insurable risks under several combined policies, with a total insurance coverage of Rp197,768,746,013 and US$2,339,142,516 as of June 30, 2005. In management’s opinion, the above insurance coverage is adequate to cover any possible losses that may arise from such risks.
Based on the review of asset values at the end of the period, management believes that there is no potential impairment in the values of the assets included in the consolidated financial statements.
The Company and Subsidiaries own building/construction rights or “Hak Guna Bangunan” (HGB), land use rights or “Hak Pakai” (HP) and land ownership or “Hak Milik” (HM) over land covering approximately 3,212.06 hectares, and local mining rights or “Surat Izin Penambangan Daerah” (SIPD) covering approximately 11,315.35 hectares at several locations in Indonesia, with legal terms ranging from 5 to 30 years. Management believes that such titles of land rights ownerships can be extended upon their expiration.
As of June 30, 2005, the Company is still in the process of obtaining the titles of ownership or rights over land covering a total area of approximately 1,006,282 square meters. In addition, the Company is also in the process of acquiring land rights covering a total area of approximately 429,642 square meters. The total expenditures incurred in relation to the above land rights acquisition process amounting to Rp12,892,700,101 as of June 30, 2005, are recorded as part of “Other Non-current Assets” in the consolidated balance sheets.
The Company made advance payments for the purchase of certain machinery, equipment and spare parts from several suppliers. The outstanding balances of the purchase advances as of June 30, 2005 and 2004 amounting to Rp14,277,687,474 and Rp2,781,658,729, respectively, are presented as part of “Other Non-current Assets” in the consolidated balance sheets.
This account consists of the following:
Rupiah 96,872,962,376 69,136,552,298
U.S. dollar
(US$1,068,741 in 2005 and
US$478,775 in 2004) 10,379,084,751 4,507,670,673
Other foreign currencies 7,476,462,360 7,628,533,722
Sub-total 114,728,509,487 81,272,756,693
Other businesses - -
Total - Third Parties 114,728,509,487 81,272,756,693
Related Party - Cement business (see Note 21) 1,149,758,998 3,324,474,160
Total Trade Payables 115,878,268,485 84,597,230,853
9. TRADE PAYABLES (continued)
The above trade payables arose mostly from purchases of raw materials and other inventories. The main suppliers of the Company are as follows:
Supplier Materials Supplied
Topniche Associates Pte., Ltd. Gypsum
PT Bahari Cakrawala Sebuku Pertambangan Minyak dan Gas Bumi Negara (PERTAMINA)
Billerud AB.
Value added tax 41,088,277,933 40,577,431,086
Total 47,813,880,542 49,873,115,122
b. The reconciliation between income (loss) before corporate income tax expense (benefit), as shown in the consolidated statements of income, and estimated taxable income (fiscal loss) of the Company for the six months ended June 30, 2005 and 2004 is as follows:
2005 2004
Income (loss) before corporate income tax expense
(benefit) per consolidated statements of income 452,545,072,133 (150,278,407,603)
Less:
Loss (income) of Subsidiaries before corporate
income tax expense - net (8,958,391,247) 926,896,764
Income (loss) before tax expense (benefit)
attributable to the Company 443,586,680,886 (149,351,510,839)
Add (deduct):
Temporary differences
Provision for employee benefits - net 12,551,415,386 8,182,342,506
2005 2004
Reversal of trade discount (13,543,264,140) -
Receivables written off during the period (2,545,918,649) -
Realization of recultivation expenses (see Note 22l) (283,527,632) -
(80,166,496,636) (95,274,790,799)
Permanent differences Non-deductible expenses
Employees’ benefits 21,858,894,779 17,839,415,613
Donations 5,237,178,992 5,551,640,511
Public relations 2,210,147,028 3,523,252,987
Others 308,047,897 94,732,644
Income already subjected to final tax (5,419,388,987) (3,671,699,635)
Equity in net earnings of associated
companies - net (1,743,067,699) (2,207,689,235)
22,451,812,010 21,129,652,885
Estimated taxable income (fiscal loss)
of the Company 385,871,996,260 (223,496,648,753)
Estimated tax loss carryforward at beginning of
period (1,627,684,818,624) (1,692,713,302,871)
Corrections by the Tax Office 13,012,856,409 13,418,912,977
Estimated tax loss carryforward at end of period (1,228,799,965,955) (1,902,791,038,647)
Under existing tax regulations, the tax loss carryforward can be utilized within five (5) fiscal years from the date the tax loss is incurred.
c. The details of corporate income tax expense (benefit) are as follows:
2005 2004
Current income tax expense
Company - -
Subsidiaries 956,348,900 1,662,659,900
Total current income tax expense 956,348,900 1,662,659,900
Deferred income tax expense (benefit)
Company 143,715,404,792 (34,440,883,493)
Subsidiaries 253,363,508 (205,012,772)
Net income tax expense (benefit) 143,968,768,300 (34,645,896,265)
Total 144,925,117,200 (32,983,236,365)
10. TAXATION (continued)
d. The calculation of estimated claims for tax refund and estimated corporate income tax payable are as follows:
2005 2004
Current income tax expense
Company - -
Subsidiaries 956,348,900 1,662,659,900
Total 956,348,900 1,662,659,900
Prepayments of income tax
Company 12,299,216,529 25,759,090,259
Subsidiaries 17,110,790,742 12,479,123,804
Total 29,410,007,271 38,238,214,063
Estimated claims for tax refund - presented as part of “Prepaid Taxes” in the consolidated balance sheets
Company 12,299,216,529 25,759,090,259
Subsidiaries 16,154,441,842 10,816,463,904
Total 28,453,658,371 36,575,554,163
Estimated Corporate Income Tax Payable
Subsidiary - -
In March 2005, the Company received a decision letter from the Tax Office wherein the Tax Office approved the Company’s 2003 claim for tax refund amounting to Rp22,648,223,940 (net of additional taxes and penalties) and increased the taxable income to Rp758,843,760,148. The difference between the amount of taxable income approved by the Tax Office and the amount reported of Rp13,012,856,409 was recognized as an adjustment to the Company’s tax loss carryforward in 2005.
In March 2004, the Company received a decision letter from the Tax Office wherein the Tax Office approved the Company’s 2002 claim for tax refund amounting to Rp9,677,584,970 (net of additional taxes and penalties) and increased the taxable income to Rp1,080,012,260,671. The difference between the amount of taxable income approved by the Tax Office and the amount reported of Rp13,418,912,977 was recognized as an adjustment to the Company’s tax loss carryforward in 2004. Moreover, the Tax Office also approved the Company’s 2002 claim for tax refund amounting to Rp 10,359,940,562.
In March 2005, DAP received a decision letter from the Tax Office wherein the Tax Office disapproved DAP’s 2003 claim for tax refund amounting to Rp 3,830,534,868, and made additional tax assessment of Rp 37,447,192. DAP are in process of contested the result of the tax assessment and the unapproved amount has remained a part of “Prepaid Taxes” in the consolidated balance sheets.
e. The reconciliation between income (loss) before corporate income tax expense (benefit) multiplied by the applicable tax rate and corporate income tax expense (benefit) as shown in the consolidated statements of income for the six months ended June 30, 2005 and 2004 is as follows:
2005 2004
Income (loss) before corporate income
tax expense (benefit) 452,545,072,133 (150,278,407,603)
Tax expense (benefit) at the applicable rate 134,476,381,363 (42,930,436,339)
Tax effects on permanent differences (mainly consisting of employees’ benefits,
donations and public relations expenses) 9,570,424,830 8,317,977,602
Tax corrections 3,903,856,923 4,025,673,893
Income already subjected to final tax (2,502,625,606) (1,687,247,787)
Equity in net earnings of associated
companies - net (522,920,310) (662,306,771 )
Others - (46,896,963 )
Tax expense (benefit) per consolidated
statements of income 144,925,117,200 (32,983,236,365)
f. Deferred tax assets (liabilities) consist of:
Deferred Tax
Tax loss carryforward 488,305,445,587 (119,665,455,801 ) 368,639,989,786
Allowance for doubtful accounts and
inventory losses 13,295,618,437 (763,775,595 ) 12,531,842,842
Estimated liability for employee benefits 9,338,768,646 3,765,424,616 13,104,193,262
Reserve for recultivation 2,902,904,019 (85,058,290 ) 2,817,845,729
Accrual for trade discount 4,062,979,242 (4,062,979,242 ) -
Others 833,851,800 - 833,851,800
Sub-total 518,739,567,731 (120,811,844,312 ) 397,927,723,419
Subsidiaries 5,063,109,760 (20,675,688 ) 5,042,434,072
Total 523,802,677,491 (120,832,520,000 ) 402,970,157,491
Deferred Tax Liabilities:
Company
Difference in net book value of fixed assets between tax base and
accounting base (580,234,066,955) (22,903,560,480) (603,137,627,435)
Subsidiaries (869,543,543) (232,687,819) (1,102,231,362)
Total (581,103,610,498) (23,136,248,299 ) (604,239,858,797 )
10. TAXATION (continued)
Subsidiaries 4,193,566,217 (253,363,507) 3,940,202,710
Tax loss carryforward 507,813,990,861 63,023,320,733 570,837,311,594
Allowance for doubtful accounts and
inventory losses 11,608,313,004 - 11,608,313,004
Estimated liability for employee benefits 4,909,405,499 2,454,702,752 7,364,108,251
Reserve for recultivation 1,745,367,302 - 1,745,367,302
Others 833,851,800 - 833,851,800
Sub-total 526,910,928,466 65,478,023,485 592,388,951,951
Subsidiaries 3,659,625,735 57,872,226 3,717,497,961
Total 530,570,554,201 65,535,895,711 596,106,449,912
Deferred Tax Liabilities:
Company
Difference in net book value of fixed assets between tax base and
accounting base (522,984,721,821) (31,037,139,992) (554,021,861,813)
Subsidiaries (598,165,169) 147,140,357 (451,024,812)
Total (523,582,886,990) (30,889,999,635) (554,472,886,625)
Net Deferred Tax Assets:
Company 3,926,206,645 34,440,883,493 38,367,090,138
Subsidiaries 3,352,260,121 57,872,226 3,410,132,347
This account consists of loans from:
2005 2004
Third parties
Japanese yen 1,178,424,770,204 2,882,937,861,830
U.S. dollar 1,611,855,298,733 2,298,559,046,017
Rupiah 68,372,219,220 129,735,532,375
Sub-total 2,858,652,288,157 5,311,232,440,222
Related parties (see Note 21)
U.S. dollar 1,517,999,430,590 112,286,569,621
Total 4,376,651,718,747 5,423,519,009,843
Less portions currently due 388,520,000,000 654,342,500,000
Long-term portion 3,988,131,718,747 4,769,176,509,843
The balances of the above loans in their original currencies are as follows:
2005 2004
Japanese yen Third parties
Marubeni Corporation, Tokyo JP¥ 14,992,102,213 JP¥ 28,222,315,274
Japan Bank for International Corporation, Tokyo 3,326,912,503 4,990,374,503
Total Japanese yen loans JP¥ 18,319,014,716 JP¥ 33,212,689,777
BNP Paribas, Singapore Branch 8,516,240 16,159,471
Mizuho Trust & Banking Co., Ltd., Tokyo 8,160,859 15,485,140
Credit Industriel et Commercial, Singapore 6,252,768 11,864,559
Kawasaki Heavy Industries Limited, Tokyo 5,662,608 10,744,735
WestLB Asia Pacific Ltd., Singapore 953,430 1,809,123
Total U.S. dollar loans US$ 277,609,822 US$ 256,064,325
Rupiah
Third parties
PT Bank Central Asia Tbk. (BCA) 49,078,549,947 82,992,121,835
PT Bank Mandiri (Persero) Tbk. 19,293,669,273 36,609,524,791
JPMorgan Europe Ltd., London - 10,133,885,749
Total rupiah loans 68,372,219,220 129,735,532,375
11. LONG-TERM LOANS FROM BANKS AND FINANCIAL INSTITUTIONS (continued)
The interest rates per annum for the above indebtedness are as follows:
2005 2004
Japanese yen 2.30% - 3.70% 2.30% - 3.70%
U.S. dollar 3.37% - 5.25% 3.12% - 3.65%
Rupiah 7.87% - 8.19% 8.06% - 9.37%
The above debts represent restructured debts under the Post HZ Entry Master Facility Agreement (HZMFA) dated December 29, 2000. The HZMFA provides for, among others, the mechanism, amounts and schedules of loan installment repayments, collateral, interest rates, restrictions on granting of guarantees or loans, issuance of warrants to the lenders, restrictions on issuance of new shares or other securities, restrictions on declarations and payments of cash dividends without prior written consent from the creditors, restrictions on capital expenditures, appointment of monitoring accountants, determination and transfer of surplus cash, and restrictions on derivative transactions.
Under the HZMFA, the Company, and all the lenders appointed BA Asia Limited (BAAL) to act as the Facility Agent, JPMorgan Chase Bank, N.A. (formerly The Chase Manhattan Bank), Jakarta Branch to act as the Security and Escrow Agent, and The Bank of America N.A., JPMorgan Chase Bank, N.A., The Fuji Bank, Limited and BNP Paribas to compose the Monitoring Committee. In April 2002, the Company received a letter from BAAL regarding the resignation of BAAL and The Bank of America N.A. as part of the Monitoring Committee, and their replacement by Marubeni Corporation. Also, in December 2002, the Company was notified by JPMorgan Chase Bank, N.A. that starting on December 10, 2002, the role of Facility Agent had been transferred from BAAL to JPMorgan Chase Bank, N.A.
The HZMFA also requires the Company to:
• Establish and maintain escrow accounts in JPMorgan Chase Bank, N.A. Usages or withdrawals of
funds from these escrow accounts shall be subjected to strict monitoring and review by the monitoring accountants.
• Maintain an aggregate balance for all other current bank accounts (other than the current bank
accounts agreed by the lenders) in an amount not exceeding the working capital buffers as defined in the HZMFA.
In compliance with the above requirements, the Company opened and maintains eleven (11) escrow accounts with JPMorgan Chase Bank, N.A. The balances of deposits maintained in such escrow accounts amounted to Rp322,374,688,213 (consisting of Rp1,600,696, US$27,913,108 and JP¥582,500,000) as of June 30, 2005, and Rp309,116,745,793 (consisting of Rp3,009,767, US$26,954,566 and JP¥637,500,371) as of June 30, 2004 which are presented as part of “Restricted Cash and Time Deposits” in the consolidated balance sheets.
Furthermore, as stated in the HZMFA, the loan repayment installments would be as follows:
(i) Fixed quarterly installment payments totaling US$10,500,000 in 2002; US$33,500,000 in 2003; US$58,750,000 in 2004; US$78,500,000 in 2005; US$84,500,000 in 2006; US$87,250,000 in 2007; and US$22,000,000 in 2008 (final).
As specified in the HZMFA, the restructured loans are secured/collateralized by the following:
• All of the above-mentioned escrow accounts maintained in JPMorgan Chase Bank, N.A., including
all time deposit and demand deposit placements made from the funds in the escrow accounts.
• All receivables of the Company.
• All land, buildings, site improvements and other fixtures owned by the Company, except for:
- Cement plants 6, 7 and 8, including their supporting facilities and land
- Land where cement plants 1 and 2 are located
- Quarry and the expansion of the Citeureup cement plants, including the land located within
Kecamatan Citeureup, Cileungsi, Cibadak and Jonggol
• Fiduciary transfers of all proprietary rights over the inventories, and plant and equipment owned by
the Company, including the related insurance coverage and/or proceeds from insurance recoveries.
• Shares of Indomix and DAP.
Based on the EGMS held on February 23, 2005, the independent shareholders approved the proposed refinancing transaction by the Company through the partial purchase of US$150 million of its restructured debt under the HZMFA by HeidelbergCement Finance B.V. (HC Finance B.V.).
In order to be effective, the above proposed refinancing transaction will be subject to:
(a) Approval of all of the following by existing creditors under the HZMFA:
- Accession of HC Finance B.V. to the HZMFA (with pari passu rank to the security under the HZMFA and with different terms of payment)
- Amendment of the HZMFA to allow the Company to engage in currency hedges for tenures of up to 4 (four) years, and enter into swap transactions under International Swap and Derivative Association documentation in relation to the proposed refinancing transaction
- Amendment of the HZMFA to reduce the scheduled principal repayments to be US$40 million per annum or to be US$10 million quarterly starting April 2005 until January 2008.
(b) Acceptance by the swap provider of the terms and conditions of a comfort letter to be issued by HeidelbergCement AG pursuant to the proposed refinancing transaction.
On March 8, 2005, all the above conditions precedent are fulfilled and the refinancing transaction became effective.
The terms of the HC Finance B.V. loan is 4 (four) years and the principal of this loan will be fully repaid (bullet payment) at the end of the fourth year (2009). This loan will bear interest at 3 Months’ LIBOR + 1.8% with the payment interest schedule being the same with that of other MFA creditors.
To reduce the exposure to exchange rate fluctuation, at the same time with the above-mentioned refinancing transaction, the Company entered into a hedging transaction with a notional amount of US$150 million using the Cross Currency Interest Rate Swap (CCIRS) instrument with Standard Chartered Bank, Jakarta Branch. The CCIRS contract has the same period with the HC Finance B.V. loan (see Note 22m).
Total principal payments made amounted to Rp250,747,375,177 and Rp233,007,237,457 for the six months ended June 30, 2005 and 2004, respectively.
Total interest payments made by the Company through its escrow accounts amounted to Rp78,112,158,496 (consisting of US$4,852,729, JP¥315,868,658 and Rp4,206,679,902) for the six
11. LONG-TERM LOANS FROM BANKS AND FINANCIAL INSTITUTIONS (continued)
As of June 30, 2004, the outstanding balance of the restructured debt amounted to Rp5,423,519,009,843 (equivalent to US$576,050,877). Since the Company was able to reduce its debt below the target debt level (equivalent to US$700 million) before December 31, 2003 and as confirmed by the Facility Agent on December 24, 2003, the Company, among others, can use at its own discretion, 50% of any excess money in the escrow account after the prepayments of the principal loan installments and interest payments. The remaining 50% of the excess should be used in the early repayment of the debt (prepayment). In addition, the Monitoring Accountant’s role has been limited to only performing monthly reviews of the Company’s cash sweep mechanism to the escrow account. Total prepayments made amounted to US$4,375,700 (equivalent to Rp41,617,420,631) and US$16,420,000 (equivalent to Rp140,589,329,194) for the six months ended June 30, 2005 and 2004, respectively.
Prior to the achievement of the target debt level, any excess money in the escrow accounts after the principal loan installment repayments plus interest payments should be used as the early repayment of the debt (prepayment) with the maximum annual prepayment of US$27,000,000 in 2002; US$25,500,000 in 2003; US$28,500,000 in 2004; US$21,500,000 in 2005; US$16,500,000 in 2006; and US$24,000,000 in 2007. Any excess funds available in the escrow accounts after the above maximum annual prepayment will be used for debt buy-back.
In December 2004, the Company bought back portions of its restructured debt amounting to US$12,452,464 and JP¥2,800,000,000 from the creditors at a discount of US$122,229 (equivalent to Rp1,102,258,416).
12. OBLIGATIONS UNDER CAPITAL LEASE
On December 23, 2003 and August 23, 2004, PBI entered into sale-and-leaseback agreements with PT Central Sari Finance (CSF) involving certain machineries and transportation equipment with lease terms of 3 years.
The future minimum lease payments required under the lease agreements as of June 30, 2005 and 2004 are as follows:
Present value of minimum lease payments 2,987,783,639 4,818,978,340
Current maturities 1,912,022,428 2,190,444,700
Long-term portion 1,075,761,211 2,628,533,640