Food security in Amazonia
A report for the Amazonia Security Agenda Project
August 2013 amazoniasecurity.org
Rodomiro Ortiz*, Andreea Nowak**, Angela Lavado**, Louis Parker**
Food Security in Amazonia was produced for this project by Rodomiro Ortiz1,
Andreea Nowak2, Angela Lavado2 and Louis Parker2 of the 1 Swedish University of
Agricultural Sciences and the 2International Center of Tropical Agriculture.
Suggested citation:
ORTIZ, R., NOWAK, A., LAVADO, A. & PARKER, L. (2013) Food Security in Amazonia. Report for Global Canopy Programme and International Center for Tropical Agriculture as part of the Amazonia Security Agenda project.
This report was commissioned by the International Center for Tropical Agriculture (CIAT) and the Global Canopy Programme (GCP) for the Amazonia Security
Agenda. This report was supported with funds from the Climate and Development Knowledge Network (CDKN) and Fundación Futuro Latinoamericano (FFLA).
Contents
1.INTRODUCTION ... 6
2. FOOD SECURITY: definition and indicators ... 8
3. METHODOLOGY ... 11
3.1. Study Area ... 11
3.2 Data collection and analysis ... 13
4. ECOSYSTEM SERVICES AND FOOD SECURITY ... 15
5. AGRICULTURAL PRODUCTION AND FOOD SECURITY IN THE AMAZON . 22 5.1. Agricultural production ... 22
5.2. The state of food security in the Amazon ... 26
6. THREATS TO FOOD SECURITY IN THE AMAZON ... 33
6.1. Deforestation ... 34
6.1.1 Deforestation for agricultural expansion and intensification ... 36
6.1.2. Deforestation for cattle ranching ... 39
6.1.3 Deforestation for biofuels and illicit crops ... 40
6.1.4. Deforestation for infrastructure development ... 44
6.2. Climate Change ... 46
7. FOOD SECURITY THREATS TO DIFFERENT AMAZONIAN POPULATIONS ... 52
8. CASE STUDIES ... 55
9. CONCLUSIONS AND POSSIBLE POLICY PATHWAYS ... 57
9.1. Conclusions ... 57
9.2. Possible policy pathways ... 59
10. LITERATURE CITED ... 65
11. APPENDIX ... 87
11.1 Appendix: Deforestation and road infrastructure development in Peru ... 88
LIST OF FIGURES
Figure 1. The Amazon: distribution per country ... 11
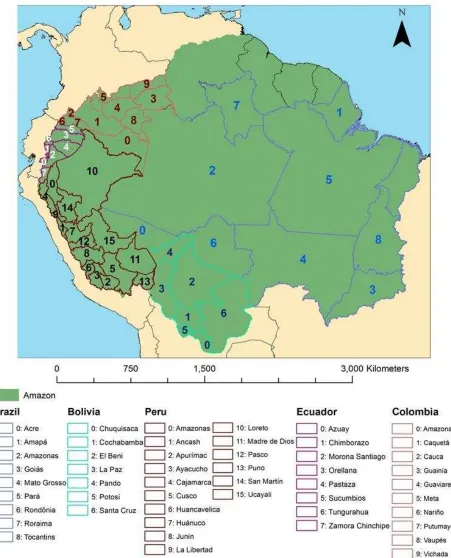
Figure 2. Study area ... 12
Figure 3. Ecosystem Services ... 15
Figure 4. Interactions between ecosystem services and food security ... 17
Figure 5. Interactions between ecosystem services and food security ... 18
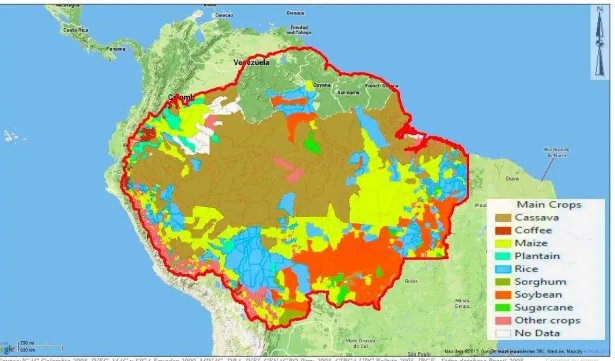
Figure 6. Main crops in the Amazon basin ... 23
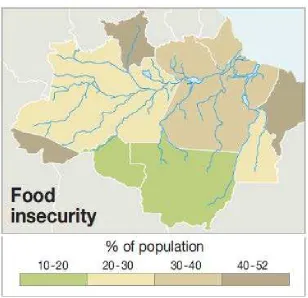
Figure 7. Food insecurity in the Brazilian Amazon in 2004 ... 27
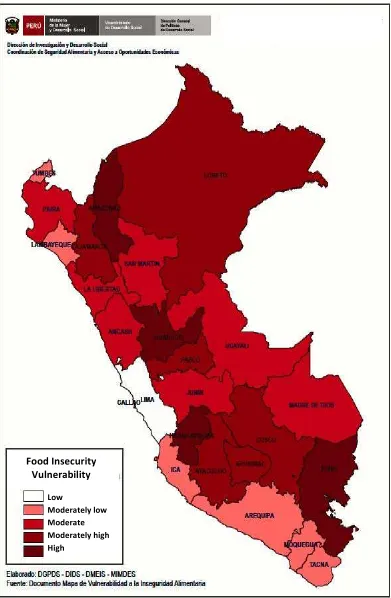
Figure 8. Food insecurity vulnerability in Peru (2009). ... 28
Figure 9. Food insecurity vulnerability in Bolivia (2006) ... 29
Figure 10 Percentage of food insecure households by region in Colombia (2005) ... 30
Figure 11. Percentage of food insecure households in Ecuador ... 31
Figure 12. Amazon food insecurity hotspot ... 32
Figure 13. The Terra-i land use change detection map between 2004 to 2011 ... 35
Figure 14. Soy expansion in the Brazilian Amazon, 1991-2005 ... 38
Figure 15 Cattle ranching in Brazil’s forests ... 40
Figure 16 IIlicit crops in Colombian Amazon for 2011 (ha) ... 43
Figure 17. Internal rate of return compared coca with other crops ... 44
Figure 18. Coca cultivation in Bolivia, Peru and Colombia ... 44
Figure 19. Projected Change in future precipitation and temperature (2050) for Amazonia. ... 48
LIST OF TABLES
1. INTRODUCTION
The Amazon is the world’s largest tropical rainforest, providing a wide array of ecosystem services that support human life and more than 2000 species of plants with nutritional and medicinal value. While the basin is among the least populated dense forests on Earth, it hosts around 39 million people and possesses an invaluable cultural richness: over 420 different indigenous groups who speak around 86 distinct languages (UNEP et al., 2009). However, despite this natural wealth, Amazonia’s ecosystems are continuously threatened by human interventions and changes in climate, severely impacting the food security of their population.
This report provides an overview of Amazonia's food security and the associated threats in the region, such as land use change and climate change and variability. The aim of this research effort is twofold: first, it attempts to identify those regions and populations in the Amazon basin that need more attention when it comes to hunger alleviation and improvements in nutrition, given the food security status. Second, based on a thorough analysis of natural and man-driven threats to ecosystem service provision and how these are linked to food production, delivery and access in the region, to discuss various policy pathways that could guarantee social, economic and environmental sustainability in the Amazon.
The study focuses on five countries that share territory in the Amazon basin, namely Bolivia, Brazil, Colombia, Ecuador and Peru. It is based on literature review of current knowledge on the impacts of land use change and climate change on ecosystem services, linkages between ecosystem services and/or threats and food security, as well as on best-practices experiences to sustainably manage ecosystems and agricultural systems in the region. Data for the state of food security has been collected from national and United Nations’ statistics database. However, it is worthwhile mentioning that in large parts, this type of data has been inconsistent, not updated and not disaggregated per Department. Furthermore, we used Geographic Information Systems (GIS) in order to estimate projected changes in temperature and precipitation in the Amazon basin, as well as to collect data on vegetation cover change (e.g. deforestation), by means of satellite imagery analysis.
2. FOOD SECURITY: Definition and Indicators
Concern for achieving food security worldwide has been explicitly articulated since 1948, when the United Nations Declaration on Human Rights recognized the right to food as a basic human right (Art. 25). Ever since, definitions of food security have varied considerably, encompassing distinct perspectives: a food-supply focus in the 1970s (according to which food security refers to all people having enough food), followed by a focus on entitlements in the 1980s. This perspective was mainly driven by Sen’s work on structural and process-related factors that lead to inadequate distribution of food, causing food insecurity (Sen, 1989). At the World Food Summit in 1996, the Food and Agriculture Organization of the United Nations (FAO) proposed a multidimensional definition of food security, referring to as a situation where “all people, at all times, have physical, social and economic access to sufficient, safe and nutritious food to meet their dietary needs and food preferences
for an active and healthy life” (FAO, 2008). Hunger, argued scholars, is more a
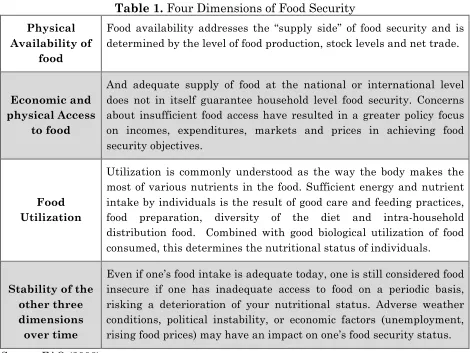
matter of poverty than of global food production (Adams et al, 204; Sachs, 2009). In consideration of the above, food insecurity results when any of its underlying conditions - availability, access, utilization and stability - are not met (Table 1).
However, the task of securing food is by far simplistic and straightforward. For instance, access to food depends on production and consumption patterns of food products (crops, non-crops, fish or livestock, among others), global and national food prices, trade relations, market dynamics or finance capital (Ericksen et al., 2010). Food production, distribution and access is also scale-specific (individual, household, national, regional and global) and associated with political and institutional conditions (policies, regulations or subsidies),environmental variables (land, water and climate) and socio-cultural norms and traditions (e.g. gender or religion).
Table 1. Four Dimensions of Food Security
Physical Availability of
food
Food availability addresses the “supply side” of food security and is determined by the level of food production, stock levels and net trade.
Economic and intake by individuals is the result of good care and feeding practices, food preparation, diversity of the diet and intra-household distribution food. Combined with good biological utilization of food consumed, this determines the nutritional status of individuals.
Stability of the other three dimensions
over time
Even if one’s food intake is adequate today, one is still considered food insecure if one has inadequate access to food on a periodic basis, risking a deterioration of your nutritional status. Adverse weather conditions, political instability, or economic factors (unemployment, rising food prices) may have an impact on one’s food security status.
Source: FAO (2008)
Following expert consultations, FAO (2013) developed a set of indicators to capture the four different pillars of food security (Table 1), distinguishing between
determinant indicators (reflecting the “structural conditions that worsen food
insecurity in absence of adequate policy interventions, including emergency assistance”) and outcome indicators (that refer to ‘“results in term of inadequate food consumption or anthropometric failures”). These indicators refer to:
• Food availability: average dietary supply adequacy, food production index, share of energy and protein supply (including protein from animal origin).
• Physical access: paved roads percentage, rail lines and road density.
• Utilization (access to improved water sources and sanitation facilities; percentage of children under 5 years of age underweight, wasted, stunted and percentage of adults underweight).
• Inadequate access to food: prevalence of undernourishment and food inadequacy, depth of the food deficit, share of food expenditure of the poor.
3. METHODOLOGY
3.1. Study Area
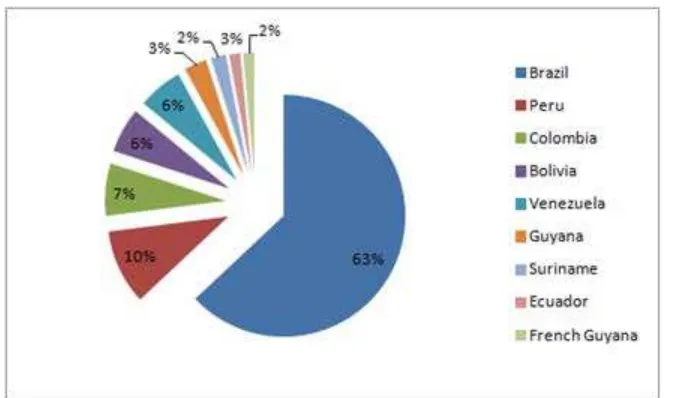
The Amazon is the world’s largest tropical rainforest, occupying 44% of South America’s continental area (approximately 6.4 million km2) and extending into eight
countries, namely Bolivia, Brazil, Colombia, Ecuador, Guyana, Peru, Suriname and Venezuela, plus French Guyana. Figure 1 illustrates the approximate distribution of the Amazon biome among the nine countries.
Figure 1. The Amazon: distribution per country. Source: ACTO (2008)
3.2 Data collection and analysis
The study has been largely based on desk analysis of available literature on linkages between ecosystem services and food security at global and regional (Amazon) level, the state of food security, the impacts of land use change (mainly through deforestation for agricultural expansion and intensification and the development of industrial activities), the effects of climate change as a “threat multiplier” for food security, as well as sustainable solution to mitigate trade-offs between economic development and social and environmental sustainability.
Most challenges related to data collection refer to the availability of up-to-date, disaggregated information regarding the state of food security in the Amazon region. In general, the data are disaggregated by country and there is little information for the Amazon region per se. The only documents addressing this topic in the Amazon basin were elaborated 15 years ago by the Amazon Cooperation Treaty Organization (ACTO), which fails to reflect recent development and trends in the region related to deforestation, the expansion of land for biofuels production or population growth. This also makes it difficult to draw conclusion tailored for the basin only, or to compare basin-level results with the overall food security state in the country.
Moreover, where information on food security is available for departmental level, it is strictly related to the attainment of the Millennium Development Goals (MDG) and does not go beyond hunger and malnutrition figures, missing out indicators that refer to physical and economic access to food or utilization.
Another aspect worth mentioning is that most of the publications that address the food security, land use change and climate change topics in the Amazon are focusing on the Brazilian rainforest. This indicates the need for more attention on the other countries that share territory in the basin too, since they are equally rich in biodiversity and in various ecosystem services essential for human subsistence and well-being and since the extent of the threats to food security reaches these regions too.
Climate Models (GCMs) for the year 2050. The average was calculated for both mean annual precipitation and mean annual temperature.
In order to identify and illustrate deforestation rates in the Amazon basin, we also used Terra-i, a monitoring tool that detects land-cover changes as a consequence of human activity in near-real times, with updates every 16 days and for every 250 m² of land. The tool is the result of collaboration between the International Center for Tropical Agriculture, The Nature Conservancy, the School of Business and Engineering and King’s College London1. The data are available for the entire Latin
America, from 2004 up until the present.
1
4. ECOSYSTEM SERVICES AND FOOD SECURITY
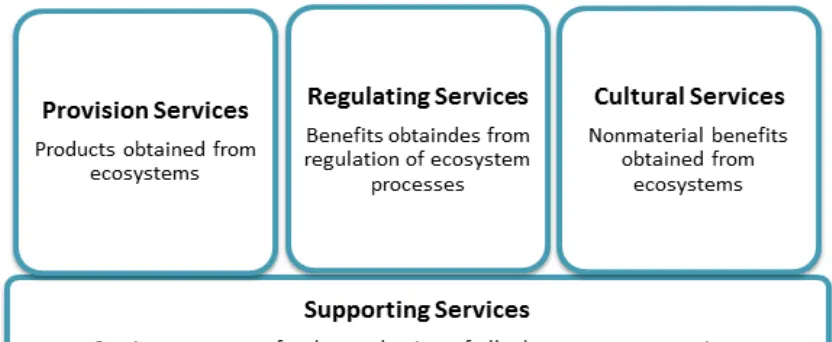
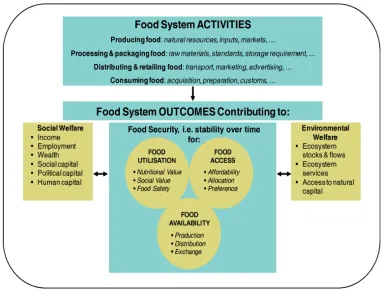
Ecosystem services have been referred to in the literature as the “conditions and processes through which natural ecosystems, and the species that make them up, sustain and fulfill human life” (Daily, 1997: 3) or as “benefits human populations derive, directly or indirectly, from ecosystem functions” (Costanza et al., 1997: 253). These include provisioning, regulating, and cultural services that directly affect people and supporting services needed to maintain the other services (Figure 3).
Figure 3. Ecosystem Services (MEA, 2005)
The provisioning services are the products obtained from ecosystems, including food
either indirect or occur over a very long time, whereas changes in the other categories have relatively direct and short-term impacts on people. Some examples of supporting services are primary production, production of atmospheric oxygen, soil formation and retention, nutrient cycling, water cycling, and provisioning of habitat (MEA, 2005).
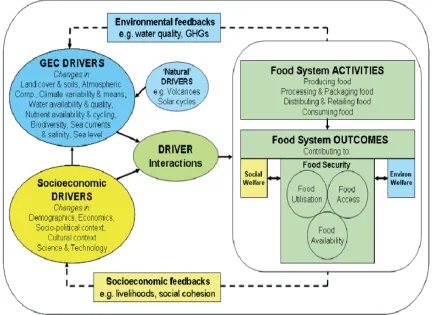
Figure 4. Interactions between ecosystem services and food security (GECAFS, 2009 cited in Ericksen et al., 2010)
Figure 5. Interactions between ecosystem services and food security (Ericksen et al., 2010)
The Amazon, the world’s largest tropical rainforest and among the least populated dense forests, provides important ecosystem services at different spatial scales. They include biodiversity –the approximately 5.4 million km²-large basin covers one of the world’s greatest assemblages of terrestrial and aquatic biological diversity (Dirzo and Raven, 2003), carbon sequestration by biomass and soils2, the regulation of water and nutrient cycles, the modulation of regional climate patterns, and the
amelioration of infectious diseases, which helps to sustain life at the local, regional and global levels (Chagnon, 2005; Fearnside, 2008; Malhi et al., 2008). Climate-regulating services are important for agriculture in the Amazon basin, which is the origin of the moisture that is transported to the breadbasket region of Brazil and further contributes to its center-west region where farmers grow soybeans (Martinelli, 2008). Moreover, the Amazon basin also hosts some of the largest stores of genetic material (Malhi et al., 2008), which plays an important role
2
in people’s diets. Ecosystem services also support agricultural production such as cattle, soybean and timber, which constitutes 6% of Brazil’s gross domestic product or GDP (it goes up to 25% after including agribusiness) (CRS 2006; Fearnside, 1989). Other services include hydroelectric power and evapotranspiration3,
transportation via river ways, access to freshwater and recreational opportunities.
Many of the world’s rural poor are dependent on the flow of ecosystem services to ensure their food security, both directly (e.g. wild food; Dugan et al., 2010; Bharucha and Pretty, 2010) and indirectly (e.g. pollination and pest regulation of crops; Ricketts et al., 2008; TEEB, 2010). Flows of services are shaped by complex dynamic systems that operate over multiple temporal and spatial scales and often exhibit stochastic behavior (Koch et al., 2009). This complexity makes it difficult to resolve an appropriate course of collective action to pursue sustainable livelihoods.
Food, nutrition and health of small-scale farming families in the Amazonia depend to a major extent on the benefits obtained from nature, ranging from the provision of a wide diversity of food resources, fuel wood for cooking and medicinal plants, to the sustenance of agriculture and disaster risk reduction. For instance, protein from forest wildlife plays a crucial role in food security for the rural poor. According to Nasi (2011), bush meat in the Amazon basin accounts for 63 + 25 kg/capita/year. Consumption is highly concentrated in low-income households and there seems to be a correlation between increasing income in the household and a transition to other sources of protein (e.g. poultry).
Another key service that is part of the diet of the local inhabitants is fish and its consumption can be alternated with bush meat. A significant percentage of the Amazonian economy and the nutritional sustenance of its inhabitants are based on the diversity of aquatic organisms –especially fish– that are important factors for the region’s economic, social and cultural movement. The fish production generated revenues between US$ 100 million and US$ 200 million per year since 1990 (UNEP, ATCO and CIUP, 2009).
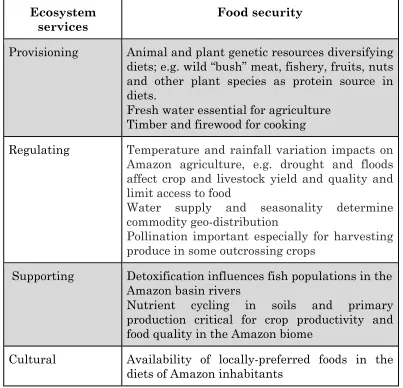
The following table (Table 2) provides an overview of the interactions between ecosystem services and food security in the Amazon basin.
3
Table 2. Ecosystem services and food security interactions in the Amazon basin
Ecosystem services
Food security
Provisioning Animal and plant genetic resources diversifying
diets; e.g. wild “bush” meat, fishery, fruits, nuts and other plant species as protein source in diets.
Fresh water essential for agriculture Timber and firewood for cooking
Regulating Temperature and rainfall variation impacts on
Amazon agriculture, e.g. drought and floods affect crop and livestock yield and quality and limit access to food
Water supply and seasonality determine commodity geo-distribution
Pollination important especially for harvesting produce in some outcrossing crops
Supporting Detoxification influences fish populations in the
Amazon basin rivers
Nutrient cycling in soils and primary
production critical for crop productivity and food quality in the Amazon biome
Cultural Availability of locally-preferred foods in the
diets of Amazon inhabitants
Ecosystem services support the food system, food productivity and, evidently, food security. However, food productivity may lead to a gradual loss of ecosystem services. For example, smallholder farmers in the Amazon may in part contribute to this loss, especially with regards to aboveground and root carbon, provided by secondary forest´s fallows, while the reduction in fallow age results in a reduction of biodiversity (Börner et al., 2007). This process could deteriorate due to agricultural intensification, which, on the other hand, may significantly increase the income of smallholder farmers in the Amazon. The ability to conserve the biodiversity of the Amazon will therefore require the involvement of smallholder farmers with measures implemented to improve their livelihoods.
5. AGRICULTURAL PRODUCTION AND FOOD SECURITY IN THE AMAZON
5.1. Agricultural production
Agriculture is a long-time economic activity in the Amazon, and it was the center of pre-Columbian domestication of various crops and fruit trees such as the Brazil nut, cassava, cocoa, cupuassu, guaraná, inga, peach palm, pineapple, and hot peppers (biquinho, cayenne, cumari, murupi, habanero, piri piri, tabasco), among other species (Borén et al., 2012). Some of these crops are now widely grown throughout the tropics and have become highly valued commodities.
Agricultural production in the basin follows the climate gradient –from the high rainy weather of the northwest to the wet/dry climate and long dry season of the south and east– which allows for more agricultural production in this region (Davidson et al., 2012). About 67% of the Amazon area under agriculture is found in Brazil4 followed by Peru with 14%, and Bolivia with 9% (Nepstad et al., 2008). In
the case of Brazil, the Amazon biome contributed to 28.9% of the country’s cassava production, 21.3% of banana, 14.2% of rice and 20% of cattle in 2001 (Simon and Garagorry, 2005). Cassava, maize and rice production prevails in the region. Soybean is highly concentrated in the southeastern Amazonia, but also in the northwestern parts of the basin (Figure 6).
The Amazon exports large quantities of food (beef within Brazil, fruits elsewhere, and soybean as livestock feed) to Europe and increasingly to China and the rest of the world. Meat consumption keeps increasing worldwide, especially when people become wealthy and where the eating of beef is regarded as a status symbol. Brazil expects their beef exports to increase by 29% and soybean by 39% by 2021 (Morton et al., 2006).
4
In the Colombian Amazon the main crops grown by farmers were in 2008 plantain (20 %), maize (17 %) and coffee (17 %), with 51,464 ha, 44,514 ha and 42,699 ha, respectively. Cassava, sugarcane, potato, Amazonian fruits, irrigated and upland rice and cocoa are also cultivated in the region, but to lesser extents (IGAC Colombia, 2008). However, cultivated land in the Colombian Amazon region does not exceed 200,000 ha, and is mainly concentrated in the Departments of Caquetá, Guaviare and Putumayo. Another activity that takes place in the region is cattle ranching, carried out mainly in the Departments of Caquetá, Guaviare, Meta and Putumayo. Agricultural activities, livestock, hunting, forestry and fishing account for 18.75% of regional GDP, with livestock activity contributing most to regional GDP (55%), followed by agriculture (32.6 %), forestry (7.3%) and fishing (4.7%). Meanwhile, Amazon contributes only 1% to the national GDP. It is noteworthy that during the period 2002-2007 both fish farming and its value decreased with 48.9% and 12.8%, respectively, representing a decline of this economic sector for the region (Fundación Alisios, 2011).
Data for agricultural production in the Amazonian Ecuador are scarce. The last agricultural census dates back to 2000. Accordingly, 19% of the area was represented by coffee followed by maize (11%), African palm (9%) and plantain (7%). Other crops in the area include citrus, potato, avocado, onion, hearts of palm, vegetables and fruits (INEC, MAG and SICA Ecuador, 2000). It is, however, worthwhile mentioning that soils in the Amazon region in Ecuador are not suitable for the cultivation of permanent crops and therefore much of the land is used as pastures. In 2002 around 19% (849,881 ha) of the total pastures in the country was in the Amazon region (SICA-MAG, 2002). These pastures also contributed with 8.2% of feed for the dairy cattle in 2000 (INEC, MAG and SICA Ecuador, 2000). Complementarily, short-cycle crops grown in the Ecuadorian Amazon are important for household consumption and local and national markets.
In the Amazonian region in Bolivia, the main crops in the farms in 2005 were soybean (27%), maize (14%) and rice (9%). Cassava, sugarcane, sorghum, plantain, sunflower and citrus fruits are among other crops grown in the region (CIRCA UPC Bolivia, 2005).
crops of importance to ensure access to food for subsistence farmers in the Amazon are maize and cassava.
For crops with greater cultivated area, such as maize, rice and cassava, we identified the Departments with average production for each of these crops for the period 2000-2011. In the case of maize, the Departments of La Libertad, Ancash, and Cajamarca had the highest average production 231.613 t, 152.434 t and 138.781 t respectively, but it is important to mention that only the eastern part of these Departments are part of the Amazon basin Meanwhile, the Departments of San Martin, La Libertad and Amazonas had the highest rice production in the Peruvian Amazon basin, with 424,821 t, 277,899 t and 234,990 t, respectively for the period 2000-2011. In the same period, total cassava production was 362,343 t in Loreto, 112,684 t in Amazonas, and 105.924 t n Ucayali (EEO 2013).
In addition to agricultural production, the Peruvian Amazon is a source of fish resources, this being the main source of animal protein for local people (Tello, 1998; Tello and Bayley, 2001, cited in Garcia et al., 2011). In economic terms, it is estimated that the annual production of fish in the Peruvian Amazon is 80,000 t year-1, which provides an annual income of US$ 80 million for the region (Bayley et
al., 1992, Tello and Bayley, 2001, cited in Garcia et al., 2011).
Agriculture in the Peruvian Amazon contributed 8.5% to GDP in 2011, with the Departments of San Martin and Loreto making the greatest contribution. This sector grew by 0.5 % in 2011 compared to previous year (MINAG 2011).
In the Brazilian Amazon the predominant crops are soybean (which occupies 59% of total cultivated area), millet (17%), rice (8%) and cassava (5%) (IBGE - Sidra database Brasil, 2008). Maize and rice –which are rotated with soybeans– are grown in medium-size farms (50–500 ha), and soybean cultivation and cattle ranching are in large size farms (> 1,000) that are held by wealthy landowners in this country. Upland rice has been recently grown under large-scale farming as first crop after forest clearing (Simon and Garagorry 2005). Smallholders also grow other cereals and fruits.
extents wheat and rice (Pineiro and Trucco, 2010). Hence, when analyzing food security it is imperative to further look at other indicators than production and explore in depth the factors that may directly or indirectly contribute to a food insecure population.
5.2. The state of food security in the Amazon
Despite the huge wealth of natural resources and of intensive agricultural production, many of its inhabitants are food insecure. In 2004, about ⅓ of the
population living in the Amazon was classified as medium to seriously food-insecure (UNEP et al. 2009).
The following maps (Figures 7 to 11) show the state of food security in the Amazon basin for different timeframes, depending on the information available. It is worthwhile mentioning that basin-level data regarding food security is very scarce and outdated. Indicators for food security are usually collected at national level and they mainly refer to the achievement of the Millennium Development Goal (MDG) 1, which refers to the eradication of extreme poverty and hunger, but do not necessarily take into account more specific indicators related to physical and economic access, utilization, political and institutional environment. Regional representative bodies, such as the ACTO, need to improve data collection and analysis related to food security in the Amazon basin, by strengthening national survey systems and support them in the compilation of data at lower scales.
Figure 7. Food insecurity in the Brazilian Amazon in 2004 (Source: UNEP, 2009)
Figure 8. Food insecurity vulnerability in Peru (2009) (Source: MIMDES, 2010)
Low
Moderately low Moderate Moderately high High
For Bolivia, at the municipality level, one can observe that some municipalities in the Amazon region, such as Filadelfia, Bello, Bolpebra, Villanueva, San Pedro and a part of the Benin department, present the highest level of vulnerability (food insecurity) (Figure 9).
Figure 9. Food insecurity vulnerability in Bolivia (2006) (Scale: 1 = not vulnerable to 5 = highly vulnerable) (Source: PMA and CIEE, 2011)
Municipal Food Insecurity Vulnerability 2006
Level of Food Insecurity
↑Increasing Level of Food Insecurity 2003 to 2006
↓ Decreasing Level of Food Insecurity 2003 to 2006
In Colombia, food insecurity at the household level (Figure 10), as reported by the Global Food Program and the National Institute for Family Wealth in Colombia, reveals that the most critical regions in terms of food insecurity are not in the Amazon. However indigenous communities in the Colombian Amazon face many challenges such as new settlement patterns, changes in consumption due to the external market dependency, the de-culturalization of indigenous ethnic groups, negative impacts of the paternalistic response of the State’s food assistance framework, the loss of seeds and traditional knowledge related to food production processes and the lack of integration of the social and cultural aspects of Amazon communities by policy makers (Tropenbos, n.d).
Figure 10. Percentage of food insecure households by region in Colombia (2005) (Source: ICBF and PMA, 2008)
The above makes food sovereignty in the Colombian Amazon vulnerable, due to the high dependence on food from other regions of the country and neighboring countries such as Ecuador, Peru and Brazil. Researchs in the Department of Amazonas shows that households spend 83.3% of total income on food such as cassava, plantain, fish, cassava flour, sugar, candy, cookies and soft drinks, which do not preserve indigenous food habits of the region. Hence, market integration of these people is demand- rather than supply-driven (Ruiz et al., 2007).
The Departments situated in the Amazon basin of Ecuador have the highest number of food-insecure households (Figure 11) (Calero León, 2010).
Figure 11. Percentage of food insecure households in Ecuador (Source: Calero, 2010)
Figure 12 shows the food insecurity hotspots in the Amazon basin, based on national statistics and secondary literature. There were above 40% food-insecure people in Roraima (northern Brazil), Acre (western Brazil) and Maranhao (eastern
Brazil) about in the mid of the last decade (UNEP, 2009). In Peru, food insecurity
vulnerability was very high (0.828, on a 0-1 scale) in the Department of Amazonas (third in country’s 2009 ranking), high in the Department of Loreto (0.688), above the national average (0.475) in San Martín and Ucayali (both at 0.563), and slightly below this average in Madre de Dios (Eguren, 2011). In Bolivia, food insecurity vulnerability was also high in the Departments of Pando and Beni (Zeballos et al., 2011), while the percentage of people living under food insecurity in Colombia’ and
Ecuador’s Amazon ranged between 25 and 30% in the past five years (ICBF and
PMA, 2008; Calero León, 2010).
6. THREATS TO FOOD SECURITY IN THE AMAZON
The previous sections revealed that despite the richness of natural resources and ecosystem services that the Amazon basin offers, a large part of its inhabitants remains food insecure. This section aims at shedding light over two important factors that affect, in a positive or a negative way, people’s food security in the Amazon: land use change (mainly through deforestation for various agricultural or industrial activities) and climate change (including weather extremes). Where these do not represent direct threats to food security, they indirectly impact food production, distribution and utilization, also indicating important trade-offs among development goals, poverty. food and health insecurity, environment and economic development.
Natural resources degradation and biodiversity loss may continue in the Amazon due to deforestation, poor pasture management, unsustainable slash-and-burn agriculture and large-scale farming (Amazon Initiative Management Team, 2007). Product prices, transportation costs and available technology have been further influencing land-use while biophysical processes and decisions of economic agents could change land cover (Cattaneo. 2002). Walker et al. (2009), indicate that politics also plays a role in Amazon deforestation and warn about the apparent inevitability of transforming forests into humid pastures.
The Amazon degradation also affects global climate due to increasing GHG emissions as a result of land-use changes, e.g. carbon liability amounts for soybeans and beef exports from the Amazon between 1990 and 2006 were 128 TgCO2 and 120
TgCO2, respectively (Zaks et al., 2009). Likewise, the agriculture of this region will
need to adapt to global warming, dry soils and altered rainfall patterns. Researchers hold that there may be a “savannization” of the eastern Amazon and more frequent wildfires across the Amazon, thereby increasing the risk of losing forests (Medeiros DuBois et al., 2012).
6.1. Deforestation
The largest clearing of tropical forest biome worldwide has been in Latin America, with about 60% occurring in the Amazon basin (Hetch, 2012), which represents around 40% of the global tropical rainforest. This rapidly continuing activity remains one of the most important global and regional challenges in this 21st
century (Boyd, 2008), alongside conversions of land for timber, among others (Barreto et al., 2005; Brown et al., 2005; Margulis, 2004). In the Amazon in particular, deforestation affects nutrient and water recycling from deep soil layers as well as soil pH and fertility5. Furthermore, it also causes collateral damage such
as drying of the forest floor, increasing frequency of fires, and decreasing productivity (Foley et al., 2008). Indigenous knowledge also mentions shrinking of the rainy season, reduced humidity –especially in the dry season– less water in the rivers and increased degradation of former primary forest soils, as consequences of deforestation (Madaleno, 2008). Wearn et al. (2012) estimate 9 to 16 vertebrates may be lost due to deforestation by 2050.
Table 3 summarizes trends of deforestation in the Amazon basin between 2004 and 2012. During this timeframe, the largest losses have been registered in the Brazilian Amazon (121,542 ha). This region also experienced the largest annual forest loss rate (almost 0.3% per unit area), mainly in the "Arc of Deforestation", which spans the States of Acre, Rondônia, Southern Amazonas, Northern Mato Grosso, Southeast Pará, Central and Northern Tocantins, and Maranhão. However, two aspects need to be mentioned. Firstly, habitat loss in the Amazon, despite being higher in Brazil, is not just a problem in this country but throughout the entire basin, and secondly, in 2012 Brazil registered the lowest deforestation scores since 1988 (4,500 km², compared to 27,000 km² in 2004) (Docksai, 2013).
Even though Bolivia did not experience such a high accumulated forest loss as Brazil during 2004-2011, the level is still significantly higher than the other countries that share the Amazon and the annual rate of forest cover loss is also close to the one registered in Brazil (Figure 13).
5
Table 3. Deforestation trends in the Amazon basin, 2004-2012
Figure 13. The Terra-i land use change detection maps between 2004 and 2011, zoomed on deforestation hotspots (yellow to red spots) for the nine countries of the Amazonia. Right inset: annual rate of habitat loss and accumulated loss, including
A large breadth of literature has attempted to identify the factors that contribute to the high deforestation rates in the region, especially in the Brazilian rainforest. Among the main ones are: market-driven agribusiness growth, expansion and modernization of traditional cattle ranching, slow growth of peasant agriculture, logging in forest frontiers, resurgence of agro-extractive economies (Pacheco et al., 2011), tax codes, fiscal incentives, interstate migration, monetary inflation, land prices, monetary policy, land tenure legislation, commodity price supports, forest reserve laws, and monitoring policies and devices from the early 1970s and 1980s (The Amazon Initiative Management Team, 2007). Below we discuss some of these drivers that have an impact on ecosystems services and food security, namely agricultural expansion and intensification, cattle ranching, demand for biofuels and illicit crops cultivation and road infrastructure construction.
6.1.1 Deforestation for agricultural expansion and intensification
South America has been experiencing a significant expansion of land for agriculture, which was export-driven, ever since the 1980s (Kastnera et al., 2012). In the Amazon, land cleared for agriculture constitutes the biggest sources of net GHG emissions (Galford et al., 2010). For instance, Galford et al. (2010) calculated that by converting natural vegetation and pasture for row-crop agriculture the GHG emissions in Mato Grosso in Brazil averaged annually 179 Tg CO2-e; i.e., over half of the typical country´s fossil fuel emissions. Moreover, slash-and-burn agriculture and, to a lesser extent, mulching increase further soil emissions of methane, nitric oxide and nitrous oxide (Davidson et al., 2008). Intensive use of fire for preparing land for agriculture and the leakage of this fire often degrade any surrounding remaining forests, thereby pushing towards an eco-climatic ‘tipping point’ into a more degraded scrub system (Nepstad et al., 2008).
tax breaks. Towards the mid-1990s, agricultural activities in Brazil´s Amazon grew at higher annual rates than in the rest of the country because it was seen as a “new frontier”, which led to an increase of forest clearing (Simon and Garagorry 2005). For example, Galford et al. (2010) indicate that croplands more than doubled from 2001 to 2006 (covering about 100,000 km2) and that new double-cropping
intensification occurred on over 20% of croplands in the state of Matto Grosso.
There has also been a rapid conversion of forests to agriculture through land development and colonization towards the eastern slopes of the Andes within the upper Amazon basin of Ecuador (Pichon, 1997). Soil quality, plot size, land tenure security, road infrastructure quality, settlement duration, household education, family labor availability, modern input and off-farm employment participation seem to have significantly affected land clearing and subsequent land-use changes in this area (CELOS, 2006).
Figure 14. Soybean expansion in the Brazilian Amazon, 1991-2005 Source: Mongabay (2008), based on data from Government of Brazil
Notwithstanding, it is important to note that the interactions between deforestation, expansion of pastures and soybean cultivation are largely affected by land use and tenure, infrastructure development, commodity prices, subsidies and policies. For example, demand for soybean leads to pasture lands to become more expensive croplands, and thus cattle ranching moving into forestlands. The availability of land at low prices, on the other hand, favors agriculture in extensive systems.
Between 1996 and 2004, soybean production increased with 123% in the Southern Cone of South America –including Bolivia (FAO, 2007). Soybean production reached 60 million t year-1 and the crop was grown in more than 22 million ha solely in
Brazil (Hecht et al 2012). Production increased from 3 million to 17 million t between 1998 and 2008 in Mato Grosso (Brazil) (Hecht, 2012)6. This involved the
replacement of other crops and pastures, but also forest clearings (FAO, 2007). For instance, more than 10% of the clearings in the Brazilian Amazon are related to soybean cultivation, mostly in the “Arc of Deforestation” (Hecht, 2012). Morton et al. (2006) further indicated that forest clearing for cropland was correlated to international soybean market prices. Arima et al. (2011) estimated that a 10% reduction of soybean cultivation in old pasture areas would have decreased deforestation up to 40% in Brazil’s Amazon.
However, the debate on the impacts of the increasing soybean production in Latin America has gone even further than environmental damage (e.g. deforestation or pollution due to use of pesticides) and economic growth, touching upon aspects of food security. Where soybean (including soybean oil) is used for human food and does not prejudice the cultivation of staple crops, it has potential to improve nutrition. However, the potential of soybean to improve food security in the Amazon has yet to be analyzed.
The relationship between food security and agricultural intensification has also been the subject of debate in the literature. While conventional wisdom postulates that the intensification of agricultural activities may bring efficiency in production (through the introduction of machinery and technology) and increase the possibility of feeding a continuously increasing population, more recent studies talk about the
6
role of smallholder farms in ensuring global food security, compared to large, commercial farms, according to the “paradox of the scale”, where “small and diversified farms rather than large monocultures show greater productivity per area”. Moreover, the nowadays food security problem is more an issue of food distribution and usage (e.g. food waste) than of food production or land availability (Tscahrnkte et al., 2012), thereby indicating that attributing merits of achieving food security to increased, large-scale production is a rather reductionist view.
In the Amazon basin, intensification of agriculture has been accompanied by increased mechanization and a change in land tenure patterns (replacement of small holdings with large holdings). Morton et al. (2006) estimated that intensive mechanized agriculture in Brazil´s Amazon grew over 3.6 million ha. Further research has also shown that the expansion of mechanized crops (e.g. soybean) in Mato Grosso (Brazil) has replaced smallholders with large, industrial landowners (10% of farms occupying 82% of productive land), leading to illegal occupation of land, slave labor and an increase in the number of landless people and urban poor in the last decade (Bickel and Marteen Dros, 2003).
Last but not least, analyzing aspects of low-carbon agriculture and forest conservation in the Amazon, Soares-Filho et al. (2012) indicated that intensification of agriculture may come at a cost to the environment. This is because croplands will release significant amount of both nitrogen and phosphorus from fertilizers and organic matter, and could pollute agro-ecosystems by releasing nitrites, nitrates and pesticides into water streams.
6.1.2. Deforestation for cattle ranching
Cattle ranching and pastures development (which occupies more than 70% of deforested area) together with smallholder shifting agriculture are the major drivers of deforestation in Brazil´s Amazon (Hecht et al 2012). For instance research argues that around 4/5 of direct deforestation in the Brazilian Amazon is attributable to cattle farming, while crop expansion (especially soybean) is responsible for only 1/5 of total deforestation (Morton et al., 2006; Nepstad et al., 2009).
Figure 15 Cattle ranching in Brazil’s forests (UNEP, 2009)
Invasion of Amazon’s forest in Brazil has also occurred as a perverse effect of monoculture expansion (e.g. soybean in the Cerrado), displacing the cattle industry into Brazil´s Amazon (CIAT, 2012). Furthermore, cattle ranches and crop fields have replaced forest along the roads (especially the Trans-Amazon highway), thereby removing valuable timber from the remaining forest.
As mentioned before, data for the other countries sharing the Amazon is rather scarce and outdated. An ACTO document dating back from 1997 argued that in the Department of Caquetá (Colombia’s Amazon), approximately 2 million hectares of primary forests were cleared out for grazing, secondary forests and high-productivity crops at the beginning of the 1990s. In the case of Ecuador, the land surface dedicated to pastures is larger than the one for crops (around 82.5%), livestock farming being the second most important productive activity in the country (after petroleum production), despite the negative impacts this activity has on the already fragile soils (ACTO 1997).
Biofuels
The debate over the cultivation of crops for biofuels (regarded as a strategy to mitigate climate change) is also closely linked with the food security debate. For instance, previous research in the Brazilian Amazon has illustrated that the expansion of biofuel crops, a present reality due to increased national and international demand for biofuels and environmental standards, can have serious implications on goods and services providing from forests (when forests are converted to cultivated land) or even on socio-economic conditions, where crops for biofuels are grown on already cultivated land. This may include a reduction in livelihoods opportunities, new power relations (between small- and large-scale farmers) or change in land tenure patterns, among others (Lima et al., 2011), which may also have spillover effects on food security (regarding access, utilization, distribution of food). At the same time, it has been, however, argued that only a small portion of the soybean production in Brazil is used for biofuels (Lima et al., 2011) but that in order to meet the biofuel production targets that the country committed to, an additional 57,200 km² and 108,100 km² of sugarcane and soybean will be needed (Lapaola et al., 2010).
In the last decade, Cunha da Costa (2004) advocated for biofuel production from palm oil in the Amazon degraded lands. The author selected this crop as biofuel source due to its ability to generate income, create jobs, restore land, and avoid carbon emission from fossil fuels. Bioenergy crops are also being promoted in Peru´s Amazon as alternative to coca plantations, especially in deforested land that is being converted to palm oil plantations (Khwaja, 2010). Further analysis by Gibbs et al. (2008) suggests that biofuels can provide a short-term carbon payback in highly degraded pastures of the Amazon. They acknowledged however, that biofuel farming in such marginal lands will require more area than in better lands because of low yields, and may also need more intensive-energy management (with inputs such as fertilizers and irrigation water) to be productive. This might imply that this crop can thrive to habitat change as well as more contamination derived of chemical use. Moreover, Lapola et al. (2010) indicate that indirect land-use changes could offset any carbon savings from biofuels, especially when expanding into the Amazonian forests, and may create a carbon debt to repay in 250 years when using them instead of fossil fuels.
farmers’ vulnerability will increase, due to the absence of safety nets for their production (FAO, 2007).
Recent research has shown, however, that oil palm expansion, encouraged by the high financial return of the seed (compared to soybean or beef) and the “logging subsidy” producers benefit from is likely to threat standing forests in the Brazilian rainforest, as a consequence of Malaysian investments in the palm oil sector in Brazil and the proposed revision of the forest law, which would allow for the conversion of up to 30 % of the Brazilian Amazon into oil palm plantations (Butler and Laurence, 2009). Researchers at the Woods Hole Research Center calculated the potential of oil plantations in the Brazilian Amazon and came to the conclusion that the forest area is far more suitable for oil palm (2.283 million km²) than for soybean (390,000 km²) or sugar cane (1.988 million km²) (Nepstad et al., 2007).
Currently there are a number of public and private initiatives for biofuel production in the Peruvian Amazon. The departments with greatest potential for sugar cane and oil palm are San Martín, Loreto and Ucayali (a total area of 1,074,756 hectares suitable for these crops). Additionally it is estimated that 270 biofuel processing plants could be installed, which could bring benefits to local communities in terms of employment and income generation. Moreover, research found that future biofuel production could become an important productive activity in the region, contributing to meeting domestic demand for biofuels. Infrastructure and technology for the production of biofuels, however, currently poor (IIAP and SNV, 2008).
In other cases, land clearing for different industrial activities may not have direct impacts on food security, but may change consumption patterns and diets (given birth to a new consumerism wave, including canned food or alcoholism) and further spawn social problems such as displacements, changes in traditional culture or power relations at community level, among others (González, 2003).
Coca plantations
due to displacement of the rural population to the coca zones, and the decay of traditional agricultural activities.
Figure 16. Illicit crops in Colombian Amazon 2008 to 2011. Own elaboration, based on SIMCI data (2008 to 2011)
Previous research has pointed out the comparative profitability of coca plantations in relation to, for instance, cultivation of banana, maize, cassava, pineapple, etc, given that transportation is ensured by intermediaries and not by the farmers (Figure 17).
0 2000 4000 6000 8000 10000 12000
Ilic
it
C
rops
(ha)
Colombian Amazon Departments
2008
2009
2010
Figure 17. Internal rate of return compared coca with other crops. Ananás = pineapple, Caucho = rubber, Maíz = maize, Yuca = cassava, dulce = sweet, amargo =
bitter. Source: SINCHI (1999) in Gonzales Posso (2000)
Figure 18. Coca cultivation in Bolivia, Peru and Colombia. Source: UNODC (2007), cited in UNEP et al. (2009)
Previous research in the Colombian Amazon has shown that coca plantations, while considered a highly profitable rural activity in many parts of the region, have severely impacted food security of the population living where the crop is cultivated. Indigenous populations have started to switch to canned food instead of eating fish and cultivating crops, since cultivation of coca can become more profitable. Likewise, this phenomenon was also caused by the colonization of Amazonian territories with raspachines (“coca leaf pickers”), who arrived in the late 1970s in the region and imposed different, western-based consumption patterns. They “lack a farming culture and import from cities of the interior (and often from neighbor countries) a large part of the food they consume and at high prices” (Gonzales Posso, 2000). Moreover, coca cultivation has also impacted people’s health, due to the contamination of rivers with pesticides and herbicides used in order to increase profits from coca plantations (Gonzales Posso, 2000).
Infrastructure development has often been linked with changes in land use (mainly deforestation), while increasing connectivity between regions and facilitating transportations of goods and people. Although the direct links between road construction and development and food security have not been explicitly explored in the Amazon context, one can assume that increased food access via infrastructure is one important factor that can contribute to people’s food security, given that food transportation via rivers is slower and also dependent on seasons. However, this has not only important positive social and economic implications (encouraging economic development, access to markets, increasing human wellbeing and social cohesion), but also brings about negative environmental impacts (e.g. deforestation and biodiversity loss).
Several infrastructure projects (e.g. road or dams) are being developed in the Amazon region or close to the Amazon region. A recent study analyzed the impact of deforestation of five road infrastructure projects7: (1) the Santa Cruz-Puerto Suarez
Corridor in Bolivia; (2) the BR-364 Highway in Brazil; (3) the Pan-American Highway section in Darien, Panama; (4) the Trans-Chaco Highway in Paraguay; and (5) the Initiative for the Integration of the Regional Infrastructure in South America (IIRSA) Integration Corridor in Peru. Impacts are both direct and indirect. A road makes a different “footprint” depending on the ecosystem (in the Andes, deforestation occurs at less than 10km from the road, in the Amazon at an average of 50 km, and in the Chaco region at more than 50 km from the road).
The study revealed that roads have been an important driver of deforestation and land-use change in the region (See Appendix 1-2). In Brazil for instance, deforestation rates increased 40 to 70 % after the completion of the BR-364 Highway, which is divided into two main sections – S1 in the State of Acre and S2 in the State of Rondonia (where most of deforestation was concentrated). Both departments are in the Amazon basin. Likewise, in Peru most of deforestation occurred in the Departments located in the Amazon (Amazonas, Loreto, Madre de Dios, San Martin, and Ucayali). It was associated not only with agricultural expansion (MINAM Peru, 2009), but also with the construction of the IIRSA corridor that facilitated human settlement and encouraged the cutting of forests (Reymondin et al., 2013). According to the same study, deforestation occurred in a buffer zone of 10 km around the road.
7
For more information about the Project, see IDB website: http://www.iadb.org/en/publications/publication-detail,7101.html?id=70018#.UkM3wBCWlrV
The Government of Colombia has designed several initiatives for the development of road infrastructure in the Amazon, including “Programa corredores arteriales complementarios de competitividad” (“Complementary Arterial Corridors for Competitiveness Program" in English), which involves the construction of seven corridors in the Colombian Amazon in order to improve the accessibility conditions of the municipalities where agricultural output is the economic mainstay. Additionally, the government is planning some infrastructure projects in the border areas between Ecuador and Peru, with a view to improve the access, transport of cargo and passengers and finally contribute to better integration and regional development (Fundación Alisios, 2011). It has not been evaluated; however, whether the construction or improvement of all the roads mentioned above has had any effects on food security in the region. One can assume that access to food is likely to have improved, indicating once more the trade-offs between environmental conservation and social and economic development.
6.2. Climate Change
Predicting the future climate of the Amazon region is a hugely complex process that involves an inherent level of uncertainty. Global Climate models (GCMs) are one of the primary instruments used to project future climates (Wilby and Harris, 2006). Malhi et al. (2009) notes that projecting changes in precipitation in the Amazon remain particularly challenging for climate models, and substantial variation between the models exists (Malhi .et al, 2009). The Hadley model (HadCM3), for example, produces the driest future conditions, with a substantially reduced rainfall regime (Malhi et al., 2009). Such a reduction in rainfall would likely change the composition of the Amazon, and may result in a transition to a seasonal forest biome (Malhi et al., 2009). Other four models suggest that future climate conditions would struggle to maintain the current rainforest biome (Malhi et al., 2009).
In spite of above, Betts et al. (2008) noted that the 23 GCMs employed by IPCC provide general climatic trends. For instance, based on mid-range climate projection, 50 to 70% of the models revealed a substantial (>20%) reduction in dry season rainfall in the eastern region of the Amazon (Betts et al. 2009), with the potential that the future biome may be seasonal forest (Malhi et al., 2009). This scenario could potentially affect regional production of maize, sorghum, soybean and rice (Figure 6). On the other hand, the western Amazon is likely to be comparatively wetter with climatic conditions that maintain a future rainforest biome (Malhi et al., 2009). Furthermore, the Amazon region will warm, although predictions for the range of temperature increase by the end of the century varies in the order of 5°C (Betts et al.,2008).
Figure 19. Projected change in future precipitation and temperature (2050) for Amazonia. (Source: CIAT, 2013)
Land use change (e.g. deforestation or forest fragmentation) and human pressures are affecting the ecosystem services and longevity of the Amazon rainforest. As a result, severe social, economic and environmental repercussions may ensue (Malhi et al., 2009; Nepstad et al., 2008; Cochrane and Laurance, 2008; Laurance and Williamson, 2001). Fire, due to its capacity to facilitate drought events and change regional climatic cycles, could be exacerbated by global warming. It has been identified as one of the major threats facing the Amazon Basin (Nepstad et al.,
2008; Malhi et al., 2009). Currently, 20 million hectares of previously forested area in the Amazon basin are prepared for agriculture using burning techniques (Cochrane and Laurance, 2008).
Laurance and Williamson, 2001). Furthermore, forest fires release smoke into the atmosphere producing an increase in aerosol content (Malhi et al, 2009; Nepstad et al, 2001). There evidence suggests that rainfall may reduce in the dry season (Malhi et al.,2009), and could increase the future likelihood of drought events (Malhi et al., 2009). Drought and fire episodes are interconnected (Nepstad et al., 2001). For example, a severe drought that occurred in 1998 (an El Niño year) was accompanied by severe reductions in forested area (39,000 km2), accumulating in a rate of forest
loss 13 times greater than that recorded in an average rainfall year (Alencar et al., 2006). In total 91% of the forest area lost to burning in the Brazilian Amazon was within 4 km of agricultural clearings (Alencar et al., 2006).
Under natural conditions the Amazon has a low chance of fire occurrence (Sanford et al., 1985). This is despite evidence that parts of the Amazon can become temporary flammable during dry spells. However, a lack of ignition sources ensures that natural fires are uncommon (Malhi et al.,2009). Meggers (1994) noted that fire occurrences in intact Amazon forest were generally related to uncharacteristically severe El Niño-Southern Oscillation (ENSO) occurring every 400 to 700 years. A large proportion of tree species in the Amazon consequently possess limited resilience to fire, and therefore, even low intensity fires can have devastating effects (Cochrane and Schulze, 1999).
It is worth highlighting that the ENSO significantly affects the rainfall patterns in the Amazon basin (Coe et al., 2002). During an El Niño year sea surface temperatures rise along the Pacific coast of South America, which can result in higher temperatures, reduced precipitation (Nepstad et al., 2008), and decreased flow of the Amazon River and its major tributaries (Foley et al., 2002). On the other hand, wetter conditions, increased river flow and flooding are often found during La Niña years (an anomaly of unusually cold sea surface temperatures found in the eastern tropical Pacific) (Foley et al.,2002). The worst droughts have been recorded in the Amazon in El Niño years, such as the 1998 drought that facilitated large scale occurrences of forest fires (Nepstad et al., 1999). Furthermore, in El Niño years the dry hot conditions cause the Amazon to act as a source of carbon. Tian et al., (1998) found that up to 0.2 pg of carbon were released by the Amazon in 1987 and 1992, whilst in wetter and cooler years the Amazon acts as a carbon sink, for example up to 0.7 pg of carbon were sequestered in 1981 and 1993.
decades have seen a number of severe drought events. The 2005 drought, which was not due to El Niño, but an extended dry season, caused widespread economic and social damage throughout the Amazon basin (Morengo et al., 2013). The drought reduced the flow of the Amazon River, and problems with navigation and trade were reported in the Madeira, upper and central reaches of the Amazon (Morengo et al., 2005). Small-scale farmers and communities reliant on river networks for commerce experienced severe economic losses (Morengo et al., 2013). Furthermore, generation of hydroelectricity and agricultural production were also reduced (Morengo, et al, 2013). Coffee was the most affected crop in Rondonia, Brazil, a Department in southwestern Amazonia (Figure 1). With production in 2005 (75%) and 2006 (82%) substantially reduced, the State of Acre (Figure 1), also witnessed a notable decline in total coffee production (15%) in 2006 (Morengo et al., 2013). Fisheries in the Amazon were also affected. For example, the western Amazon states of Rondonia (roughly 50%), Amazonas (-7.2%) and Acre witnessed substantial reductions in fish catches in the year 2005 compared to 2004 (Morengo et al., 2013). Furthermore, food shortages affected many people in the Amazon basin and smoke from forest fires resulted in an increase in respiratory problems for peoples living in the basin (Morengo et al., 2013). In Acre, hospital admissions for respiratory problems and water borne diseases increased from June to December 2005, which was the drought period (Morengo et al., 2013).
Global warming will likely increase the frequency and severity of droughts due to the expected rise in temperatures and increase in the length and severity of the dry season (IPCC, 2007). Although hard to predict, there are suggestions that future agricultural productivity could be affected by adverse climatic conditions. For example, Lapola et al., (2011) found soybean yield may reduce by up to 40% under the worst-case scenario. Rising temperatures, low rainfall and further water scarcity could reduce banana/plantain, grains (cereals and legumes) and coffee outputs (Ortiz, 2011 and references therein). The combination therefore of burning for agricultural purposes, pressures from deforestation and selective logging, and an increase in drought frequency (Eduardo et al., 2007), requires policy measures that are holistic and incorporate sustainable agriculture within a framework that ensures the continued functioning of Amazonia’s ecosystem services.
Table 4. Stress conditions associated to climate change faced by Amazon farmer and their respective vulnerability types
Stress related to climate change
Vulnerability types
Extreme drought Planting time and risk of ‘seasonal trap’, loss of crops and productivity, flammability of land cover, water quantity and quality, infectious and non-infectious diseases
Extreme flooding level variation
Residency pattern, access fishing and planting grounds, transportation and access to market, water quantity and quality, infectious diseases
7. FOOD SECURITY THREATS TO DIFFERENT AMAZONIAN POPULATIONS
There are almost 39 million people living in the Amazon. Most of them are in Brazil (approximately 75 %) and Peru (around 11%). The highest population growth rate has been registered in urban areas, especially in Brazil, Colombia and Ecuador, but also Bolivia and Peru.
While consumption patterns of urban population are largely determined by a globalized market, rural people find their source in proteins in hunted wild animals, after fish8. The increase in population density in urban areas and the trade to
supply large population centers, has lead to a decrease in the diversity and density of larger animals (ACTO 1997).
There are various indigenous groups whose settlements are located in deep forests and their dependence on forest products (timber and non-timber) is high. Unlike urban communities whose living is closely tied to income and purchasing power, their subsistence depends on the availability of and access to natural resources (e.g. water or land that are considered a collective right). About 3% of the total population belongs to 40 indigenous populations. They group in around 420 different ethnicities and speak 86 distinct languages (UNEP et al., 2009). Figure 20 illustrates the number of inhabitants and indigenous populations living in the Amazon.
8
Figure 20. Indigenous populations in the Amazon9. Source: UNEP et al. (2009)
New forms of land tenure, as a consequence of the replacement of smallholding with large, commercial holdings (mainly for crop and livestock production), new consumption patterns that disregard local social and economic dynamics and traditional institutions represent a continuous threat to the traditional lifestyle of the indigenous populations in the Amazon (UNEP et al., 2009). For instance, the large expansion of the agricultural frontier (especially for livestock) and of the oil industry in the 1950s up until the 1970s in the Colombian Amazon was associated with an important process of colonization of indigenous territories and therefore alteration of traditions and customs (UNEP et al., 2009).
Vulnerability of Amazonian people and groups has been described in terms of geographic location, social and economic inequity, access to basic service services and natural resources, malnutrition, illiteracy, unemployment, exposure to environmental risks. As mentioned earlier, around 35% of the Brazilian population in the Amazon was food insecure in 2004 and another 4 million people living in the Andean Amazonia lack appropriate drinking water and sanitation infrastructure (UNEP et al., 2009). Table 5 provides some demographical statistics for the Amazonian countries where food security hotspots identified in Section 5.2 are located.
9