Structural Causal Model for Cacao Marketing in
West Sumatra, Indonesia
Hasnah
1, Renato A. Villano
2, Ian Patrick
3and Euan Fleming
41.
PhD student, UNE Business School;
Lecturer, Faculty of Agriculture, Andalas University, Padang, Indonesia
2. Associate Professor, UNE Business School
©Copyright 2013 by Authors’ names.
Structural Causal Model for Cacao Marketing in West
Sumatra, Indonesia
Hasnah
1, Renato A. Villano
2, Ian Patrick
3and Euan Fleming
41.
PhD student, UNE Business School;
Lecturer, Faculty of Agriculture, Andalas University, Padang, Indonesia
2. Associate Professor, UNE Business School
3. Acting Director, The Institute for Rural Futures, UNE
4. Professor, UNE Business School
Abstract
Structural equation modelling was used to identify the determinants of cacao
prices received by farmers in West Sumatra, Indonesia. Results revealed that the
prices at the farm level were correlated with the marketing practices of farmers
and marketing intermediaries (village buyers and wholesalers). On the farmers’
side, “ability to meet required quality”, “the main buyer” and “the distance from
farmers’ location to export point” directly influenced the farm-gate price. From
the buyers’ perspective, farm-gate price was affected directly by the selling price
received by marketing intermediaries. Capital and price information were the
main determinants of their selling price.
Keywords:
Price determinants, bargaining power, price information, structural equation modelling.
Introduction
Cacao industry has played an important role in Indonesian export earnings. Exports of cacao
beans reached 535,236 tonnes with a value of US $1.414 billion in 2009 (Directorate General
of Plantations of Indonesia, 2012) that placed it as the third largest export earner in the
Indonesian agricultural sector after palm oil and rubber. Indonesia is the third largest
cacao-producing country after Ivory Coast and Ghana.
the price of cacao beans could be a source of concern for cacao producers. It directly affects
their welfare and has multiplier effects on non-agricultural sectors in rural areas.
Panlibuton and Meyer (2004) figured the major functions and participants in the Indonesian
and global cocoa value chain. Cacao producers, marketing intermediaries (local collectors and
local traders), processing industries, and exporters are the actors in the supply chain of
Indonesian cacao. In the global value chain, the Indonesian cacao products from small-scale
exporters go through one marketing channel, while it involves multiple marketing channels
for cacao products from other exporters including medium and large scale exporters,
multinational affiliates, and manufacturing and processing companies.
A competitive market structure should be encouraging farmers to maximise production in
order to utilise the benefit through the price they receive; however there are other non-market
factors that limit their ability to maximise their returns. The small size of landholding restricts
farmers’ endeavours to increase their cacao output. This factor is worsened by the
unavailability of farm credit in which borrowing capital from brokers, called tengkulak, is the
only option for farmers to finance their production and daily consumption needs (Arsyad,
2010). Arsyad noted that the smallholders have to repay their debt with cacao products at the
price set by tengkulak, which is sometimes lower than the market price. This condition
indicates that there is an interest rate charged to farmers for their debt. Moreover, Arsyad
observed that smallholders also lack access to market information, agricultural extension and
non-agricultural business opportunities.
A study by Handayane (2007) in Padang, West Sumatra found that cacao production was
unprofitable with a B/C ratio of 0.9. This ratio was much lower than that in Kolaka, Southeast
Sulawesi accounting for 2.8 (Sahara, Abidin, and Dahya, 2005). Marketing problems facing
cacao farmers as observed by previous studies may partly contribute to unprofitable of cacao
farming via low price received by farmers.
Price is one of factors contributing to the profitability of cacao farming. It has a critical
bearing on poverty and the vulnerability of smallholders. It can be an incentive for farmers to
adopt technology on agronomic practices properly in order to increase the yield of cacao
trees. A study by Alene et al. (2008) found that maize price influenced adoption and intensity
of use of fertilizer. In short term, cacao output responds 1.2 per cent to every 10 per cent
change in price, while it reaches 18 per cent for every 10 per cent change in price in long-term
(see: Norton, Alwang, and Masters, 2010). Therefore, determinants of the price of cacao
beans received by farmers need to be explored in order to increase the potential of the cacao
industry to improve farmers’ welfare that leads to poverty alleviation.
Dependency of information on cacao price from buyers (Asmelia, 2007) and indebtedness to
buyers (ACDI/VOCA, 2005; Asmelia, 2007) can be factors influencing low price received by
farmers. This condition may weaken bargaining position of farmers relative to buyers and rely
on particular buyers to sell their cacao beans. Low quality of cacao beans due to infestation of
cacao pod borer is another factor contributing to low price received by farmers (Badcock,
Matlick, and Baon, 2007).
condition forces farmers to sell their cacao to the same intermediaries who provide the loan,
ensuring these dependent farmers have less bargaining power than farmers who do not rely on
borrowing from the cacao buyers.
Imperfect information and collusion by marketing agents contribute to low prices received by
farmers (ACDI/VOCA, 2005; Alwang and Marió, 2008). Low levels of marketing skill and
knowledge among cacao farmers in Indonesia limit their options in the local market, and
constrain income generation (ACDI/VOCA). Their lack of knowledge of market prices,
poverty and weak bargaining power arising from illiteracy and low social status often enable
traders to cheat farmers (Pokhrel and Thapa, 2007).
Norton, Alwang, and Masters (2010) asserted that a large difference between the price
received by producers and the retail prices is a signal of weaknesses in marketing systems.
They noticed that infrastructure deficiencies, lack of information on producers' level, the
weak bargaining position of producers, and government's intervention in marketing are the
main weaknesses in marketing systems in developing countries.
This paper discusses issues in cacao marketing from the farmers’ and buyers’ perspectives
using path analysis. This method allows researchers to assess the cause-effect relationship
among variables in a complex system. The discussion focuses on factors affecting the price
received by farmers and buyers for the cacao they sell in the domestic market in West
Sumatra, Indonesia.
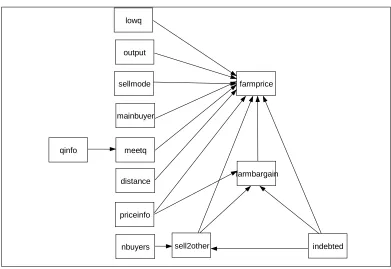
The proposed model for cacao marketing from farmers’ perspective is depicted in Figure 1.
The model illustrates the factors affecting the price of cacao beans received by farmers. It
includes 13 measured variables with unidirectional paths, which are characteristic of a
recursive model.
Figure 1. Initial Model for Cacao Marketing from the Farmers’ Perspective
mainbuyer output
lowq
meetq qinfo
priceinfo distance
farmprice
farmbargain
sell2other nbuyers
sellmode
Farmprice in the model represents the price received by individual farmers. At farm level,
individual transactions occur between farmers and marketing intermediaries (village buyers
and wholesalers). The price difference in individual transactions can be influenced by unique
attributes such as variation in quality of individual lots, different locations, differing terms of
trade and imperfect information (Tomek and Robinson, 2003).
The initial model in Figure 1 can be written in four sets of structural equations. Equation (1)
presents the relationship between sources of quality information and the variable, meetq
(quality meets the buyer’s requirement). Equation (2) describes factors contributing to the
price received by farmers. Equation (3) formulates factors affecting the ability of farmers to
bargain on price, and equation (4) relates to factors affecting the ability of farmers to sell their
cacao beans to buyers other than the main buyer.
meetq
=
α
1 +β
1qinfo
+ ε
1(1)
farmprice
=
α
2+
β
21lowq +
β
22output +
β
23sellmode
+
β
24mainbuyer +
β
25 meetq +β
26distance
+
β
27priceinfo
+ β
28sell2other +
β
29farmbargain
+
β
210indebted
+ ε
2(2)
farmbargain =
α
3 +β
31priceinfo +
β
32sell2other +
β
33indebted
+ ε
3(3)
sell2other
=
α
4 +β
41nbuyer +
β
42indebted
+ ε
4(4)
where:
α
i refers to the intercept associated with the ithdependent variable
i is the first subscript to identify the dependent variable in the equation, which has
value of 1, 2, 3, ...
β
ij represents the path coefficient that links the ithdependent variable and the j
thindependent variable.
j is the second subscript to identify the variable that has a direct effect on the
dependent variable in the equation, which has a value of 1, 2, 3, ...
ε
i is the error associated with the ithdependent variable.
The description of the equations above also applies to structural equations for cacao
marketing model from buyers’ perspective.
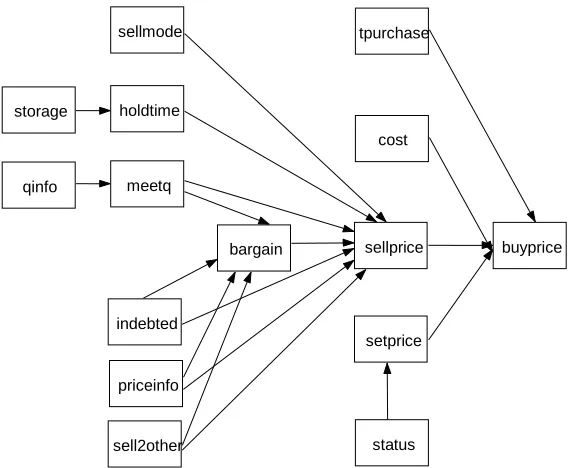
The cacao marketing model from the buyers’ perspective, illustrated in Figure 2, involves 15
variables. In the diagram, buying price (buyprice) is the variable that links buyers to farmers.
It is the price paid by marketing intermediaries to farmers, which is the reflection of farm
price from farmers’ perspective. Buying price at the marketing intermediary level is presumed
to be determined directly by five variables.
Figure 2. Initial Model of Cacao Marketing from the Buyers’ Perspective
The relationships among variables in the path model in Figure 2 can be written in structural
equations which consist of six equation sets. Equations (5) - (7) describe factors contributing
to the buying price. Equations (7) – (10) relate to factors affecting the selling price.
setprice
=
α
1+
β
1status
+ ε
1(5)
buyprice
=
α
2 +β
21tpurchase +
β
22cost +
β
23 sellprice+
β
24setprice +
ε
2(6)
sellprice
=
α
3 +β
31sellmode +
β
32holdtime +
β
33meetq +
β
34bargain
+
β
35indebted +
β
36priceinfo +
β
37sell2other +
ε
3(7)
holdtime
=
α
4 +β
41storage
+ ε
4(8)
meetq
=
α
5 +β
5qinfo
+ ε
5(9)
bargain
= α
6+
β
61meetq +
β
62indebted +
β
63priceinfo +
β
64sell2other +
ε
5(10)
Methods
This study was conducted in West Sumatra province for two reasons. First, West Sumatra is
designated as the production centre for cacao in Western Indonesia. Second, cacao
development in this province is mainly funded by the provincial and regency governments,
indicating their strong interest in developing the cacao industry. Three municipalities are
involved in this study – Pasaman, 50 Kota and Solok – which were selected based on their
distance to the export point. Solok is located close to the major provincial city and market of
tpurchase
cost
setprice
status
buyprice sellprice
sellmode
holdtime
priceinfo indebted
sell2other meetq
bargain
storage
Padang; Pasaman is remote from Padang; and 50 Kota is located between these two spatial
extremes. The aim of involving three different locations is to capture the effect of the
proximity to market on farm-gate price.
Participatory impact pathway analysis workshops were conducted in the three municipalities
at the initial stage of the study, which allowed a cause-and-effect model drawn as the basis for
structural equation modelling (SEM) in this study. Information related to variables in that
model was then gathered by interviewing a random sample of 100 heads of farm households
and 36 marketing intermediaries using a structured questionnaire. Respondents considered as
buyers in this analysis are marketing intermediaries who buy cacao beans from farmers. They
consist of village buyers and wholesalers.
The description of the variables in the cacao marketing model from farmers’ perspective and
buyers’ perspective are presented in Table 1 and Table 2, respectively.
Table 1. Description of Variables in Cacao Marketing Model from the Farmers’ Perspective
Variable Description
farmprice Price of cacao beans received by farmers (Rupiah / kg)
sellmode Mode of selling (1 = picked up; 2 = delivered)
output Total output sold by farmers (kilograms)
meetq The quality of cacao beans sold meets the buyer’s requirement (1 = no ; 2 = yes)
qinfo Source of information on cacao beans’ quality (1 = the main buyer; 0 = otherwise)
distance Distance of farmers’ location to export point (kilometres)
mainbuyer Main buyer (1 = village buyer; 2 = wholesaler)
priceinfo Source of price information (1 = the main buyer; 0 = otherwise)
indebted Indebted to main buyer (1 = no ; 2 = yes)
farmbargain Ability of farmers to bargain on price of cacao beans (1 = no ; 2 = yes)
sell2other Ability of farmers to sell their cacao beans to buyers other than main buyers (1 = no ; 2 = yes)
nbuyers Number of buyers in the village (people)
lowq The quality of cacao beans is low (1 = strongly disagree; 2 = disagree; 3 = agree; 4 = strongly agree)
A cacao marketing model was estimated using SEM. This approach supports the formulation
of complex models that involve numerous variables, which is its most important feature
(Mulaik, 2009). As the cacao marketing model involves only observed variables, this study
used a special type of SEM called ‘path analysis‘.
been widely used in social sciences since the work of Duncan (1966). The construction of
linear recursive models using path analysis and multiple regression analysis has become
widely recognized as a useful approach to quantifying and interpreting causal theory in
sociology (Alwin and Hauser, 1975).
Table 2. Description of Variables in the Cacao Marketing Model from the Buyers’
Perspective
Variable Description
buyprice The price paid by marketing intermediaries to farmers (Rupiah / kg)
setprice Ability of marketing intermediaries to set buying price (1 = no ; 2 = yes)
sellprice The price of cacao beans received by Selling price (Rupiah / kg)
tpurchase Total purchase of cacao beans in one year (tonne)
cost Marketing cost per kilogram of cacao beans (Rupiah / kg)
status The status of marketing intermediaries in trading (1 = independent; 0 = otherwise)
holdtime Time to hold cacao beans before selling (1 = < 1 week; 2 = 1 - 2 weeks; 3 = > 2 weeks)
bargain Ability of marketing intermediaries to bargain on price of cacao beans (1 = no ; 2 = yes)
meetq The quality of cacao beans sold meets the buyer’s requirement (1 = no ; 2 = yes)
sellmode Mode of selling (1 = picked up; 2 = delivered)
priceinfo Source of price information (1 = the main buyer; 0 = otherwise) indebted Indebted to the main buyer (1 = no ; 2 = yes)
sell2other Ability of marketing intermediaries to sell their cacao beans to buyers other than main buyers (1 = no ; 2 = yes)
storage Have storage facilities (1 = no ; 2 = yes)
qinfo Source of information on cacao beans’ quality (1 = the main buyer; 0 = otherwise)
This method does not only estimate the direct effect of exogenous variables on endogenous
variables; it also estimates indirect effects of exogenous variables in the model while
incorporating the intervening variables (Hunn and Heath, 2011). This method works based on
a priori knowledge that is constructed with assumption of linear relationship among variables
(Iriondo, Albert, and Escudero, 2003; Kingsolver and Schemske, 1991).
Path analysis uses correlation coefficients and regression analysis to model more complex
relationships among observed variables (Schumacker and Lomax, 2004). The use of path
analysis improves the rationale of conventional regression calculations (Duncan, 1966). It is a
useful tool to analyse observational data sets in ecology, evaluation (Mitchell, 1992) and in
sociological problems involving the decomposition of a dependent variable (Duncan, 1966).
This modelling approach is also known as causal modelling which is often drawn in the form
of path diagrams with the advantage of a visual presentation of a complex argument (Biddle
and Marlin, 1987; Li, 1975).
p.10) defined SEM as “the use of two or more structural equations to model multivariate
relationships”. Poon (2007) suggested SEM as an approach that can be used to verify
substantive theories that is also applicable to estimate a model that involves various types of
data. Many analysts have referred to SEM as a mathematical tool for drawing causal
conclusions from a combination of observational data and theoretical assumptions (Pearl,
2011). Barrett (2007) referred to SEM as a modelling tool that fits models to data. Model
testing is an important requirement to determine the fit of a model to data when using SEM.
There are several sociological applications of pat analysis. Pajares and Miller (1994) used
path analysis to test the predictive and meditational role of self-efficacy beliefs in
mathematical problem solving. They stated that path analysis is appropriate in an
investigation when social cognitive theory and previous findings have strong theoretical and
empirical support for the hypothesized relationships. Hunn and Heath (2011) used path
analysis to assess causal relationship between life circumstances and depression, and their
sequent effect on employment and welfare use. They found that economic hardships and
adverse life events have direct effects on depression. The depression reduces earnings and
increases welfare use. Economic hardships and adverse life events reinforce the effect of
depression, as mediator variable, on employment and welfare use. Another application of path
analysis was used in the work of Lee, Weaver, and Hrostowski (2011) to test a conceptual
model of the effect of work environment and psychological empowerment on worker
outcomes in public child welfare. The application of path analysis has extended to deal with
poverty issues. Arsyad and Kawamura (2009) used this method to assess their poverty causal
model of cocoa smallholders in Indonesia. Said and Sallatu (2004) used it to examine
structural causal model for poverty incidence.
The application of path analysis involves five steps: model specification, model estimation,
model testing, model modification and model interpretation. These steps, according to Kline
(2011), are iterative because it may require a return to an earlier step if there is a problem at a
later step. Model specification is the critical step where a model is constructed based on
knowledge by sequentially ordering the variables in a linear causal model that determines
how a variable relates to another and whether the variables are endogenous or exogenous. The
application of path analysis for cacao marketing follows these steps.
Statistical analysis of the structural equation models for cacao marketing was performed using
Stata Version 12. This is the latest version of Stata software that includes structural equation
models. The Stata program includes graphical user interface (GUI) tool that allow us to
construct a diagram for a complex model. We found this tool to be able to perform easier
estimation procedures than using command.
The strength of relationships between two factors in the model
is indicated by the path (β)
coefficients with 95 per cent confidence intervals or at 5 % level of significant. A satisfactory
model usually has a high comparative fit index (CFI) and Tucker-Lewis index (TLI)
Results
Path analysis of cacao marketing from the farmers’ perspective
The estimation results of the model using Stata 12 show that the coefficients of most variables
in the initial model had expected signs. Path coefficients from farmbargain and output to
farmprice had an unexpected sign. The level of multicollinearity of the model was measured
using variation inflation factor (VIF). A model is considered to have high multicollinearity
when value of VIF greater than 10 (El-Dereny and Rashwan, 2011) or correlation among the
exogenous variables greater than 0.9 (Grewal, Cote, and Baumgartner, 2004). Stata results
show that VIF values for all variables in the model are below 3. It indicates that
multicollinearity is not a problem in the model.
Among the ten variables presumed to affect farm price, only three variables (meetq,
mainbuyer, and distance) had a significant relationship with farm price. While all predictor
variables of meetq and sell2other were significant, farmbargain did not have any significant
variables. Nine paths of insignificant variables were considered to be removed from the
model. However, before revising the initial model, it needed to be assessed whether it fits the
data.
The model fit test for the initial model using CFI, TLI and RMSEA indicated that the model
was a poor fit. The values of CFI (0.801) and TLI (0.679) for the model were lower than 0.90
and the value of the RMSEA was 0.098. In order to improve the goodness of fit, the initial
model needed to be respecified by building or trimming the model.
Modification of the initial model began with a Modification Indices test. This test suggested
seven additional paths to improve the model fit. However, some of them do not make sense
from a theoretical perspective. Therefore, only three paths were added in the initial model.
The additional paths are from qinfo to farmbargain, from distance to meetq and from distance
to sell2other.
The resulting model had a better fit to the data than the initial model. Its CFI and TLI values
increased to 0.908 and 0.831, respectively. The value of the RMSEA was 0.071. The model
was categorised as a good fit according to CFI and as a reasonable fit based on TLI and
RMSEA. However, the upper bound of the RMSEA was still high (0.117) meaning that the
poor-fit hypothesis was not rejected. Therefore, another round of modification was
undertaken.
The variable sellmode and priceinfo were removed from the model because they did not have
significant correlation to any variable in the model. Even though lowq and output were not
significantly related to any variable, they remained in the model because removing them
resulted in worse model fit. The insignificant path from indebted to farmprice was also
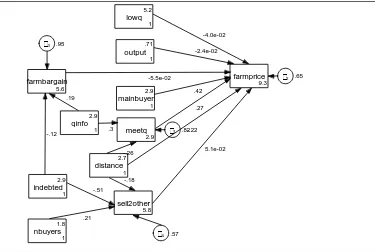
removed. This second modification generated the final model, presented in Figure 3, which is
a good fit (CFI = 0.944; TLI = 0.905: RMSEA = 0.058).
Figure 3. Final Model of Cacao Marketing from the Farmers’ Perspective
The estimation results of the final model are presented in Table 3. The final model shows that
farm-gate price is significantly influenced by variables meetq, mainbuyer and distance, while
the variables farmbargain, sell2other, lowq, and output do not affect it significantly. The
variable meetq has an expected positive and significant effect on the price of cacao beans
received by farmers with a standardized path coefficient of 0.271 and z-value of 3.03. It
implies that if farmers sell cacao beans that meet the quality required by buyers, they receive
a higher price.
An insignificant correlation between farmers’ ability to bargain and the price they receive
indicates that whether or not farmers are able to bargain, the price they receive remains the
same. In other words, farmers who are able to bargain do not receive a higher price than those
who are unable to bargain. This result suggests that farmers have low bargaining power.
The opportunity of farmers to sell their cacao beans to buyers other than the main buyer does
not significantly affect the pric
e they receive (β
= 0.051, z = 0.57). It means that farmers do
not believe that the price at the farm gate can increase even though they are free to sell their
cacao beans to their preferred buyer.
The relationship between the main buyer and the farm-gate price is significant with a path
coefficient of 0.422 and z value of 5.34. The positive coefficient means that if farmers are
correct in their perception, they receive a higher price when they sell cacao beans to
wholesalers than when they sell them to village buyers. The survey results found that 24 per
cent of farmers sold cacao beans to wholesalers at an average price of Rp.22,250 per
kilogram, while 76 per cent of them sold cacao beans to village buyers at an average price of
Rp.19,901 per kilogram.
The negative sign of the coefficient between quality of cacao beans and farm-gate price is
insignificant. This result indicates that farmers believe that the quality of cacao beans does not
mainbuyer 1 2.9 lowq 1 5.2 output 1 .71 meetq 2.9 1 .82 qinfo 1 2.9 distance 1 2.7 farmprice 9.3 2 .65 farmbargain 5.6
3 .95
sell2other
5.8
4 .57
farm-gate price significantly. It indicates that whatever the quantity sold by farmers, they
received the same price.
Table 3. Maximum Likelihood Estimation of Final Model of Cacao Marketing from the
Farmers’ Perspective
Endogenous
variable
Exogenous
variable
Standardized path
coefficient (
β)
z-value
farmprice
meetq
farmbargain
sell2other
mainbuyer
lowq
output
distance
constant
0.271*
-0.055
0.051
0.422*
-0.040
-0.024
-0.217*
9.265*
3.03
-0.67
0.57
5.34
-0.47
-0.28
-2.47
8.82
meetq
qinfo
distance
constant
0.299*
-0.258*
2.895*
3.49
-2.96
6.38
farmbargain
qinfo
indebted
constant
0.189*
-0.122
5.603*
1.98
-1.25
9.74
sell2other
distance
nbuyers
indebted
constant
-0.181*
0.207*
-0.514*
5.841*
-2.19
2.56
-8.09
14.10
*significant at α = 0.05 using a two
-tail test.
The effect of distance from export point on the price at the farm gate is significant with the
expected negative sign of
the path coefficient (β =
-0.217, z = -2.47). It means that farmers
estimate that the farther their location from the export point, the lower the price they receive.
This figure implies a price deduction for the extra transport costs.
Distance from export point (distance) also has a negative and significant effect on farmers’
perceived ability to meet required quality. It indicates that buyers require better quality for
cacao beans coming from a farther location in order to maintain the average quality of cacao
beans at the export point.
Farmers are confident that they can meet the quality of cacao beans required by the main
buyer when they obtain the information on the quality from this person. This correlation is
supported by the estimation results in which qinfo has a significant effect on meetq with a
path coefficient of 0.299 and z-value of 3.49. Obtaining information on the quality of cacao
beans from the main buyer enables farmers to have bargaining power.
other than the main buyer, which is indicated by the estimation result with a path coefficient
of -0.514 and z-value of -8.09. If farmers’ perceptions are correct, it means that if they borrow
money from the main buyer, they have to sell their cacao beans to this buyer.
Farmers believe that the number of buyers operating in a farmer’s location is another variable
that significantly affects the ability of farmers to sell their cacao beans to buyers other than
the main buyer (β = 0.207, z = 2.56
). The positive coefficient between nbuyers and sell2other
suggests that the more buyers are operating in a farmer’s location, the more chance farmers
have to sell their cacao beans to buyers other than main buyer.
Path Analysis of Cacao Marketing from the Buyers’ Perspective
The results of the estimation for the initial model cacao marketing from the buyers’
perspective reveal that seven exogenous variables did not have a significant relationship with
any variables in the model. They include tpurchase, cost, bargain, meetq, sellmode,
sell2other and qinfo. These variables were considered to be removed from the model. Most
exogenous variables had expected signs while some (setprice, meetq, sell2other and qinfo)
did not hold expected signs. Multicollineraity test shows that all VIF values were less than 2,
well below the maximum acceptable cut-off value of 10. It indicates a lack of evidence of
multicollinearity.
Based on the model fit test, the initial model had a poor fit. Its values of CFI (0.503) and TLI
(0.328) were much lower than 0.90 and the value of RMSEA was very high (0.174). The test
suggested model respecification to improve the goodness of fit. Maximum likelihood
estimation indicates some insignificant variables that can be removed to improve the model
fit. However, before removing these variables, the modification indices test was applied. In
this way, there was a chance that insignificant variables able to improve the model fit by
building paths remained in the model. Of the six paths suggested by the modification indices
test to improve model fit, some did not make sense from a theoretical perspective. Therefore,
only three paths were added to the initial model. The additional paths were from indebted to
setprice, from tpurchase to holdtime, and from status to bargain.
The modification indices test showed that the path from indebted to setprice had the largest
change in the observed
χ
2value (12.250). If this path were added to the initial model, it would
generate a large improvement. In addition, it had the highest standardized EPC. The two other
additional paths also had a large modification index (> 5) with high standardized EPC (>
0.30). The first modification of the model had a better fit to the data with CFI and TLI values
increased to 0.715 and 0.590, respectively. The value of RMSEA decreased to 0.136.
However, the model was still in the poor fit category according to the three model-fit tests.
Therefore, further revision of the model is required.
Figure 4. Final Model of Cacao Marketing from the Buyers’ Perspective
The final model was much better than previous two models. It was a good fit with CFI
(0.997), TLI (0.996) close to 1 and its RMSEA (0.012) lower than 0.05. For these reasons, the
final model is used for further analysis.
The estimation results from the final cacao marketing model from the buyers’ perspective are
presented in Table 4. Most variables are significant with expected signs. Among the four
predictor variables of buyprice, only variable sellprice has significant effect on buyprice with
coefficient of 0.664 (z = 5.97). This finding supports the hypothesis that intermediaries who
received a higher selling price from their buyers they were likely to increase the price they
paid to farmers.
The final model shows that, according to the buyers, indebtedness significantly affected the
ability of marketing intermediar
ies to set the price (β =
-0.625, z = -6.85). The negative path
coefficient for this relationship means that marketing intermediaries were not able to set the
buying price if they borrowed money from the main buyer. However, this condition does not
reflect on buying price, which is proved by the insignificant correlation between ability to set
the price and buying price.
Buyers believe that the variable tpurchase does not significantly influence buyprice. If they
are correct, this result indicates that large-scale buyers do not set higher buying prices than
small buyers. However, large-scale buyers can hold cacao beans for a longer time when there
is no promising selling price. This condition is proved by the significant relationship between
tpurchase and holdtime
(β = 0.362, z = 2.63
) and its subsequent effect on sellprice
(β = 0.321
z = 2.63). Marketing intermediaries consider that their ability to hold cacao beans for a longer
time is significantly influenced by the storage facilities they have
(β = 0.333, z = 2.39
). The
tpurchase 1 .52 cost 1 3 setprice 8.1
1 .61
status
1
8.5 buyprice
4.6
2 .41
sellprice
18
3 .53
holdtime
1.3
4 .66
priceinfo 1 4.3 indebted 1 3.3 sell2other 1 2.8 meetq 12
5 .98
bargain
4.5
6 .78
negative path coefficient between cost and buyprice suggests that the higher the marketing
cost the lower the buying price, but this relationship is not statistically significant.
Table 4. Maximum Likelihood Estimation of the Final Model for Cacao Marketing from the
Buyers’ Perspective
Endogenous
variable
Exogenous
variable
Standardized path
coefficient (
β)
z-value
buyprice
setprice
sellprice
tpurchase
cost
constant
-0.009
0.664*
0.212
-0.184
4.567*
-0.07
5.97
1.57
-1.63
1.60
setprice
indebted
constant
-0.625*
8.068*
-6.85
12.68
sellprice
holdtime
bargain
meetq
priceinfo
indebted
sell2other
constant
0.321*
0.093
0.158
-0.289*
-0.277*
-0.246
18.492*
2.63
0.73
1.25
-2.44
-2.28
-1.89
6.25
holdtime
tpurchase
storage
constant
0.362*
0.333*
1.335*
2.63
2.39
2.55
bargain
status
constant
0.471*
4.494*
3.85
2.77
meetq
qinfo
constant
-0.135
12.447*
-0.83
8.44
*significant at α = 0.05 using a
two-tail test.
Path coefficients from bargain and meetq to sellprice are positive. They indicate that the
ability to bargain and meet required quality enable marketing intermediaries to receive a
higher price. Nevertheless, those exogenous variables do not significantly affect the selling
price. Moreover, the effect of an intermediary’s ability to sell to other buyers on selling price
does not have the expected sign. Their relationship is also not significant.
Marketing intermediaries believe that their status significantly affects their ability to bargain,
with a path coefficient of 0.471 and z-value of 3.85. This figure indicates that independent
marketing intermediaries have more ability to bargain than those who act as the buying agents
of wholesalers or exporters.
The source of quality information was presumed to influence the ability of a marketing
intermediary to meet quality of cacao beans required by firms that buy from this intermediary,
but it proved not to be the case on the basis of the statistical test. It means that even though
quality information was obtained from the main buyer, it will not necessarily guarantee that
the quality of cacao beans meets the quality required by that main buyer.
Decomposition of effects of predictor variables on the farm-gate price
As the model involves intervening variables, the effects need to be decomposed into direct
and indirect effects. The decomposition method provides information about the effect of a
variable on another through intervening variable. The estimation results for the decomposition
of effects are presented in standardized values in order to allow comparison of the effects
among variables in the model. To identify the more important effects in the model, this study
follows the criterion by Burridge and Schwabe (1977) in which a direct or indirect effect of at
least
±
0.30 standard units is considered a major causal effect in the model. The standardized
estimates of the effects of predictor variables on farm-gate price form farmers’ perspective are
presented in Table 5.
Most variables in the model influence the farm-gate price directly, while three variables affect
it indirectly and only one variable has a direct and indirect effect. Among the predictor
variables, main buyer has the highest standardized total effect (0.422) on farm-gate price and
contributes a strong effect in the model, followed by distance (-0.296), and meetq (0.270).
Table 5. The Effects of Predictor Variables on the Farm-Gate Price
Endogenous
variable
Exogenous
variable
Standardized
direct effect
Standardized
indirect
effect
Standardized
total effect
z-value
farmprice
meetq
farmbargain
sell2other
mainbuyer
lowq
output
qinfo
distance
nbuyers
indebted
0.270
-0.055
0.051
0.422
-0.040
-0.024
-
-0.217
-
-
-
-
-
-
-
0.071
-0.079
0.011
-0.020
0.270*
-0.055
0.051
0.422*
-0.040
-0.024
0.071
-0.296*
0.011
-0.020
3.04
-0.67
0.57
4.85
-0.47
-0.28
1.79
-3.39
0.56
-0.42
The total effects of meetq and mainbuyer on farm-gate price are due to the direct casual
effect, while the total effect of distance on farm-gate price is constructed by direct and
indirect effects. About 24 per cent (= -0.07 / -0.296) of the total effect of distance on
farmprice is transmitted via meet, 3 per cent (-0.009 / -0.296) is mediated by sell2other and
73 per cent (-0.217 / -0.296) is unmediated by variables in the model. The indirect effect of
distance on farmprice is constructed by the direct effect of distance on meetq and its
effect of meetq on farmprice is 0.270. Thus, the indirect effect of distance on farmprice can
be computed as -0.258 x 0.270= -0.07. In the same way, indirect effect of distance on
farmprice via sell2other is -0.181 x 0.051 = -0.009.
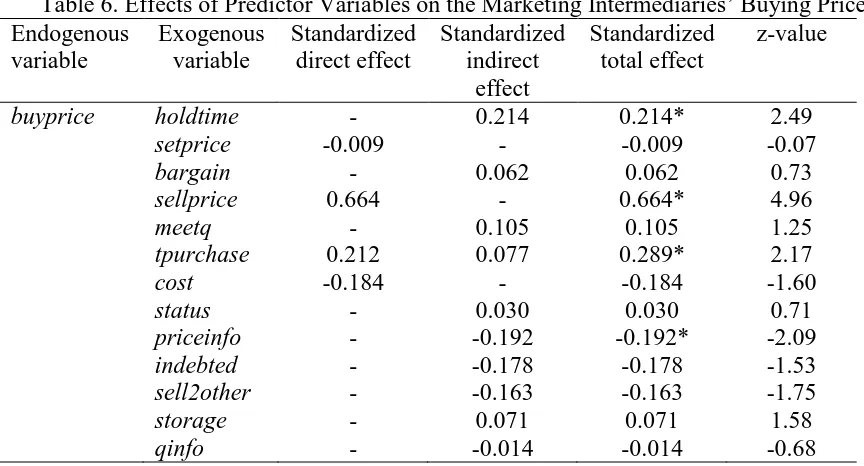
From buyers’ perspective, among 13 variables presumed to affect marketing intermediaries’
buying price, three variables have a direct effect, nine variables have an indirect effect, and
one variable has both effects. The standardized estimates of the effects of predictor variables
on buying price are presented in Table 6.
Table 6. Effects of Predictor Variables on the Marketing Intermediaries’ Buying Price
Endogenous
variable
Exogenous
variable
Standardized
direct effect
Standardized
indirect
effect
Standardized
total effect
z-value
buyprice
holdtime
setprice
bargain
sellprice
meetq
tpurchase
cost
status
priceinfo
indebted
sell2other
storage
qinfo
-
-0.009
-
0.664
-
0.212
-0.184
-
-
-
-
-
-
0.214
-
0.062
-
0.105
0.077
-
0.030
-0.192
-0.178
-0.163
0.071
-0.014
0.214*
-0.009
0.062
0.664*
0.105
0.289*
-0.184
0.030
-0.192*
-0.178
-0.163
0.071
-0.014
2.49
-0.07
0.73
4.96
1.25
2.17
-1.60
0.71
-2.09
-1.53
-1.75
1.58
-0.68
Among significant exogenous variables in the model, the variable sellprice has the highest
total effect (0.664) on buyprice, followed by tpurchase (0.289), holdtime (0.214), and
priceinfo (-0.192). The total effects of sellprice is due solely to the direct causal effect. The
total effects of holdtime and priceinfo are mediated by sellprice.
The effect of total purchase on buying price involves two pathways. The first pathway is via
holdtime and its subsequent effect on sellprice and buyprice, while the second pathway is a
direct effect. The direct effects of tpurchase on holdtime and holdtime on sellprice are 0.362
and 0.321, respectively. Thus, the effect of total purchase on buying price through the first
pathway is 0.077 (= 0.362 x 0.321 x 0.664).
The effect of total purchase on buying price is extension pathway from the effect of holdtime
on buying price. The total effect of holdtime on buying price (0.214) via sellprice is formed
by 0.321 x 0.664.
The effect of priceinfo on buying price is transmitted by selling price. As the direct effect of
priceinfo on selling price is -0.289, its total effect buying price via selling price is constructed
by -0.289 x 0.664 = -0.192.
Discussion
of cacao beans received by farmers and factors that are thought to be affecting it. Findings
reveal that smallholder farmers perceived themselves to have low power in marketing
transactions. They could not get force the price higher even though they perceived to be able
to bargain on the price, be able to sell their cacao beans to buyers other than main buyer, and
deliver cacao beans to the buyer’s place thereby fulfilling one of the marketing functions.
Moreover, the distance of farmers’ location to export point also causes farmers to receive a
lower price.
Lack of capital, which is partly a function of lack of access to credit, causes the main buyer to
become the chief source of credit for smallholders to fund their farming activities. This
indebtedness restricts the ability of cacao farmers to sell their cacao beans to buyers other
than the main buyer. Vigneri and Santos (2007) found similar conditions in cacao marketing
in Ghana, where the availability of cash as a loan was the most important reason to sell to a
specific buyer. These findings are similar to a study of cacao marketing in Ecuador by Jano
and Mainville (2007) where, as mentioned above, intermediaries have market power that
enables them to extract rents from farmers. Farmers’ dependency on intermediaries for credit
to fund crop production activities forces them to sell their cacao to the same intermediaries
who provided the loan. It causes farmers to have less bargaining power than those farmers
who do not have any such commitment.
This study found that there is an opportunity for farmers to receive higher price through
selling cacao beans of the quality required by the main buyer and selling them to wholesalers.
Obtaining information on the quality from the main buyer enabled farmers to meet the
required quality. Jano and Mainville (2007) found that cacao farmers faced lack of
information on quality standards. Because they did not know exactly the quality of their cacao
beans, they were unable to negotiate the price. This situation also exists in cacao marketing in
West Sumatra. Farmers do not fully understand what the characteristics of good-quality cacao
beans. About 40 per cent of farmers relied on the main buyer to obtain information on quality
standards and 22 per cent farmers did not get any information on cacao beans’ quality. No
grading system at the farmers’ level may contribute to this lack of quality information.
From the buyers’ perspective, the selling price of marketing intermediaries was the only
factor significantly affecting their buying price. The study results indicate that marketing
intermediaries increased the price they paid to farmers if they received a higher price for their
cacao beans. Three significant factors influencing the price received by marketing
intermediaries are the length of time holding cacao beans, source of price information and
indebtedness.
businesses with rapid turnover. They sold their cacao beans to wholesalers. Their condition
influenced the way they set up their buying price that, in turn, affected the price received by
farmers.
From the discussion above, there are several policy implications in order to improve
marketing conditions in the West Sumatra cacao industry. The recommendations relate to
better infrastructure, quality information, selling practices and access to credit.
Although estimation results show that farmers perceived that the quality of cacao beans did
not influence the price they received, ‘meet the required quality’ as a proxy for assessment on
quality of cacao beans sold is one of determinants of price received by farmers. To capture
higher price, farmers should obtain information on quality required by buyers, because quality
information is a significant indirect determinant of farm-gate price.
This study confirms the expectation that farmers located far away from the export point
received a lower price due to high transfer costs. A better road infrastructure may reduce
transfer costs that in turn lead to an increase in the price received by farmers.
As selling cacao beans to wholesalers rather than to village buyers provide a chance for
farmers to get higher price, farmers should exploit this opportunity. However, most farmers
sell their cacao beans in small amounts, which restrict their ability to sell them to wholesalers
who are usually located in the capital city of the municipality. Selling small amount of cacao
beans in the capital city can incur a high transportation cost. Establishing farmer cooperatives
is one solution for this issue because it allows farmers to sell cacao beans in large amounts.
Provision of credit for farmers may also be a means of improving cacao marketing as most
farmers lack capital. Obtaining a loan from the main buyer limits their opportunity to sell
cacao beans to other buyers. This places them in a disadvantageous bargaining position and is
a lost opportunity to get a better price offered by other buyers. The loan from buyers is often
considered as an advance payment. From the farmers’ point of view, the buyers (who are also
money lenders) provide credit, which suits the farmers even though they are perceived as an
obstacle to the improvement of cocoa quality and prices (ACDI/VOCA 2005).
Well-functioning markets are important in generating growth and expanding opportunities for poor
people (UNDP, 2002). Therefore, farmers’ income can increase only with the combination of
new technology and improved markets (Abdoulaye and Sanders, 2006).
References
Abbott, P.C., M.D. Wilcox, and W.A. Muir. (2005). Corporate social responsibility in
international cocoa trade. Paper presented at the The 15th Annual World Food and
Agribusiness Forum, Symposium and Case Conference, Chicago, Illinois.
Abdoulaye, T., and J.H. Sanders. (2006). New technologies, marketing strategies and public
policy for traditional food crops: Millet in niger. Agricultural Systems, 90(1-3),
272-292.
ACDI/VOCA. (2005). Sustainable cocoa enterprise solutions for smallholders (success):
Alliance – indonesia. Washington DC: Office of Economic Growth USAID.
Akiyama, T., and A. Nishio. (1997). Sulawesi's cocoa boom: Lessons of smallholder
Alene, A.D., V.M. Manyong, G. Omanya, H.D. Mignouna, M. Bokanga, and G. Odhiambo.
(2008). Smallholder market participation under transactions costs: Maize supply and
fertilizer demand in kenya. Food Policy, 33(4), 318-328.
Alwang, J., and E.G. Marió. (2008). Poverty and social impact in the agricultural sector:
Lessons from experience. Development Policy Review, 26(2), 189-210.
Alwin, D.F., and R.M. Hauser. (1975). The decomposition of effects in path analysis.
American Sociological Review, 40(1), 37-47.
Arsyad, M. (2010). Reducing poverty of cocoa smallholders in desa compong and desa
maddenra in indonesia. Paper presented at the 4th Asian Rural Sociology Association
(ARSA) International Conference, Legazpi, Philippines.
Arsyad, M., and Y. Kawamura. (2009). A poverty causal model of cocoa smallholders in
indonesia: Some initial findings from south sulawesi. Ryukoku Journal of Economic
Studies, 49(2), 1 - 27.
Asmelia. (2007). Marketing analysis of cacao in sikucur, padang pariaman, west sumatra.
Andalas University, Padang.
Badcock, S., B. Matlick, and J.B. Baon. (2007). A value chain assessment of the cocoa sector
in indonesia. Jakarta: AMARTA-USAID.
Barrett, P. (2007). Structural equation modelling: Adjudging model fit. Personality and
Individual Differences 42, 815-824.
Biddle, B.J., and M.M. Marlin. (1987). Causality, confirmation, credulity, and structural
equation modeling. Child Development, 58(1), 4 - 17.
Burridge, M.J., and C.W. Schwabe. (1977). Path analysis: Application in an epidemiological
study of echinococcosis in new zealand. Journal of Hygiene, 78(135), 135 - 149.
Directorate General of Plantations of Indonesia. (2012). Export and import in indonesia:
Commodity cocoa 1969 - 2009. Jakarta: Directorate General of Plantations of
Indonesia.
Duncan, O.D. (1966). Path analysis: Sociological examples The American Journal of
Sociology, 72(1 - 16).
El-Dereny, M., and N.I. Rashwan. (2011). Solving multicollinearity problem sing ridge
regression models. International Journal of Contemporary Mathematical Sciences
(IJCMS), 6(12), 585 - 600.
Grace, J.B. (2006). Structural equation modeling and natural systems. Cambridge:
Cambridge University Press.
Grewal, R., J.A. Cote, and H. Baumgartner. (2004). Multicollinearity and measurement error
in structural equation models: Implications for theory testing. Marketing Science,
23(4), 519 - 529. doi: 10.1287/mksc.1040.0070
Handayane. (2007). Analisa finansial usahatani kakao dan permasalahannya di kota padang
(financial analysis of cacao farm and its constraints in padang). (Thesis), Universitas
Anadalas (Andalas University), Padang.
Hunn, V., and C.J. Heath. (2011). Path analysis of welfare use: Depression as a mediating
factor. Journal of Family and Economic Issues, 32, 341 - 355.
Iriondo, J.M., M.J. Albert, and A. Escudero. (2003). Structural equation modelling: An
alternative for assessing causal relationships in threatened plant populations.
Biological Conservation, 113(3), 367-377.
Jano, P., and D. Mainville. (2007). The cacao marketing chain in ecuador: Analysis of chain
constraints to the development of markets for high-quality cacao Agricultural &
Applied Economics Virginia Tech (0401).
Kline, R.B. (2011). Principle and practice of structural equation modeling (3rd ed.). New
York: The Guilford Press.
Lee, J., C. Weaver, and S. Hrostowski. (2011). Psychological empowerment and child welfare
worker outcomes: A path analysis. Child Youth Care Forum, 40, 479 - 497.
Li, C.C. (1975). Path analysis - a primer. Pacific Grove, California: the Boxwood Press.
Mitchell, R.J. (1992). Testing evolutionary and ecological hypotheses using path analysis and
structural equation modelling. Functional Ecology, 6(2), 123 - 129.
Mulaik, S.A. (2009). Linear causal modeling with structural equations. Boca Raton:
Chapman and Hall/CRC.
Norton, G.W., J. Alwang, and W.A. Masters. (2010). Economics of agricultural development:
World food systems and resource use (2nd ed.). Milton Park, Oxon: Routledge.
Pajares, F., and M.D. Miller. (1994). Role of self-efficacy and self-concept beliefs in
mathematical problem solving: A path analysis. Journal of Educational Psychology,
86(2), 193-203. doi: 10.1037/0022-0663.86.2.193
Panlibuton, H., and M. Meyer. (2004). Value chain assessment: Indonesia cocoa Microreport
2: ACDI/VOCA - USAID.
Pearl, J. (2011). The causal foundations of structural equation modeling (Department, C. S.,
Trans.). Los Angeles: University of California, Los Angeles.
Pokhrel, D.M., and G.B. Thapa. (2007). Are marketing intermediaries exploiting mountain
farmers in nepal? A study based on market price, marketing margin and income
distribution analyses. Agricultural Systems, 94(2), 151-164.
Poon, W.Y. (2007). The analysis of structural equation model with ranking data using mx. In
Lee, S. Y. (Ed.), Handbook of latent variable and related models (pp. 189-208).
Amsterdam: North-Holland, Elsevier.
Sahara, D., Z. Abidin, and Dahya. (2005). Farmers' income on superior commodity in south
east sulawesi: Engineering Agriculture Study Centre of South East Sulawesi.
Said, A., and A.M. Sallatu. (2004). Incidence of poverty structural causal model for sulawesi
region, indonesia: A path analysis based on statistics "potensi desa". Ryukoku Journal
of Economic Studies, 44(1), 27 - 49.
Schumacker, R.E., and R.G. Lomax. (2004). A beginner's guide to structural equation
modelling (2nd ed ed.). Marwah, New Jersey: Lawrence Erlbaum Associates.
Tomek, W.G., and K.L. Robinson. (2003). Agricultural product prices (4th ed.). Ithaca, USA:
Cornell University Press.
UNDP. (2002). Local governance for poverty reduction in africa AGF-V Concept Paper.
Maputo, Mozambique: United Nations Development Programme (UNDP) and United
Nations Economic Commission for Africa (ECA).
Vigneri, M., and P. Santos. (2007). Ghana and the cocoa marketing dilemma: What has
liberalisation without price competition achieved? ODI Project Briefing, 3.
Wolfle, L.M. (1980). Strategies of path analysis. American Educational Research Journal,
17(2), 183-209.
The Australian Agricultural and
Resource Economics Society Inc.
www.aares.org.au
57
th
Annual Conference
The Sydney Convention and Exhibition Centre,
Darling Harbour, Sydney NSW
5-8 February 2013
CONFERENCE SPONSORS
AARES thanks the following sponsors for their support of the Conference:
Premier Sponsors:
Principal Sponsors:
Crawford School of Public Policy
Department of Agricultural and Resource Economics
School of Agricultural and Resource Economics
CONTENTS
ITEM PAGE
Welcome 4
AARES and Local Organising Committee 5
General information 6
Location map 9
The Sydney Convention and Exhibition Centre map 10
Pre-conference workshop descriptions 12
Conference program 16
Social program 21
Invited speaker biographies 23
Invited speaker abstracts 30
Mini-symposium session 1 descriptions 37
Mini-symposium session 2 descriptions 40
Contributed papers – abstracts 42
Poster presentations – abstracts 45
WELCOME
It is my pleasure, on behalf of the Local Organising Committee, to welcome fellow delegates to the 57th annual conference of the Australian Agricultural and Resource Economics Society. We have selected the Sydney Convention Centre at Darling Harbour as the conference venue for its excellent facilities and ideal location. We are confident that you will find the services match the very high standards set by previous AARES conferences.
The AARES President-Elect, Peter Warr, has assembled an outstanding list of invited speakers on the
o pelli g the es of Aust alia s ole i the Asia Ce tu ; li ate ha ge, glo al food se u it , a d
poverty; food, nutrition, and health; and herbicide and insecticide resistance. In addition, plenary sessions will feature AARES President Malcolm Wegener and AAEA President Richard Sexton.
Combined with the two mini-symposia sessions covering themes in environmental economics and policy, efficiency in the water and electricity sectors, freshwater quality, climate change adaptation, biosecurity, and resilience in natural resources systems, we are sure that you will find the program challenging and interesting.
For 2013 there are four pre-conference workshops with themes including climate adaptation decisions on farms, marine biodiversity offsets, impact assessment for international development funding decisions, and agriculture and carbon.
This ea s o fe e e follo s the e e t patte of g adual e olutio i the p og a . A e atego ,
selected (refereed) papers, has been included among the contributed papers, and we continue to raise the profile of contributed posters by reserving the period immediately following afternoon tea on Wednesday for poster presentations.
This ea s o fe e e e ei ed ost el o e suppo t f o ew and continuing sponsors, led by Premier Sponsors ACIAR and Rio Tinto. Sponsorship allows us to present a higher-quality conference while maintaining affordability. As well as our financial sponsors, several organisations provided substantial in-kind support, for example supporting travel and participation expenses for invited speakers and workshop and mini-symposia presenters from their own and in some cases other organisations. We have made every effort to acknowledge organisations that provided substantial in-kind support in the handbook.
The social program has been designed to offer delegates a variety of events in addition to the Welcome Reception and the Conference Dinner. We would particularly encourage early-career professionals to participate in the Young Professionals Event at Zilver in nearby Chinatown, following the Welcome Reception. On Thursday, we have organized a Social and Networking Event at the Australian (Heritage) Hotel, 100 Cumberland St, The Rocks, preceded by an optional walking tour of The Rocks historical district.
E e ea , the LOC akes a ajo o t i utio to the su ess of the AA‘E“ o fe e e. This ea s LOC
members are listed below, followed by acknowledgment of subcommittees and individuals who undertook major areas of responsibility. Please let these loyal AARES members know that you appreciate their service. Thank you for your participation in the conference. We are sure that you will find it both enjoyable and stimulating along with the rest of your visit to Sydney and New South Wales.
Alan Randall
AARES
President: Malcolm Wegener, University of Queensland President Elect: Peter Warr, Australian National University Past President: John Quiggin, University of Queensland Secretary: Bob Farquharson, University of Melbourne Treasurer: Terrence Farrell, Charolais Society of Australia Promotion and Development: Bronwyn Crowe
Central Office: Annie Hurst, AARES Office Manager Media Liaison: Cathy Reade, Crawford Fund
LOCAL ORGANISING COMMITTEE
Alan Randall, Chair University of Sydney Tihomir Ancev University of Sydney Matt Arthur NSW E&H
Jason Crean NSW DPI
David Godden University of Sydney, Charles Sturt University Michael Harris DAFF
Gordon MacAulay GrainGrowers John Madden Arche Consulting
Rod McInnes Sydney Catchment Authority
Emily Ray GHD
Todd Sanderson University of Sydney Facilities: Tiho Ancev
Sponsorship and promotion: Rod McInnes, Michael Harris, John Madden, Bronwyn Crowe (ex
officio) (ex officio)
Selected and contributed papers
and posters: Gordon MacAulay, David Godden, Todd Sanderson Sanderson Pre-conference workshops and
mini-symposia: Alan Randall
Social events: Emily Ray, Mathew Arthur, Todd Sanderson Sommelier: Jason Crean
THE ASSOCIATION SPECIALISTS
Daniel Evans Event Manager
REGISTRATION DESK CONTACTS
Daniel Evans E: [email protected]
GENERAL INFORMATION
GENE‘AL INFO‘MATION
CAR PARKING
The Sydney Convention and Exhibition Centre parking is located off Darling Drive, underneath the
Ce t e s fi e e hi itio halls, i Da li g Ha ou . The a pa k p o ides di e t a ess to the Ce t e a d
the Darling Harbour precinct. The car park is open 24 hours, Monday to Sunday. Please visit
http://www.scec.com.au/Visit/Parking/ to view current rates.
CATERING
Lunch and morning and afternoon teas will be served in the Parkside Foyer on Level 1 of the Sydney Convention Centre.
CONFERENCE EVALUATION
An electronic evaluation will be distributed post-conference. To assist with the planning of future AARES events, we hope that you will take the time to provide feedback on the Conference.
CONFERENCE PAPERS
Papers from the Conference will be made available on the AgEcon Search website after the event
http://ageconsearch.umn.edu/
DISCLAIMER
The information presented in this handbook is correct at the time of printing. In the event of unforeseen circumstances, the Local Organising Committee reserves the right to delete or alter items in the Conference Program.
DRESS STANDARDS
Conference Sessions – smart casual Social Functions – smart casual
LIABILITY/INSURANCE
In the event of industrial disruptions or natural disasters, Australian Agricultural and Resource Economics Society (AARES), the Local Organising Committee, or any Professional Conference organiser engaged by the Society, cannot accept responsibility for any financial or other losses incurred by the delegates and will take no responsibility for injury or damage to persons or property occurring during the Conference. All insurance, including medical cover, or expenses incurred in the event of the
GENERAL INFORMATION
LOCAL TRANSPORT
The Sydney Convention Centre in Darling Harbour is adjacent to a Metro Light Rail (http://www.metrolightrail.com.au/ “tatio Co e tio ith se i es o e ti g di e tl f o
Sydney Central Train Station.
Alternatively, the Sydney Convention Centre is approximately 15 minutes walking time from both Central Train Station and Town Hall Train Station. George Street, which runs the length of the Sydney CBD, has regular bus services and is also approximately 15 minutes walking time from the Convention Centre. There is a CBD free shuttle bus which runs every 10 minutes on a loop from Central Station to Circular Quay via George and Elizabeth Streets (www.131500.com.au).
Sydney Domestic and International Airports each have train stations with regular services to Sydney Central Station (http://www.airportlink.com.au/index.php).
Taxi companies in Sydney include: Taxis Combined – 13 33 00 Silver Service – 13 31 00
MESSAGES AND NOTICES
Messages for delegates may be left with the staff at the registration desk. A noticeboard will be located near the registration desk. Please check this board for messages and important information.
MOBILE TELEPHONES
As a courtesy to other delegates and speakers, please refrain from using your mobile phone within Conference sessions, and switch it off or to silent.
NAME BADGES AND TICKETS
Name badges will be issued at registration and should be worn at all times. Admission to the Conference and related activities is by name badge only. Tickets for social functions will be issued at registration, please ensure you have a ticket for each function you have booked for.
POSTERS
Posters will be available to view in the Parkside Foyer on Level 1 of the Sydney Convention Centre for the duration of the Conference, and presenting authors should be by their posters during the allocated session and tea break immediately prior. All posters must be collected by 5pm on Friday, 8 February, 2013.
REGISTRATION and INFORMATION DESK
All delegates should collect their registration pack upon arrival to the Conference. The registration desk will be located in the Parkside Foyer on Level 1 of the Sydney Convention Centre, and will be open during the following times:
Tuesday 7 February 2013:
8:00am - 9:00am and 4:00pm - 6:00pm
Wednesday 8 February 2013:
GENERAL INFORMATION
Thursday 9 February 2013:
7:30am - 4:30pm
Friday 10 February 2013:
7:30am - 4:00pm
SECURITY AND EMERGENCIES
Please ensure that you take all items of value with you at all times when leaving a room. Do not leave bags or laptop computers unattended.
In the case of an emergency of any type, contact the Ce tre s Se urity Co trol (9282 5555) or NSW Emergency Services (000).
I the ase he e a e a uatio is e essa , the e a uatio ala Whoop Whoop Whoop is desig ed
to notify all occupants. On hearing the evacuation alarm, all persons should proceed to the nearest emergency exit and make their way to an assembly area:
Assembly Area 1: Between Entertainment Centre and the Novotel Hotel Assembly Area 2: Beneath the road overpass, adjacent to the IMAX Theatre
SPECIAL REQUIREMENTS
If you have advised the Conference Organisers of any special dietary requirements, please identify yourself to the wait staff for assistance.
TIME ZONE
Sydney operates on Eastern Daylight Time, which is GMT plus 11 hours. Sydney does observe daylight savings time.
TOURIST INFORMATION
Tourist information about Sydney and surrounds, including maps and attractions, is available from
http://www.sydney.com and
http://www.cityofsydney.nsw.gov.au/aboutsydney/visitorguidesinformation/default.asp
Please visit the registration desk if you would like further information.
TRADE EXHIBITION
GENERAL INFORMATION
GENERAL INFORMATION
VENUE MAP
–
SYDNEY CONVENTION CENTRE
GENERAL INFORMATION
PRE-CONFERENCE WORKSHOPS
P‘E-CONFE‘ENCE WO‘KSHOPS
PRE-CONFERENCE WORKSHOP 1
ECONOMIC TOOLS FOR ADAPTATION AND TRANSFORMATION TO CLIMATE CHANGE: REAL OPTIONS FOR ADAPTIVE DECISIONS
Convenor: Greg Hertzler, University of Sydney; Todd Sanderson, University of Sydney
Sponsorship:
Speakers: Greg Hertzler, Todd Sanderson, Tim Capon
This workshop is primarily concerned with adaptive capacity, options for adaptation response and
t a sfo atio al ha ge i Aust alia s p i a i dust ies as a espo se to li ate ha ge. In light of projections of a warmer drier future, this workshop will cover the nature of economic decisions which are made at the level of 1) adjusting practices and technologies, 2) changing production systems, or 3) transforming to new areas or industries. Adjustment changes are relatively easy to make but system and transformation changes may be irreversible, or partially irreversible, leaving stranded assets. Making the switch will require investments and infrastructure. As producers in Australia adapt, so will producers in the rest of the world. Adaptations around the o ld ill affe t Aust alia p odu e s, Aust alia s food se u it and international trade. Understanding the future structure of primary industries is relevant to policy makers, researchers and primary producers because each of these changes has implications for the resilience of regional economies and communities.
The workshop will involve both presentations as well as demonstration of practical computer based applications to develop the economic analytical tools for promoting efficient, sustainable adaptation policies. Case studies developed for the workshop will have a specific focus on New South Wales, South Australia and Western Australia.
This workshop aims to develop among participants:
- The capacity and skills in the economic analysis of adaptive and transformational responses to climate change
- The use of transects across space to identify future scenarios for more favourable areas as they become less favourable with climate change
- The use data to model the transformations from current agricultural systems
- The use climate data to assess the trends and increasing variability of crop and pasture production - The use of the economic frameworks to find the thresholds and expected times until an agricultural enterprise switches from one pr