Commodity
Markets
Outlook
Quarterly Report
Q4
Q3
Quarterly Report
APRIL 2017
Commodity
Markets
1818 H Street NW, Washington, DC 20433
Telephone: 202-473-1000; Internet: www.worldbank.org
Some rights reserved
his work is a product of the staf of the World Bank with external contributions. he indings, interpretations, and conclusions expressed in this work do not necessarily relect the views of the World Bank, its Board of Executive Directors, or the governments they represent. he maps were produced by the Map Design Unit of the World Bank. he World Bank does not guarantee the accuracy of the data included in this work. he boundaries, colors, denominations, and other information shown on these maps do not imply, on the part of the World Bank Group, any judgment on the legal status of any territory, or any endorsement or acceptance of such boundaries.
Nothing herein shall constitute or be considered to be a limitation upon or waiver of the privileges and immunities of the World Bank, all of which are speciically reserved.
Rights and Permissions
Attribution—Please cite the work as follows: World Bank Group. 2017. Commodity Markets Outlook, April. World Bank, Washington, DC. License: Creative Commons Attribution CC BY 3.0 IGO
Translations—If you create a translation of this work, please add the following disclaimer along with the attribution: his translation was not created by the World Bank and should not be considered an oicial World Bank translation. he World Bank shall not be liable for any content or error in this translation.
Adaptations—If you create an adaptation of this work, please add the following disclaimer along with the attribution: his is an adaptation of an original work by the World Bank. Views and opinions expressed in the adaptation are the sole responsibility of the author or authors of the adaptation and are not endorsed by the World Bank.
hird-party content—he World Bank does not necessarily own each component of the content contained within the work. he World Bank therefore does not warrant that the use of any third-party-owned individual component or part contained in the work will not infringe on the rights of those third parties. he risk of claims resulting from such infringement rests solely with you. If you wish to re-use a component of the work, it is your responsibility to determine whether permission is needed for that re-use and to obtain permission from the copyright owner. Examples of components can include, but are not limited to, tables, igures, or images.
All queries on rights and licenses should be addressed to the Publishing and Knowledge Division, World Bank, 1818 H Street NW, Washington, DC 20433, USA; fax: 202-522-2625; e-mail: [email protected].
Con
tents
Acknowledgments . . . v
Executive Summary . . . 1
Commodity Market Developments and Outlook . . . 3
Energy . . . 5
Agriculture . . . 9
Fertilizers . . . 13
Metals and minerals . . . 14
Precious metals . . . 16
Appendix A: Historical commodity prices and price forecasts . . . 17
Appendix B: Supply-demand balances . . . 25
Appendix C: Description of price series . . . 57
Figures
1 Commodity price indexes, monthly . . . 12 Commodity price indexes, annual . . . 1
3 Crude oil prices . . . 5
4 World oil balance and oil price . . . 5
5 World oil demand growth . . . 6
6 OPEC crude oil production . . . 6
7 U.S. crude oil production and rig count . . . 7
8 OECD crude oil stocks . . . 7
9 Global coal consumption . . . 8
10 Coal and natural gas prices . . . 8
11 Agriculture price indexes . . . 9
12 Agriculture price indexes, forecast . . . 9
13 Global grain supply growth . . . 10
14 World edible oil supply growth . . . 10
15 Stock-to-use ratios . . . 11
16 Global biofuels production . . . 11
17 Cofee prices . . . 12
18 Cotton and natural rubber prices . . . 12
19 Fertilizer prices . . . 13
21 Metal and mineral prices . . . 14
22 World reined metal consumption . . . 14
23 World metal consumption growth . . . 15
24 Copper price and LME stocks . . . 15
25 Precious metal prices . . . 16
26 Global gold mine production . . . 16
Acknowledgments
his World Bank Group Report is a product of the Prospects Group in the Development Economics Vice
Presidency. he report was managed by John Bafes under the general guidance of Ayhan Kose and
Franziska Ohnsorge.
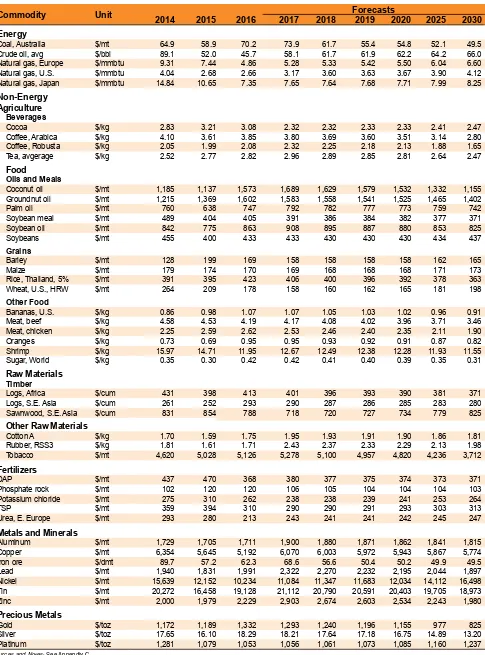
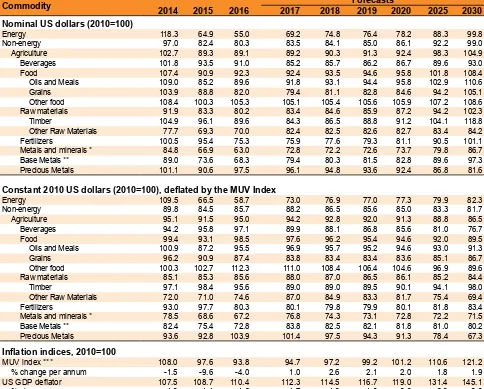
October. he report provides detailed market anal-ysis for major commodity groups, including energy, agriculture, fertilizers, metals, and precious metals. Price forecasts to 2030 for 46 commodities are psented, together with historical price data. he re-port also contains production, consumption, and trade statistics for major commodities. Commodity price data updates are published separately at the beginning of each month.
he report and data can be accessed at: www.worldbank.org/commodities
For inquiries and correspondence, email at: [email protected]
Many people contributed to the report. John Bafes authored the section on agriculture. Shane Streifel authored the sections on energy, fertilizers, metals, and precious metals. Xinghao Gong managed the report’s database. he design and production of the report was managed by Maria Hazel Macadandang and Adriana Maximiliano. Betty Dow, Anna Iva-nova, Bryce Ramsey Quillin, David Rosenblatt, and Dana Vorisek reviewed the report. Mark Felsenthal, Phillip Jeremy Hay, and Mikael Reven-tar managed the media relations and dissemination. he accompanying website was produced by Graeme Littler.
Executive Summary
Prices for most industrial commodities strengthened further in the first quarter (q/q), while global agricultural prices remained broadly stable. Crude oil prices are forecast to rise to an average of $55 per barrel (bbl) in 2017 from $43/ bbl in 2016. The oil forecast is unchanged since October 2016 and reflects balancing forces: upward pressure on prices from production cuts agreed by Organization of Petroleum Exporting Countries (OPEC) and non-OPEC producing countries, and downward pressure from persistently high stocks, supported by the faster-than-expected rebound of the U.S. shale oil industry. Metals prices are projected to increase 16 percent as a result of strong demand in China and various supply constraints, including labor strikes and contractual disputes in the case of copper, and environmental and export policies for nickel. Agricultural commodity prices, which gained 1 percent in the first quarter, are anticipated to remain broadly stable in 2017, with moderate increases in oils and meals and raw materials offset by declines in grains and beverages.
Recent trends
Energy prices rose 6 percent in the first quarter of 2017 (q/q), led by an 8 percent increase in crude oil (Figure 1). Natural gas prices in Europe and liquefied natural gas (LNG), both partly linked to oil prices, gained 16 and 7 percent, respectively, due to strong demand and a tight LNG market. U.S. natural gas prices fell 1 percent on lower demand as a result of mild weather. Coal prices fell 13 percent as supplies rebounded after China relaxed production limits. Crude oil prices jumped 8 percent in 2017Q1, aver-aging nearly $53/bbl. Prices dropped below $50/bbl in early March on concerns over commitments to the OPEC/non-OPEC cuts, larger-than-expected U.S. crude oil inventories, and a robust recovery in U.S. shale oil activity. However, prices recovered in early April, although with continued volatility, on renewed expectations of tightening supply and an extension of OPEC/non-OPEC production agreement. Over the course of 2017, the oil market is expected to rebalance on steady growth in demand and lower production from OPEC and some non-OPEC countries. Crude oil inventories have remained high, mainly in the
Source: World Bank.
Note: Last observation is March 2017.
Source: World Bank.
Note: Shaded area (2017-20) denotes forecast.
1 Commodity price indexes, monthly 2 Commodity price indexes, annual
United States, but are expected to start declining in the second quarter as seasonal refinery demand picks up.
Non-Energy commodity prices rose 4 percent in 2017Q1 with large variations among major groups. Agricultural prices gained 1 percent (Figure 1), but with large price movements among individual com-ponents, especially tropical commodities. Beverage prices declined nearly 7 percent due to a supply-driven collapse of cocoa prices. Raw materials prices strengthened, led by a surge in natural rubber prices following flood-related supply disruptions in South-east Asia. Grain prices increased nearly 4 percent, mostly in response to gains in maize prices, while oils and meals prices rose a modest 2 percent on a general strengthening of edible oil prices. Metals prices surged by 10 percent, driven by strong demand and various supply constraints. Precious metalsprices fluctuated widely on changing investor sentiment.
Outlook and risks
Energy prices are projected to increase 26 percent in 2017 and an additional 8 percent in 2018 (Figure 2,
0 30 60 90 120 150
1980 1990 2000 2010 2020 US$ constant, 2010=100
Energy
Agriculture
Metals
30 50 70 90 110 130 150
Jan-11 Jan-12 Jan-13 Jan-14 Jan-15 Jan-16 Jan-17 US$, 2010=100
Metals Agriculture
Table 1). Non-energy prices are expected to increase 4 percent in 2017, a 1 percent upward revision from January, and the first annual increase after five con-secutive declines.
Oil prices are projected to average $55/bbl in 2017, unchanged from the January 2017 forecast. The oil market is expected to tighten in 2017Q2, mainly as a result of OPEC/non-OPEC production cuts. Prices are projected to increase to $60/bbl in 2018 as the market regains balance, with shale production limit-ing larger price gains. Upside price risks include greater-than-expected compliance by OPEC/non-OPEC producers and supply outages among some exporters, notably Libya and Nigeria. On the down-side, weak compliance with the OPEC agreement and rising output from elsewhere, especially the United States, could delay rebalancing, as would slower de-mand growth. A faster-than-expected rise in U.S. shale oil production could also affect the supply bal-ance. Natural gas prices are projected to rise 15 per-cent in 2017, led by a 20 perper-cent jump in U.S. gas prices on strong domestic demand and rising exports. Moderate price increases are expected in Europe and Japan due to higher oil prices. Coal prices are expected to average 6 percent higher in 2017 due to policy-in-duced supply reductions in China in 2016. Beijing’s coal policy will be a key determinant for prices given that China consumes half of the world’s coal output. Agricultural prices are expected to remain stable in 2017, but there is considerable variation across com-modities. Grainprices are projected to decline 3 per-cent this year, unchanged from the January projec-tion, as favorable growing conditions have pushed stocks-to-use ratios (a measure of supply relative to
demand) of all key grains to 15-year highs. However, oils and meals prices are projected to increase 3 per-cent amid tight supplies in East Asian and South American supplies. Beverage prices are forecast to de-cline 6 percent in 2017, a downward revision from January, due to large cocoa supplies from West Africa. Raw materials prices are projected to gain 4 percent because of a supply shortfall in natural rubber. The end of the El Niño/La Niña cycle, which began in late 2015, limits upside risks to 2017-2018 agricultural price forecasts. Key downside risks are increased gov-ernment use of agricultural support policies and en-ergy price fluctuations, as agriculture is an enen-ergy-in- energy-in-tensive sector. Fertilizer prices are projected to increase 1 percent, but markets remain well supplied. Metal prices are forecast to increase 16 percent in 2017 (after dropping nearly 7 percent in 2016) on strong demand and tightening markets for most met-als. The largest gains are expected in zinc (32 percent) and lead (18 percent) due to mine supply closures (re-source exhaustion) and discretionary shut-ins in sev-eral countries. Copper prices are expected to increase by 18 percent as a result of various disruptions at some of the world’s largest mines—strikes (Chile), ex-port policies (Indonesia), and bad weather (Peru). Downside price risks for metals include slow growth in China and greater-than-expected production, in-cluding restart of idled capacity. Upside risks stem from stronger-than-expected demand, policy-induced supply restraints in Asia, environmental constraints, and impending labor negotiations. Precious metals prices are projected to decline by 1 percent in 2017 and a further 1 percent in 2018 as benchmark interest rates rise and safe-haven buying ebbs.
Source: World Bank.
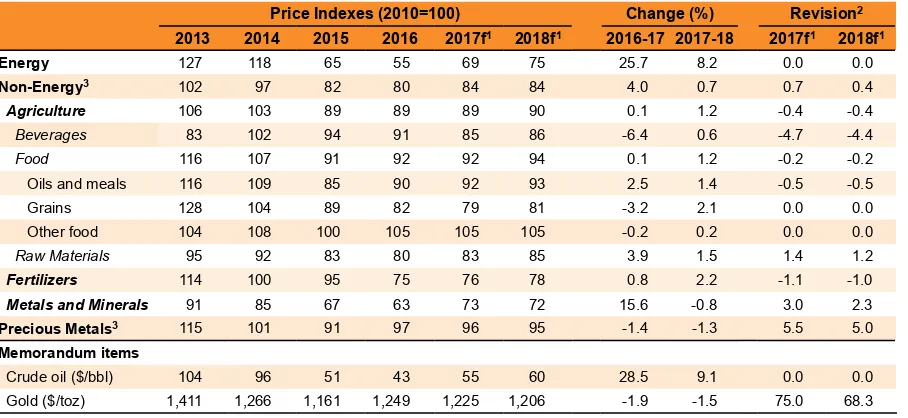
[image:10.612.92.546.507.716.2]Notes: (1) “f” denotes forecasts. (2) Denotes revision to the forecasts from the January 2017 report (expressed as change in index value except $/bbl for crude oil, and $/toz for gold). (3) The non-energy price index excludes precious metals. See Appendix C for deinitions of prices and indexes. Figures may not match due to rounding. TABLE 1 Nominal price indexes and forecast revisions
Price Indexes (2010=100) Change (%) Revision2
2013 2014 2015 2016 2017f1 2018f1 2016-17 2017-18 2017f1 2018f1
Energy 127 118 65 55 69 75 25.7 8.2 0.0 0.0
Non-Energy3 102 97 82 80 84 84 4.0 0.7 0.7 0.4
Agriculture 106 103 89 89 89 90 0.1 1.2 -0.4 -0.4
Beverages 83 102 94 91 85 86 -6.4 0.6 -4.7 -4.4
Food 116 107 91 92 92 94 0.1 1.2 -0.2 -0.2
Oils and meals 116 109 85 90 92 93 2.5 1.4 -0.5 -0.5
Grains 128 104 89 82 79 81 -3.2 2.1 0.0 0.0
Other food 104 108 100 105 105 105 -0.2 0.2 0.0 0.0
Raw Materials 95 92 83 80 83 85 3.9 1.5 1.4 1.2
Fertilizers 114 100 95 75 76 78 0.8 2.2 -1.1 -1.0
Metals and Minerals 91 85 67 63 73 72 15.6 -0.8 3.0 2.3
Precious Metals3 115 101 91 97 96 95 -1.4 -1.3 5.5 5.0
Memorandum items
Crude oil ($/bbl) 104 96 51 43 55 60 28.5 9.1 0.0 0.0
C
ommodiTy
m
ARkeT
d
eveloPmenTs
And
o
uTlook
Energy
Agriculture
Fertilizers
Metals and minerals
Energy
The World Bank Energy Price Index rose 6 percent in the first quarter of 2017 from the previous quarter. Oil prices increased 8 percent on lower production by several OPEC and non-OPEC producers. Natural gas prices rose 6 percent on stronger demand and some supply constraints, and coal prices dropped 12 percent as China relaxed production curbs.
Crude oil
Crude oil prices rose 8 percent in the first quarter (q/q), averaging $52.9/bbl (Figure 3), following agreements by OPEC and some non-OPEC pro-ducers to cut output in the first half of 2017. Prices traded in a narrow range near $54/bbl for much of the quarter on expectations that output cuts would draw down stocks and rebalance the market in coming months. However, prices dropped sharply in the second week of March, as money managers liquidated sizeable long positions on futures markets. The selloff was prompted by three main concerns: perceived weak comments from Saudi Arabian and Russian officials over commitments to production cuts; the persistence of high U.S. crude oil stocks; and robust recovery in U.S. shale oil activity. Prices traded between $50 and $54/bbl in April, as investors await the expected decline in stocks.
With steady growth in demand, rebalancing of the oil market continues. The sharp decline in investment since the price collapse in 2014 led to a decline in non-OPEC production last year. The group is pro-jected to record a modest gain this year, led by U.S. shale, but gains are not expected to keep pace with the growth in global demand. OPEC’s imposed produc-tion limits are expected to further restrict supply.
Crude oil stocks in the United States remained high during the first quarter, reflecting buildup at refiner-ies due to higher imports and reduced refinery pro-duction because of seasonal maintenance. The rise in imports was partly because of a surge in OPEC production in the fourth quarter, ahead of January cuts. Much of that increased output arrived into U.S. storage in the first quarter. U.S. stocks are expected to decline in the second quarter owing to a seasonal pickup in refinery demand.
Crude oil prices are projected to average $55/bbl in 2017, as global supplies fall short of demand. Stocks are expected to fall, especially in the second half of the year, assuming continuation of OPEC/non-OPEC production restraint (Figure 4).
Demand
World oil demand continues to grow at a relatively robust annual rate of 1.3 mb/d, although at a slower pace than the 2015 spike of 2.0 mb/d or 2.1 percent that was triggered by lower oil prices. That jump mainly occurred in members of the Organisation for Economic Cooperation and Development (OECD), where demand grew by an average 0.5 mb/d dur-ing 2015 and 2016 (Figure 5). Gains were shared between Europe and the United States. In the first quarter of 2017, OECD demand rose only margin-ally, with gains in Europe offset by declines in the other main OECD regions.
Oil demand growth in non-OECD countries has been comparatively stable in volume terms, rising at an average annual pace of 1.4 mb/d since 2005, with well over half of the increase in Asia. However, the rate of growth has slowed from an average of 3.6 percent (2005-14) to just 3.0 percent in 2015 and to a projected 2.7 percent in 2017. The slowdown has
Source: Bloomberg.
Notes: Daily frequency. Last observation is April 21, 2017.
Source: International Energy Agency, World Bank.
Notes: Balance is deined as the difference between world oil demand and supply. OPEC crude oil production for 2017 is assumed at 32.0 mb/d. Shaded area (2017Q2-2017Q4) represents IEA projections.
4 World oil balance and oil price Crude oil prices
3 20 30 40 50 60
Jan-16 Apr-16 Jul-16 Oct-16 Jan-17 Apr-17 US$/bbl Brent WTI 20 40 60 80 100 120 -2 -1 0 1 2 3
2007Q1 2009Q1 2011Q1 2013Q1 2015Q1 2017Q1 mb/d, quarterly US$/bbl, quarterly
Price
been concentrated in oil exporting countries—nota-bly Brazil, Russia, and Saudi Arabia—as these econo-mies have been affected by lower oil export revenues. The growth in China’s demand has also slowed as the country transitions to a more consumer-led econo-my. These effects have partly been offset by higher demand growth in India of 0.3 mb/d (7 percent) in 2016, and by slightly less this year.
For 2017, world oil demand is projected to increase by 1.3 mb/d (1.4 percent) to an average of 97.9 mb/d. All of the growth is expected to occur in non-OECD economies, with Asia accounting for 1.0 mb/d of the gain. China and India are projected to add a com-bined 0.6 mb/d, just under the 2016 increase. OECD oil demand is expected to be flat, following two years of relatively strong growth.
Supply
Although global oil supply growth has slowed sig-nificantly over the past two years, it still resulted in a surplus of 0.4 mb/d in 2016 (down from a surplus of 1.6 mb/d in 2015). Consequently oil inventories continued to climb. In 2016, non-OPEC production contracted by 0.8 mb/d (more than half of that in the United States), but this was more than offset by a 1.2 mb/d increase in total OPEC production, with the largest gains in Iraq, the Islamic Republic of Iran, and Saudi Arabia.
OPEC
OPEC abandoned its two-year market share strategy when it agreed in late 2016 to reduce production by 1.2 mb/d (from October levels) in the first half of 2017. Saudi Arabia agreed to the largest reduction, 0.49 mb/d, while Iraq accepted a cut of 0.21 mb/d. Libya and Nigeria are exempt, leaving the other eleven members with a first-half target of 29.8 mb/d.
Net compliance with pledged production cuts has been high, topping 100 percent in the latest monthly assessment. In March, the 11 OPEC countries pro-duced 29.8 mb/d, mainly the result of Saudi Arabia cutting production more than required (Figure 6). Compliance was high for other Gulf countries, with the exception of Iraq (71 percent compliant). For the non-Gulf countries, compliance was 91 per-cent, owing to a larger-than-required cut by Angola. Venezuela implemented modest cuts. Production in exempt OPEC countries (Libya and Nigeria) edged lower by a combined 0.1 mb/d during the quarter, as both countries face significant geopolitical hurdles to raise output. In total, OPEC produced 31.7 mb/d in March, down 1.4 mb/d from December 2016. OPEC is scheduled to meet on May 25 to discuss market developments and to consider extending/ amending output limits for the second half of 2017. Expectations are rising for extending the cuts. Non-OPEC
OPEC’s agreement to reduce production was condi-tional on 111 non-OPEC producers reducing output
by 0.56 mb/d. The largest of the non-OPEC produc-ers, Russia, agreed to reduce output by 0.3 mb/d, but will do so gradually, reaching its target in the second quarter. A number of other countries are using “natu-ral production declines” to count as cuts. The IEA has provisionally estimated non-OPEC compliance in March at just under two-thirds.
Non-OPEC supply peaked in 2015 and fell 0.8 mb/d 2016, with the largest declines in the United States (0.5 mb/d), China (0.3 mb/d), and Colombia
Source: International Energy Agency.
Note: Shaded area (2017Q1-2017Q4) represents IEA projections.
Source: International Energy Agency.
Note: Last observation is March 2017.
6 OPEC crude oil production World oil demand growth
5
1Azerbaijan, Bahrain, Brunei, Equatorial Guinea, Kazakhstan,
Malaysia, Mexico, Oman, Russian Federation, Sudan, and South Sudan. 6 8 10 12 14 16
Jan-07 Jan-09 Jan-11 Jan-13 Jan-15 Jan-17 mb/d Saudi Arabia Other Gulf Non Gulf -4 -2 0 2 4
2007Q1 2009Q1 2011Q1 2013Q1 2015Q1 2017Q1 OECD
China
Source: International Energy Agency, Baker Hughes.
Notes: Weekly rig count: last observation is April 21, 2017. Monthly production: last observation is March 2017.
Source: International Energy Agency.
Note: Last observation is February 2017.
8 OECD crude oil stocks U.S. crude oil production and rig count
7
and Mexico (0.1 mb/d each). These reductions were partly offset by notable increases in Brazil and Rus-sia, and by smaller increases elsewhere (e.g., Canada, Indonesia, the North Sea, and Oman).
For 2017, non-OPEC supply is projected to increase by 0.5 mb/d, with the United States accounting for 0.4 mb/d of the net gain. Other sizeable increases (Brazil, Canada, and Kazakhstan) are expected to be offset by declines in China and Mexico.
U.S crude oil output and drilling activity are rebound-ing faster than previously expected. After bottomrebound-ing out at 8.7 mb/d in the third quarter of 2016 (down from a high of 9.6 mb/d in April 2015), U.S. crude oil production rose to 9.0 mb/d in March (Figure 7). Much of the gain reflects rising shale oil output, but there were also increases in production in the offshore Gulf of Mexico and in Alaska. The U.S. Energy Infor-mation Agency (EIA) projects that crude output will rise to 10 mb/d by the fourth quarter of 2018, and that the increase will continue to come from shale and offshore Gulf of Mexico production.
The number of active rigs drilling for oil in the Unit-ed States has more than doublUnit-ed from its May 2016 low to 688 wells, but is still substantially below the 2014 peak (Figure 7). More than half of the increase has been in the Permian basin due to its lower cost structure and expanding resource potential. Sig-nificant cost reductions and improved efficiency (e.g., shorter drilling/completion times, longer horizontal pipe laterals, and higher initial production rates) have enabled companies to drill profitably in the current price environment. In addition, as prices moved toward $55/bbl, large hedging programs have locked in prices and helped secure financing for many small-to-midsize companies. While productivity improve-ments are expected to continue, shale companies may
face rising costs for services, supplies, and especially skilled labor.
Total oil stocks (crude oil and petroleum products) in OECD countries remain high, largely concentrated in crude in the United States. U.S. crude oil stocks reached new highs in the first quarter due to higher U.S. production, rising imports, and declining refin-ery runs (Figure 8). Weekly data show U.S. crude stocks remained high into early April, but started to fall as refining activity picked up following refinery maintenance. Meanwhile, OECD oil product stocks are elevated in North America and Europe, but closer to their 5-year average.
Price projections and risks
Crude oil prices remain projected to average $55/bbl in 2017, an increase of 26 percent over 2016. This increase reflects rising oil demand and falling stocks, and assumes an extension of the OPEC/non-OPEC agreement. Prices are projected to increase to $60/ bbl in 2018, assuming inventories returning to more typical levels.
There are significant risks to the oil price forecast. On the upside, stronger demand and greater compliance by OPEC/non-OPEC producers could accelerate rebalancing, as could supply outages among major exporters (e.g., Libya, Nigeria, and Venezuela). OPEC policy decisions to expand production cuts could also support higher prices, as could rising production costs. Downside price risks include weaker compli-ance with the OPEC agreement. Rising output from Libya and Nigeria could delay rebalancing, as could slower demand growth. A faster-than-expected rise in U.S. shale oil production—from further efficiency gains and increased profitability from potentially lower taxes—could also affect the supply balance.
0 300 600 900 1,200 1,500 1,800 2 4 6 8 10
Jan-07 Jan-09 Jan-11 Jan-13 Jan-15 Jan-17
mb/d Rig count
US oil rig count weekly (RHS)
U.S. oil production monthly (LHS)
200 300 400 500 600
Jan-07 Jan-09 Jan-11 Jan-13 Jan-15 Jan-17 Million barrels
United States
Source: World Bank.
Note: Last observation is March 2017.
Source: BP Statistical Review of World Energy.
10
Global coal consumption Coal and natural gas prices
9
Coal
An easing of production restrictions in China con-tributed to a 12 percent drop in thermal coal prices in the first quarter (q/q), the first decline in three quarters. Nevertheless, prices of thermal coal, which is used to produce electricity, remain elevated due to strong heating demand and low inventories at China’s ports and utilities. In late March, Cyclone Debbie disrupted coal production and transportation in Queensland Australia. The disruption, however, will mostly impact exports of coking coal, which is used in the manufacturing of steel.
Last year, China’s National Development and Reform Commission (NDRC) ordered coal mines to produce on a 276-day basis (from 330 days) to reduce produc-tion by 16 percent. As prices spiked, China tempo-rarily rescinded the rule on November 17. Although authorities were expected to reinstate the rule at the end of winter, they announced in March that it would not be restored as long as prices remained at a reason-able level. However, the NRDC ordered provinces to reduce overcapacity (by 150 million tons this year), ensure mine safety, and maintain supplies to domestic utilities. China also imposed stricter import inspec-tions for coal quality at its ports, which has increased the review period from 7-15 days to 40 days, and is likely to be a restraining force on import flows. Higher prices have helped put the Chinese industry on a sounder financial footing.
Coal prices are expected to average $70/ton in 2017 (up 6 percent from 2016) due to continued efforts by China to reduce coal supply. China’s coal policy will be a key determinant of prices given that the country consumes half of the world’s coal output and that coal accounts for nearly two-thirds of the country’s energy consumption (Figure 9).
Natural gas
Natural gas prices rose 6 percent in the first quarter (q/q), with increases concentrated in Europe and Asia on stronger demand and tighter supply (Figure 10). Gains were led by a 16 percent increase in Europe (for imported gas) to $5.7/mmbtu, reflecting stronger demand for power and heating, nuclear outages in France, high coal prices, and tight liquefied natural gas (LNG) supply. Spot gas prices declined from $8.5/mmbtu in early January to below $5/mmbtu in early April as seasonal demand ebbed.
The price of natural gas delivered to Japan rose 7 per-cent to $7.6/mmbtu, partly due to higher oil prices. (Contracted gas is indexed to oil prices with a lag of several months.) However, spot LNG prices (for prompt supply) have fallen from close to $10/mmbtu at the start of the year to under $6/mmbtu as winter demand winds down and supplies rebound from earlier outages, notably in the Gorgon gas project in Western Australia.
In the United States, natural gas prices fell 1 percent to $3.0/mmbtu on mild weather (and were down from $3.7/mmbtu in December). Following the second mildest February on record, colder weather in March helped push up demand and draw down stocks, leaving end-of-winter storage 17 percent lower than last year but 15 percent above the 5-year average. Natural gas prices are projected to rise 15 percent in 2017. The United States is expected to experience a 20 percent jump to $3.0/mmbtu on strong domestic demand, rising exports, and falling production. More moderate increases are expected in Europe and Japan on higher oil prices. Markets are expected to be amply supplied over the next several years, owing to large increases in LNG capacity, mainly from the United States and Australia.
0 5 10 15 20
Jan-07 Jan-09 Jan-11 Jan-13 Jan-15 Jan-17 US$/mmbtu Coal (Australia) Natural Gas (Japan) Natural Gas (U.S.) Natural Gas (Europe) 0 500 1,000 1,500 2,000
China India US Others
Agriculture
The World Bank’s Agricultural Price Index rose 1 percent in the first quarter of 2017 (q/q). Despite the modest overall gain, there were large price movements among some components, especially tropical com-modities (Figure 11). Beverage prices fell more than 6 percent owing to a supply-driven collapse of cocoa prices. Raw materials prices rallied, led by a surge in natural rubber prices caused by supply disruptions in South East Asia. Grain prices increased nearly 4 percent, mostly in response to gains in maize prices. Oils and meals rose a modest 2 percent on a general strengthening of edible oil prices.
he Agricultural Price Index is expected to remain steady in 2017, with some variation among individual commodities. Grainprices are projected to fall 3 per-cent, unchanged from the January projection. How-ever, oils and meal prices are expected to rise more than 2 percent, adding to last year’s 5 percent increase. Beverage prices are forecast to drop more than 6 per-cent, a large revision from the projected 1 percent de-cline in January. Raw materials are projected to gain 4 percent, after a decline by the same amount last year. There are few upside risks to the 2017 forecasts. For example, disruptive weather is not expected to pose a risk as the El Niño/La Niña cycle—warming and cooling of the equatorial Pacific Ocean—that began in late 2015 ended earlier this year. However, increased government use of agricultural support policies remains a key upside risk.
Food commodity prices are expected to increase through 2020 (Figure 12), with food and raw material prices rising more than beverages prices. However, the anticipated gains are not expected to ofset the much larger declines experienced during 2011-15.
Food
Grain prices increased 4 percent in the irst quarter (q/q), but stand at just half their late-2012 peak. he 2017Q1 price uptick relects shortfalls of maize and wheat output in the United States.
Overall, the April assessment for the 2016-17 season continue to point to a favorable crop for most grains. Global production of wheat is expected to reach a new record high of 751 million metric tons (mmt), according to the U.S. Department of Agriculture (USDA). Conditions for the global wheat crop are generally favorable in most key producing and exporting areas, including Australia, the European Union, the Russian Federation, and Ukraine. The stocks-to-use ratio (a measure of abundance of sup-plies relative to demand) exceeded 34 percent in the current season, a 15-year high, and is expected to stay high next season. Looking ahead, preliminary estimates for the upcoming 2017-18 season published by FAO-AMIS point to a lower global wheat crop in major producing countries, including Canada and the United States, where planted area is down.
Production of maize, which has been consistently revised upward throughout the current crop season, is projected to increase nearly 10 percent in 2016-17 on favorable crop conditions in most key suppliers, including Argentina, Canada, South Africa, Ukraine, and the United States. The stocks-to-use ratio at the end of the season is expected to reach 22 percent, a 16-year high. Preliminary estimates by FAO-AMIS tentatively put next season’s crop at 1 percent above this season’s, as large harvests in Argentina, Brazil, and South Africa more than offset a much smaller crop in the United States.
Rice production is expected to increase by more than 5 percent in 2016-17, driven by favorable crop
Source: World Bank.
Note: Last observation is March 2017.
Source: World Bank.
Note: Shaded area (2017-25) represents forecast.
12 Agriculture price indexes, forecast Agriculture price indexes
11 60 80 100 120 140
Jan-11 Jan-12 Jan-13 Jan-14 Jan-15 Jan-16 Jan-17 US$ indexes, 2010=100
Food Beverages Raw materials 30 50 70 90 110 130 150
1990 1995 2000 2005 2010 2015 2020
US$ nominal indexes, 2010=100
Food
Beverages
conditions in Southeast Asia, including in Indonesia, Thailand (the world’s top rice exporter), and the Philippines. Given that consumption is expected to increase by 4 percent, the stocks-to-use ratio will reach a 15-year high, as in the cases of wheat and maize, according to the USDA. The early FAO-AMIS assessment for 2017-18 indicates a favorable rice crop, and global production and consumption are expected to increase by about 1 percent each.
Based on the USDA’s April assessment—the last for the current season—combined global supplies (i.e., beginning stocks plus production) of wheat, maize, and rice are projected to reach 2,856 mmt this season, 5 percent higher than last season. These projections, which are almost final, imply that 2016-17 will be the fourth consecutive surplus year. Furthermore, FAO-AMIS preliminary projections for 2017-18 point to yet another surplus year (Figure 13).
he World Bank’s Oil and Meals Price Index increased 2 percent in the irst quarter of 2017; it stands 17 percent higher than a year ago. A 3 percent increase in palm oil prices (due to supply tightness in Malaysia and Indonesia) was counterbalanced by a 5 percent drop in soybean oil prices (due to ample supplies in South America, notably Argentina and Brazil). This season’s outlook for edible oils also remains favorable (Figure 14). Following last year’s diminished crop due to El Niño, global production of the 17 most consumed edible oils is expected to reach 214 mmt in 2016-17, a 6 percent increase. More than half of the growth is projected to come from palm oil (produced equally in Indonesia and Malaysia) and soybean oil (due to a shortfall in South America). Pro-duction of palm oil declined by the greatest amount on record in 2016-17 due to El Niño.
The oilseed supply outlook during the current season
(October 2016 to September 2017) is also healthy, with global supplies for the ten major oilseeds pro-jected to reach a new high of 552 mmt, 41 mmt higher than the previous season. Most of the increase in supplies is projected to come from a robust soy-bean crop, which is expected to reach 343 mmt in 2016-17, more than 10 percent higher than last season. Brazil and the United States are the major contributors to the increase. According to preliminary estimates by the International Grains Council, next season’s soybean crop will be even higher.
here are adequate supplies of most food commodi-ties this season. In the case of grains, stocks-to-use ra-tios are expected to reach multi-year highs (Figure 15). Early assessments of the 2017-18 crop season also point to good crop conditions, suggesting that large stock levels could mitigate the impact of any unex-pected production shortfalls. In view of the ample supply conditions, the World Bank’s Food Commodity Price Indexis expected to remain steady in 2017 and to rise a modest 1 percent in 2018. Commodity-spe-ciic supply conditions will cause some variation in prices—a large decline in beverages, a modest decline in grains, and an increase in oils and meals. Slightly higher grains and oils and meals prices are expected in 2018.
Risks
Main risks to the forecast for agricultural prices stem mostly from the supply side: energy and fertilizer prices, weather patterns, and domestic trade policies aimed at supporting prices received by farmers. Poli-cies related to the diversion of food commodities to the production of biofuels are a demand-side risk. Energy prices affect agricultural crop prices directly through fuel use and indirectly through chemical and fertilizer use; some fertilizers are directly made from
Sources: U.S. Department of Agriculture, FAO-AMIS.
Notes: April 2017 update. Years represent crop seasons (e.g., 2016 refers to 2016-17 crop season). Shaded area (202016-17) represents FAO-AMIS projections.
Source: U.S. Department of Agriculture.
Note: April 2017 update. Years represent crop seasons (e.g., 2016 refers to 2016-17 crop season).
14 World edible oil supply growth Global grain supply growth
13 -2 0 2 4 6 8 10
1995 1998 2001 2004 2007 2010 2013 2016 Palm oil
Soybean oil Rapeseed oil Others mmt, annual change
-100 -50 0 50 100 150 200
1995 1998 2001 2004 2007 2010 2013 2016 Maize
Sources: BP Statistical Review, International Energy Agency, OECD, World Bank.
Note: Shaded area (2017-25) represents IEA and OECD projections.
Global biofuels production
16 natural gas (or coal, in the case of China). If energy prices rise more than expected, prices for agricultural commodities would likely follow, especially grains and oilseeds, which are the most sensitive to energy price fluctuations. Conversely, lower energy prices could depress agricultural prices. Such risks, however, would affect the 2018-19 crop season, since most crop decisions for 2017-18 have been made.
Now that the El Niño/La Niña cycle that began in 2015 has come to an end, weather poses less upside risk to the agricultural price forecast. According to the U.S. National Oceanic and Atmospheric Administration, conditions in the equatorial Pacific Ocean—where the El Niño/La Niña cycle origi-nates—returned to normal earlier in 2017. At a local level, however, drought conditions in East Africa have inflicted severe damage to crops, according to FEWS NET, causing a food crisis in several countries, including southeastern Ethiopia, northeastern Kenya, large areas of Somalia, and South Sudan.
Two policy challenges have surfaced in the current environment of ample agricultural supplies. The first stems from policies aimed at increasing farm-gate prices through production subsidies and trade measures. For example, the Arab Republic of Egypt increased its wheat procurement price by 25 percent (effective April 15-July 15); India reinstated a 10 percent import duty on wheat; Indonesia, in an effort to promote self-sufficiency, announced the provision of fertilizer and other input subsidies for the produc-tion of maize; and the Philippines, also citing a self-sufficiency objective, announced support to the rice sector through credit and seed subsidies.
The second policy challenge relates to China’s tran-sition from stock-piling mechanisms to less price-distorting support programs. China’s importance in
agricultural commodity markets is reflected in its disproportionately high level of stocks for a number of important commodities, including maize, rice, and cotton. Thus far, the transition to lower stocks has taken place in an orderly fashion, as confirmed by the destocking process of China’s cotton sector.
Finally, the agricultural price outlook assumes that biofuels will continue to be a source of demand for food commodities. Biofuels, which currently account for 1.5 mb/d (1.6 percent) of global liquid energy consumption, come principally from the United States (in the form of maize-based ethanol), Brazil (as sugarcane-based ethanol), and from Europe (as edible-oil based biodiesel). The role of biofuels is expected to be less important in the long term, as pol-icy makers acknowledge the limited environmental and energy-independence benefits of biofuel policies. On April 14, the European Parliament approved leg-islation under which first-generation biofuels should account for up to 7 percent of final energy consump-tion in transport by 2020. Under current legislaconsump-tion, EU member states must ensure that renewable energy accounts for at least 10 percent of energy consump-tion in transport by 2020. The European Parliament has also requested discontinuation of palm oil use in biodiesel by 2020. Along similar lines, the U.S. House of Representatives introduced legislation in March 2017 that would impose a 10 percent cap on ethanol blended into transportation fuel.
Reflecting the recent fundamental shift in attitudes toward biofuels, biofuel production has changed very little in the past two years and is forecast to increase just 5 percent in 2017, versus an annual average rate of expansion of 15 percent during the preceding 10 years. More importantly, over 2017-25, annual bio-fuels production is expected to grow at a rate slightly above 2 percent (Figure 16).
Source: U.S. Department of Agriculture.
Notes: April 2017 update. Years represent crop seasons (e.g., 2016 refers to 2016-17 crop season).
Stock-to-use ratios 15 10 15 20 25 30 35 40
1990 1995 2000 2005 2010 2015 US$ indexes, 2010=100
Maize Rice Wheat 0.0 0.5 1.0 1.5 2.0
1990 1995 2000 2005 2010 2015 2020 2025 United States
Brazil European Union Others
Source: Bloomberg.
Notes: Daily frequency. Last observation is April 21, 2017.
Source: Bloomberg.
Notes: Daily frequency. Last observation is April 21, 2017.
18 Cotton and natural rubber prices Coffee prices
17
Beverages
The World Bank’s Beverage Price Index declined by more than 6 percent in 2017Q1 (q/q). The weaken-ing in Arabica prices reflects a well-supplied market: global output increased 15 percent in the 12-month period to March 2017 due to Brazilian bumper crop supplemented by good crops in Colombia, Hondu-ras, and Peru (Figure 17). The relative strength in Robusta prices reflects a shortfall in global output, due to declines in production in Brazil and Vietnam, the world’s key Robusta suppliers. A fairly balanced Arabica market implies no change in prices for 2017, but the deficit in Robusta is expected to raise prices by 13 percent.
The plunge in cocoa prices to almost $2/kg in Feb-ruary 2017, down from $3/kg in the first half of 2016, marked the eighth straight monthly decline and a 10-year low. The weakness reflects a 15 percent increase in global cocoa supply to more than 4.5 million tons in 2016-17. Most of the world’s key suppliers contributed to the increase, including Côte d’Ivoire (up 26 percent), Nigeria (up 18 percent), and Ghana (up 8 percent). With the cocoa market well supplied, prices are projected to decline 25 percent in 2017 before increasing marginally in 2018.
Global tea prices changed little in 2017Q1. How-ever, prices were up 16 percent in Mombasa and 5 percent in Colombo (q/q) due to a drought-induced production shortfall in East Africa and Sri Lanka as well as strong demand from Middle East countries. In contrast, tea prices plunged 23 percent at the Kolkata auction due to large stocks from last season, a good current year crop, and weak demand, the latter partly linked to the Indian government’s demonetization campaign in late 2016. Tea prices are expected to gain 6 percent in 2017 on expected market tightness.
Agricultural raw materials
The World Bank’s Raw Materials Price Index gained over 5 percent in 2017Q1 (q/q), and was up 7 per-cent from a year ago. The strengthening reflects a rally in natural rubber prices, accompanied by a moderate increase in cotton prices, while timber prices changed little.
Following years of relative stability around $1.60/kg, cotton prices rose 7 percent in 2017Q1, up 27 per-cent from a year ago (Figure 18). The strength reflects last season’s sharp drop in global production, from 26.2 mmt in 2014-15 to 21.0 mmt, most of which was accounted for by China. With consumption just above 24 mmt, the decline in production created a 3 mmt market deficit. The deficit was managed by China, drawing down its stocks from 12.9 mmt in 2014-15 to an estimated 7.5 mmt in the upcoming 2017-18 crop season. This managed stock draw cre-ated a stable price environment. Cotton prices are projected to increase 13 percent in 2017 on expected demand strengthening.
Natural rubber prices, which continued their year-long rally well into the quarter, moderated in March and early April. Despite the easing, prices were up 30 percent in the quarter and almost double the 2016Q1 average. On the supply side, the sector suffered con-siderable losses due to late 2016 torrential rains in Thailand and Malaysia, the world’s largest and third largest natural rubber suppliers. These losses coin-cided with strengthening of tire demand, including from China, the European Union, and the United States. Most natural rubber goes to tire manufactur-ing. Given the production losses and the ongoing demand strengthening, prices are expected to increase by more than 40 percent in 2017, with only marginal gains thereafter. 0.5 1.0 1.5 2.0 2.5 1.2 1.3 1.4 1.5 1.6 1.7 1.8
Jan-16 Apr-16 Jul-16 Oct-16 Jan-17 Apr-17 US$/kg Natural rubber (RHS) Cotton (LHS) US$/kg 2.5 3.0 3.5 4.0 4.5 5.0 1.3 1.5 1.7 1.9 2.1 2.3 2.5
Fertilizers
Fertilizer prices rose 5 percent in the first quarter (q/q), up for the second straight quarter (Figure 19). Urea prices jumped 16 percent and DAP prices rose 9 percent on strong demand and tight supply. Partly offsetting these gains, phosphate rock prices dropped 7 percent as new capacity added to oversupply, while potash prices edged lower. Fertilizer markets continue to face relatively weak global demand due to low crop prices. Markets remain well supplied with adequate stocks and growing low-cost capacity.
Nitrogen (urea) prices surged 15 percent, up for the second quarter (following two years of decline) on strong import demand in the U.S., global supply con-straints in key exporting regions, and limited export availability from China (the world’s largest producer). Demand in the United States (the world’s third largest nitrogenous fertilizer consumer after China and In-dia) is expected to subside after the end of the spring planting season. Furthermore, significant new capac-ity (Iowa, Oklahoma, and Texas) is expected to come online and will discourage imports. At the same time, output is recovering from the Black Sea, and China’s exports are expected to surge in the second and third quarters after domestic demand has been met. The global urea market is expected to be oversupplied go-ing forward, with new capacity expected from coun-tries with plentiful low-cost natural gas production, notably in the United States, but also in the Islamic Republic of Iran, Nigeria, and Malaysia.
Phosphate prices rose for the first time in eight con-secutive quarters. DAP rose 9 percent and TSP 1 per-cent on strong demand and tight supply availability, including lower exports from China (the world’s larg-est producer). Eight large phosphate producing com-panies in China have coordinated production cuts of
30 percent since December. Phosphate prices are ex-pected to weaken in the near term as exports from China pick up and demand moderates. Markets are expected to remain oversupplied, with further new ca-pacity expected in Morocco and Saudi Arabia. Potash (potassium chloride) prices fell less than 1 per-cent, down for the seventh straight quarter, owing to relatively weak demand and ample supplies. Record strong imports into China in the quarter (under exist-ing contract terms) led to high stocks which may de-lay settlement of a new annual contract, expected this quarter. The market is expected to remain over-sup-plied with new capacity expected in Belarus, Canada (the world’s largest producer), China, Jordan, Turk-menistan, and the United States.
Fertilizer prices are projected to rise by 1 percent in 2017, mainly as a result of strong demand in the first quarter. The largest gain will be for urea, up 15 per-cent. Most other fertilizer prices are projected to de-cline on continued oversupply. Fertilizer application, which has been on a rising trend (Figure 20), remains constrained by relatively weak crop prices, which in turn is a reflection of well-supplied agriculture mar-kets. Fertilizer prices are expected to increase moder-ately over the medium term due to expected growth in demand and higher energy costs. Higher prices will induce investment in required capacity for primary and processed fertilizer supply.
Risks to the forecast are tilted to the downside on weaker-than-expected demand, stronger-than-ex-pected increases in new capacity, and the restart of idle production. On the upside, higher agriculture prices could improve farmers’ profitability and boost the de-mand for fertilizer. Higher fertilizer input costs (espe-cially energy) could also support higher fertilizer prices.
Source: World Bank.
Note: Last observation is March 2017.
Sources: Agrium Fact Book, International Fertilizer Industry Association.
Note: Fertilizer consumption is expressed in nutrient content.
20 Global fertilizer consumption Fertilizer prices 19 0 200 400 600 800 1,000 1,200
Jan-07 Jan-09 Jan-11 Jan-13 Jan-15 Jan-17 US$/mt DAP Urea Potassium chloride 0 40 80 120 160 200
Metals and minerals
Metals prices surged by 10 percent in the first quarter (q/q), the fourth consecutive quarterly rise (Figure 21). Prices were driven higher by strong demand— particularly in China’s property, infrastructure, and manufacturing sectors—as well as various supply con-straints. Iron ore posted the largest gains rising more than 20 percent for the second consecutive quarter on strong steel demand and low stocks in China. Other metals posted solid price increases, with the exception of tin and nickel.
On the supply side, labor strikes (Chile, Peru) and contractual disputes (Indonesia) at large copper mines curtailed output. China introduced a new law that will also require certain aluminum smelters to cut output 30 percent in winter to reduce pollution. The partial lifting of Indonesian’s 2014 ore export ban, on the other hand, is expected to boost exports. Designed to promote development of a domestic processing in-dustry in Indonesia, the easing of the ban raises pros-pects of greater raw mineral exports (notably nickel ore and bauxite) and has depressed nickel prices. Overall, global supplies will expand this year as a re-sult of earlier investment. Furthermore capital expen-ditures by mining companies are expected to rise this year for the first time since 2012.
On the demand side, China’s transition to a con-sumption-led economy, along with industrial reform and environmental concerns, is expected to slow growth in metals demand. China’s efforts to boost its commodity-intensive infrastructure and construction sectors have been a key driver of metal demand. Chi-na’s share of world metal consumption surpassed 50 percent in 2015 (Figure 22), and the country has ac-counted for the bulk of the global growth in metals consumption over the past 15 years (Figure 23).
individual metal trends
Iron ore prices soared 21 percent in 2017Q1 (q/q), the fifth consecutive quarterly increase, on strong steel demand and restocking in China. Prices peaked near $95/ton during February but fell below $70/ton in early April on expectations of weakening demand due to record high inventories at Chinese ports, rising supply, and credit tightening in China that is expected weigh on steel demand. Exports from the major iron ore producers, Australia and Brazil, rose to record lev-els in the quarter; production in China is rising from the restart of higher cost capacity. New low-cost ca-pacity is expected to come online this year, notably from Vale’s S11D project in Brazil. This is expected to put downward pressure on prices and force high-cost production to close. Key uncertainties are the strength of steel demand and iron ore production in China. Copper prices jumped 11 percent (Figure 24) on sup-ply disruptions among the world’s largest producers. A 43-day strike at Escondida in Chile, the world’s largest copper mine, ended in late March without resolution, and workers will return under the current contract for 18 months before renegotiating. A three-week strike at Peru’s largest mine, Cerro Verde, ended in late March. Flooding also affected production in Peru, the world’s second largest copper producer. Meanwhile, at Grasberg—the world’s second largest copper mine—production was halted after the Indo-nesian government introduced rules in January 2017 restricting copper concentrate exports in a bid to boost its domestic refining industry. The Indonesian government issued a temporary mining license in early April allowing Freeport McMoRan to resume exports for eight months, while it discusses a long-term financial stability pact. While global mine out-put is expected to contract this year, prices eased in April following the end of disruptions.
Source: World Bank.
Note: Last observation is March 2017.
Source: World Bureau of Metal Statistics.
Note: Last observation is January 2017.
22 World reined metal consumption Metal and mineral prices
21 0 1 2 3 4 5 6
Jan-95 Jan-98 Jan-01 Jan-04 Jan-07 Jan-10 Jan-13 Jan-16 Mmt China OECD Other non-OECD 20 40 60 80 100 120 140
Jan-07 Jan-09 Jan-11 Jan-13 Jan-15 Jan-17 US$ indexes, 2010=100
Base metals
Zinc prices leapt 11 percent, rising for a fifth straight quarter and by over 70 percent during this period. The gains were fueled by strong demand to galvanize steel, and a tightening concentrate market owing to large mine closures in recent years. Higher prices are expected to prompt greater supply in China, and Glencore’s idled capacity is expected to eventually re-start. The large Gamsberg and Dugald River mines are expected to generate new production in 2018, while a slowing property market in China and threats of substitution may ease demand.
Aluminum prices rose 8 percent due to strong de-mand, restocking in China, falling London Metal Ex-change stocks, and concerns about a new Chinese law that went into effect on March 1. The law requires aluminum smelters in four northern provinces to cut output by 30 percent over the winter heating season (mid-November to mid-March) to reduce pollution. Although there are operational and cost uncertainties associated with stopping and starting aluminum plants over a (relatively short) four-month period, China is poised to move to a more balanced market after several years of oversupply.
Lead prices rose 7 percent on supply constraints and strong seasonal battery demand. The market has been tightening, as lead mine output has been affected by the closure of large zinc mines (where lead is a by-product), and intensifying environmental constraints on China’s mine industry. Demand remains strong for the battery and industrial sectors, including increas-ing demand for “stop/start” vehicles, which use bat-teries containing 25 percent more lead than conven-tional units. However, lead demand faces threats from a maturing electric bike sector in China and alternate battery technologies (e.g., lithium).
Partly offsetting the above gains, nickel prices fell 5 percent on expectations of renewed low-grade nickel
exports from Indonesia due to the partial reversal of that country’s ore export ban. Thus far the govern-ment has recommended exports of about one-third of the volume sought by the private sector. Meanwhile, in early February the Philippines announced closure of 23 of the country’s 41 mines, and suspension of five others, on environmental grounds. The affected mines account for more than one third of the country’s 2016 nickel production. Because companies can appeal the closures, the potential lost output is uncertain. China, the main nickel importer, is expected to offset the lost volumes from other countries, such as Guatemala and New Caledonia, as well as sulfide concentrates from the Russian Federation and Zimbabwe.
Tin prices fell 4 percent, the first decline in 5 consecu-tive quarters, on the prospects of rising exports from China, after the government abolished a 10 percent export tax on refined metal. Demand remains robust in the key electronics sector, and low stocks are keep-ing the market tightly balanced.
Price projections and risks
Metals prices are projected to rise by 16 percent in 2017 amid tightening markets for most metals. The largest gains are expected in zinc (32 percent) and lead (18 percent) due to mine supply constraints brought on by permanent closures due to resource exhaustion, as well as discretionary closures (Glencore). Copper is also expected to increase by 18 percent on mine dis-ruptions, while double-digit gains are also expected for aluminum, iron ore, and tin.
Upside risks to the price forecasts include stronger global demand, slower ramp-up of new capacity, tighter environmental constraints, and policy action that limits exports. Downside risks include slower de-mand from China and higher-than-expected produc-tion, including the restarting of idled capacity.
Sources: World Bureau of Metal Statistics, World Bank.
Note: 2016 estimate.
Source: Bloomberg.
Notes: Daily frequency. Last observation is April 21, 2017.
24 Copper price and LME stocks World metal consumption growth
23 0 100 200 300 400 500 600 700 0 2,000 4,000 6,000 8,000 10,000
Jan-07 Jan-09 Jan-11 Jan-13 Jan-15 Jan-17
US$/mt Thousand mt
Copper price (LHS)
LME stocks (RHS)
-10 -6 -2 2 6 10
1996 1998 2000 2002 2004 2006 2008 2010 2012 2014 2016 OECD
Precious metals
Precious metals prices rose marginally in the first quarter (q/q), but fluctuated widely during the period because of swings in investor sentiment (Figure 25). Platinum prices climbed 4 percent and silver prices gained 2 percent on strong investment demand, while gold prices slipped marginally. Precious metal prices fell to a low in December after the U.S. Federal Re-serve raised interest rates, but rose over the quarter as geopolitical and economic tensions heightened, and remained at elevated levels despite a further U.S. in-terest rate increase in March.
Gold prices fell slightly in the first quarter (q/q), aver-aging $1,219/toz, but were volatile over the period. Prices reached a low of $1,125/toz in late December, following the U.S. Fed decision to raise interest rates. They have been on an upward trend this year on strong investment demand amid geopolitical and eco-nomic uncertainty. Prices dipped before a U.S. Fed interest rate increase in mid-March, but reversed and approached $1,300/toz in early April. A number of factors have pushed investors towards gold as a safe haven asset, notably rising global tensions surround-ing Afghanistan, Syria, and North Korea; the deterio-ration of U.S./Russia relations; and upcoming elec-tions in several countries amid rising populist sentiment. In addition, uncertainty about inflation, deficits, and the level of the dollar have also helped propel gold prices higher. Physical gold demand re-mains weak, with China facing reduced preference for gold jewelry, particularly among the millennial gen-eration. In India, gold demand is expected to recover following the government’s decision last November to take 500 and 1,000 rupiah notes out of circulation. This created a temporary liquidity crisis and pullback in gold demand. Demand in India is also rising due to
higher incomes, restocking, and marriage/festive sea-son demand. Gold mine supply (Figure 26) continues to rise, supported by lower costs.
Platinum prices rose 4 percent on strong investment demand. Physical demand, however, remains weak amid declining consumer interest in diesel-fueled au-tos in the aftermath of the Volkswagen diesel emis-sions scandal, and policy plans to phase out diesel ve-hicles in major European cities. Alternate catalyst technologies and a switch to non-combustion engines also weigh against platinum demand. The market re-mains well supplied, and the latest wage agreements in South Africa should avoid labor disruptions in the near term.
Silver prices rose 2 percent on strong investment de-mand and similar market sentiment as towards gold. The gold/silver price ratio fell from 71.1 in the fourth quarter to 69.7 in the first quarter, and was down from 79.2 a year earlier (the average ratio over 1985-2016 is 66). Demand for jewelry has been weak in China and India, but strong in the photovoltaic and automotive sectors. Mine supply fell last year, with declines mainly in China. Lower by-product output from declining lead/zinc production may limit growth.
Precious metals prices are projected to fall 1 percent in 2017, but with some divergence. Gold prices are ex-pected to decline 2 percent on exex-pected further U.S. interest rate increases this year. Silver and platinum prices are expected to rise 1 percent, partly buoyed by strong industrial demand. Upside risks to the forecast include widening geopolitical tensions, stronger-than-expected physical demand in China, delays in antici-pated central bank rate increases, and mine supply shortfall. Downside risks include stronger economic growth, faster-than-expected increases in U.S. interest rates, and weaker physical demand.
Source: World Bank.
Note: Last observation is March 2017.
Source: World Bureau of Metal Statistics.
Notes: Production of ores and concentrates. Last observation is January 2017.
26 Global gold mine production Precious metal prices
25 600 900 1,200 1,500 1,800 2,100 5 15 25 35 45
Jan-07 Jan-09 Jan-11 Jan-13 Jan-15 Jan-17
US$/toz US$/toz Platinum (RHS) Silver (LHS) Gold (RHS) 0 50 100 150 200 250 300
Jan-95 Jan-00 Jan-05 Jan-10 Jan-15 Americas Europe Oceania Asia Africa
A
PPendix
A
TABLE A.1
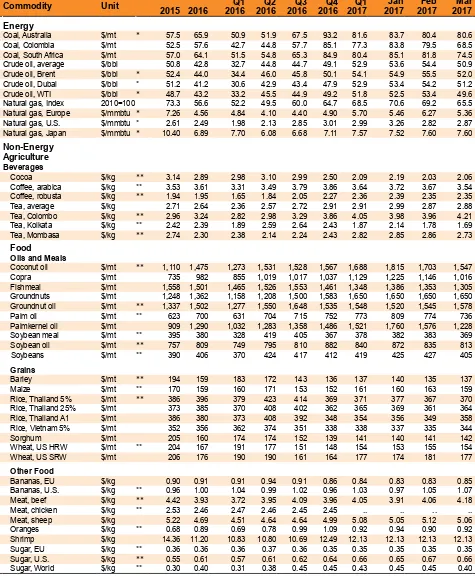
Commodity prices
Continued
Commodity Unit Q1 Q2 Q3 Q4 Q1 Jan Feb Mar
2015 2016 2016 2016 2016 2016 2017 2017 2017 2017
Energy
Coal, Australia $/mt * 57.5 65.9 50.9 51.9 67.5 93.2 81.6 83.7 80.4 80.6
Coal, Colombia $/mt 52.5 57.6 42.7 44.8 57.7 85.1 77.3 83.8 79.5 68.5
Coal, South Africa $/mt 57.0 64.1 51.5 54.8 65.3 84.9 80.4 85.1 81.8 74.5
Crude oil, average $/bbl 50.8 42.8 32.7 44.8 44.7 49.1 52.9 53.6 54.4 50.9
Crude oil, Brent $/bbl * 52.4 44.0 34.4 46.0 45.8 50.1 54.1 54.9 55.5 52.0
Crude oil, Dubai $/bbl * 51.2 41.2 30.6 42.9 43.4 47.9 52.9 53.4 54.2 51.2
Crude oil, WTI $/bbl * 48.7 43.2 33.2 45.5 44.9 49.2 51.8 52.5 53.4 49.6
Natural gas, Index 2010=100 73.3 56.6 52.2 49.5 60.0 64.7 68.5 70.6 69.2 65.5
Natural gas, Europe $/mmbtu * 7.26 4.56 4.84 4.10 4.40 4.90 5.70 5.46 6.27 5.36
Natural gas, U.S. $/mmbtu * 2.61 2.49 1.98 2.13 2.85 3.01 2.99 3.26 2.82 2.87
Natural gas, Japan $/mmbtu * 10.40 6.89 7.70 6.08 6.68 7.11 7.57 7.52 7.60 7.60
Non-Energy Agriculture Beverages
Cocoa $/kg ** 3.14 2.89 2.98 3.10 2.99 2.50 2.09 2.19 2.03 2.06
Coffee, arabica $/kg ** 3.53 3.61 3.31 3.49 3.79 3.86 3.64 3.72 3.67 3.54
Coffee, robusta $/kg ** 1.94 1.95 1.65 1.84 2.05 2.27 2.36 2.39 2.35 2.35
Tea, average $/kg 2.71 2.64 2.36 2.57 2.72 2.91 2.91 2.99 2.87 2.88
Tea, Colombo $/kg ** 2.96 3.24 2.82 2.98 3.29 3.86 4.05 3.98 3.96 4.21
Tea, Kolkata $/kg ** 2.42 2.39 1.89 2.59 2.64 2.43 1.87 2.14 1.78 1.69
Tea, Mombasa $/kg ** 2.74 2.30 2.38 2.14 2.24 2.43 2.82 2.85 2.86 2.73
Food
Oils and Meals
Coconut oil $/mt ** 1,110 1,475 1,273 1,531 1,528 1,567 1,688 1,815 1,703 1,547
Copra $/mt 735 982 855 1,019 1,017 1,037 1,129 1,225 1,146 1,016
Fishmeal $/mt 1,558 1,501 1,465 1,526 1,553 1,461 1,348 1,386 1,353 1,305
Groundnuts $/mt 1,248 1,362 1,158 1,208 1,500 1,583 1,650 1,650 1,650 1,650
Groundnut oil $/mt ** 1,337 1,502 1,277 1,550 1,648 1,535 1,548 1,520 1,545 1,578
Palm oil $/mt ** 623 700 631 704 715 752 773 809 774 736
Palmkernel oil $/mt 909 1,290 1,032 1,283 1,358 1,486 1,521 1,760 1,576 1,228
Soybean meal $/mt ** 395 380 328 419 405 367 378 382 383 369
Soybean oil $/mt ** 757 809 749 795 810 882 840 872 835 813
Soybeans $/mt ** 390 406 370 424 417 412 419 425 427 405
Grains
Barley $/mt ** 194 159 183 172 143 136 137 140 135 137
Maize $/mt ** 170 159 160 171 153 152 161 160 163 159
Rice, Thailand 5% $/mt ** 386 396 379 423 414 369 371 377 367 370
Rice, Thailand 25% $/mt 373 385 370 408 402 362 365 369 361 364
Rice, Thailand A1 $/mt 386 380 373 408 392 348 354 356 349 358
Rice, Vietnam 5% $/mt 352 356 362 374 351 338 338 337 335 344
Sorghum $/mt 205 160 174 174 152 139 141 140 141 142
Wheat, US HRW $/mt ** 204 167 191 177 151 148 154 153 155 154
Wheat, US SRW $/mt 206 176 190 190 161 164 177 174 181 177
Other Food
Bananas, EU $/kg 0.90 0.91 0.91 0.94 0.91 0.86 0.84 0.83 0.83 0.85
Bananas, U.S. $/kg ** 0.96 1.00 1.04 0.99 1.02 0.96 1.03 0.97 1.05 1.07
Meat, beef $/kg ** 4.42 3.93 3.72 3.95 4.09 3.96 4.05 3.91 4.06 4.18
Meat, chicken $/kg ** 2.53 2.46 2.47 2.46 2.45 2.45 .. .. .. ..
Meat, sheep $/kg 5.22 4.69 4.51 4.64 4.64 4.99 5.08 5.05 5.12 5.06
Oranges $/kg ** 0.68 0.89 0.69 0.78 0.99 1.09 0.92 0.94 0.90 0.92
Shrimp $/kg 14.36 11.20 10.83 10.80 10.69 12.49 12.13 12.13 12.13 12.13
Sugar, EU $/kg ** 0.36 0.36 0.36 0.37 0.36 0.35 0.35 0.35 0.35 0.35
Sugar, U.S. $/kg ** 0.55 0.61 0.57 0.61 0.62 0.64 0.66 0.65 0.67 0.66
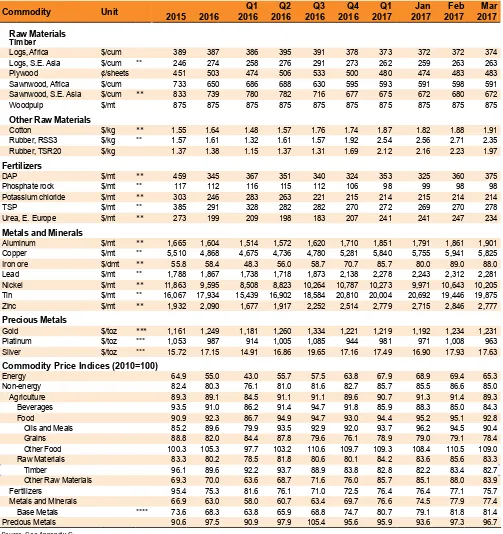
TABLE A.1
Commodity prices
Source: See Appendix C.
Notes: (*) Included in the energy index; (**) Included in the non-energy index; (***) Included in the precious metals index: (****) Metals and Minerals excluding iron ore. Monthly updates posted at www.worldbank.org/commodities.
Commodity Unit Q1 Q2 Q3 Q4 Q1 Jan Feb Mar
2015 2016 2016 2016 2016 2016 2017 2017 2017 2017
Raw Materials Timber
Logs, Africa $/cum 389 387 386 395 391 378 373 372 372 374
Logs, S.E. Asia $/cum ** 246 274 258 276 291 273 262 259 263 263
Plywood ¢/sheets 451 503 474 506 533 500 480 474 483 483
Sawnwood, Africa $/cum 733 650 686 688 630 595 593 591 598 591
Sawnwood, S.E. Asia $/cum ** 833 739 780 782 716 677 675 672 680 672
Woodpulp $/mt 875 875 875 875 875 875 875 875 875 875
Other Raw Materials
Cotton $/kg ** 1.55 1.64 1.48 1.57 1.76 1.74 1.87 1.82 1.88 1.91
Rubber, RSS3 $/kg ** 1.57 1.61 1.32 1.61 1.57 1.92 2.54 2.56 2.71 2.35
Rubber, TSR20 $/kg 1.37 1.38 1.15 1.37 1.31 1.69 2.12 2.16 2.23 1.97
Fertilizers
DAP $/mt ** 459 345 367 351 340 324 353 325 360 375
Phosphate rock $/mt ** 117 112 116 115 112 106 98 99 98 98
Potassium chloride $/mt ** 303 246 283 263 221 215 214 215 214 214
TSP $/mt ** 385 291 328 282 282 270 272 269 270 278
Urea, E. Europe $/mt ** 273 199 209 198 183 207 241 241 247 234
Metals and Minerals
Aluminum $/mt ** 1,665 1,604 1,514 1,572 1,620 1,710 1,851 1,791 1,861 1,901
Copper $/mt ** 5,510 4,868 4,675 4,736 4,780 5,281 5,840 5,755 5,941 5,825
Iron ore $/dmt ** 55.8 58.4 48.3 56.0 58.7 70.7 85.7 80.0 89.0 88.0
Lead $/mt ** 1,788 1,867 1,738 1,718 1,873 2,138 2,278 2,243 2,312 2,281
Nickel $/mt ** 11,863 9,595 8,508 8,823 10,264 10,787 10,273 9,971 10,643 10,205
Tin $/mt ** 16,067 17,934 15,439 16,902 18,584 20,810 20,004 20,692 19,446 19,875
Zinc $/mt ** 1,932 2,090 1,677 1,917 2,252 2,514 2,779 2,715 2,846 2,777
Precious Metals
Gold $/toz *** 1,161 1,249 1,181 1,260 1,334 1,221 1,219 1,192 1,234 1,231
Platinum $/toz *** 1,053 987 914 1,005 1,085 944 981 971 1,008 963
Silver $/toz *** 15.72 17.15 14.91 16.86 19.65 17.16 17.49 16.90 17.93 17.63
Commodity Price Indices (2010=100)
Energy 64.9 55.0 43.0 55.7 57.5 63.8 67.9 68.9 69.4 65.3
Non-energy 82.4 80.3 76.1 81.0 81.6 82.7 85.7 85.5 86.6 85.0
Agriculture 89.3 89.1 84.5 91.1 91.1 89.6 90.7 91.3 91.4 89.3
Beverages 93.5 91.0 86.2 91.4 94.7 91.8 85.9 88.3 85.0 84.3
Food 90.9 92.3 86.7 94.9 94.7 93.0 94.4 95.2 95.1 92.8
Oils and Meals 85.2 89.6 79.9 93.5 92.9 92.0 93.7 96.2 94.5 90.4
Grains 88.8 82.0 84.4 87.8 79.6 76.1 78.9 79.0 79.1 78.4
Other Food 100.3 105.3 97.7 103.2 110.6 109.7 109.3 108.4 110.5 109.0
Raw Materials 83.3 80.2 78.5 81.8 80.6 80.1 84.2 83.6 85.6 83.3
Timber 96.1 89.6 92.2 93.7 88.9 83.8 82.8 82.2 83.4 82.7
Other Raw Materials 69.3 70.0 63.6 68.7 71.6 76.0 85.7 85.1 88.0 83.9
Fertilizers 95.4 75.3 81.6 76.1 71.0 72.5 76.4 76.4 77.1 75.7
Metals and Minerals 66.9 63.0 58.0 60.7 63.4 69.7 76.6 74.5 77.9 77.4
Base Metals **** 73.6 68.3 63.8 65.9 68.8 74.7 80.7 79.1 81.8 81.4
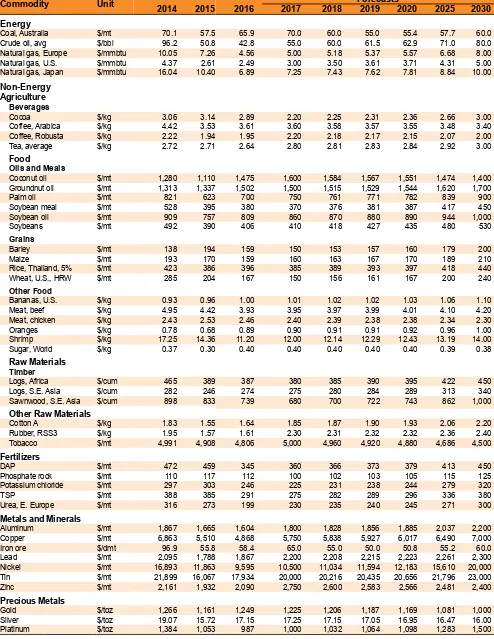
TABLE A.2
Commodity price forecasts in nominal U.S. dollars
Next update: July 2017.
Commodity Unit 2014 2015 2016 2017 2018 Forecasts2019 2020 2025 2030
Energy
Coal, Australia $/mt 70.1 57.5 65.9 70.0 60.0 55.0 55.4 57.7 60.0
Crude oil, avg $/bbl 96.2 50.8 42.8 55.0 60.0 61.5 62.9 71.0 80.0
Natural gas, Europe $/mmbtu 10.05 7.26 4.56 5.00 5.18 5.37 5.57 6.68 8.00
Natural gas, U.S. $/mmbtu 4.37 2.61 2.49 3.00 3.50 3.61 3.71 4.31 5.00
Natural gas, Japan $/mmbtu 16.04 10.40 6.89 7.25 7.43 7.62 7.81 8.84 10.00
Non-Energy Agriculture
Beverages
Cocoa $/kg 3.06 3.14 2.89 2.20 2.25 2.31 2.36 2.66 3.00
Coffee, Arabica $/kg 4.42 3.53 3.61 3.60 3.58 3.57 3.55 3.48 3.40
Coffee, Robusta $/kg 2.22 1.94 1.95 2.20 2.18 2.17 2.15 2.07 2.00
Tea, average $/kg 2.72 2.71 2.64 2.80 2.81 2.83 2.84 2.92 3.00
Food
Oils and Meals
Coconut oil $/mt 1,280 1,110 1,475 1,600 1,584 1,567 1,551 1,474 1,400
Groundnut oil $/mt 1,313 1,337 1,502 1,500 1,515 1,529 1,544 1,620 1,700
Palm oil $/mt 821 623 700 750 761 771 782 839 900
Soybean meal $/mt 528 395 380 370 376 381 387 417 450
Soybean oil $/mt 909 757 809 860 870 880 890 944 1,000
Soybeans $/mt 492 390 406 410 418 427 435 480 530
Grains
Barley $/mt 138 194 159 150 153 157 160 179 200
Maize $/mt 193 170 159 160 163 167 170 189 210
Rice, Thailand, 5% $/mt 423 386