An Intelligent Diagnostic System for Condition Monitoring of Ageing
Glass Insulators
Nouruddeen Bashir
1, Hussein Ahmad
1, Muhammad Abu Bakar Sidik
1,2Abstract
– A strong correlation exists between leakage current (LC) and insulator surfacecondition in relation to contamination severity and flashover. Subsequently, systems have been developed to monitor and evaluate contamination flashover. However, few works have been reported on the relationship between LC and insulator ageing especially glass insulators and thus a system capable of diagnosing ageing transmission line glass insulators does not exist. This paper describes the design and development of an intelligent diagnostic system for ageing transmission line insulators. The system consists of hardware and computer program. The LabVIEW and MATLAB softwares were employed to develop the computer program. Results from laboratory experiments using the developed system have shown the capability and effectiveness of the system in characterizing the surface condition of aged insulators. Copyright © 2011 Praise Worthy Prize S.r.l. - All rights reserved.
Keywords:
Ageing, Artificial Neural Network, Contamination, Flashover, Glass insulator, LabVIEW, Leakage current, MATLABNomenclature
ADC Analog-to-digital converter ANN Artificial Neural Network DAQ Data acquisition
DFT Discrete Fourier Transform FFT Fast Fourier Transform GUI Graphical User Interface Hz Hertz
kV kilovolts LC Leakage current mA milliamperes
MS/s Mega samples per seconds THD Total Harmonic Distortion V Volts
VI Virtual instruments
Vz Zener voltage
I.
Introduction
Transmission line insulators lose their electrical (insulation) and mechanical properties resulting from electrical stresses due to contamination and environmental factors during service. Due to such loss, LC flows from the high voltage part (transmission line) to the grounded part (tower) of the insulator. Depending on the level of contamination and electrical stresses on the surface of these insulators, the LC can trigger a flashover incident or cause ageing (surface degradation) leading to power outage. This has been a major concern by utilities
and industries. As a result of LC, transmission line insulators undergo ageing.
LC has been shown to be an effective tool in condition monitoring and diagnosis of high voltage insulators [1]. In addition, unlike other techniques used to study insulators such as surface resistance measurement or Equivalent Salt Deposit Density (ESDD) measurement, LC is the most efficient as it can be monitored online.
In relation to contamination severity and flashover, numerous studies have reported a strong correlation with insulator LC magnitude and systems have been developed to monitor the onset of flashover so as to prevent line
outages [2-7]. However, insulator ageing and
contamination flashover are independent and thus LC magnitude may not be a suitable parameter for monitoring the surface condition of ageing insulators. LC frequency components (harmonics) have been reported to be a more suitable parameter [8-11].
Systems for condition monitoring and diagnosis of ageing transmission line insulators do not exist due to the lack of studies establishing relationships between ageing and insulator LC.
Copyright © 2008 Praise Worthy Prize S.r.l. - All rights reserved International Review on Modelling and Simulations, Vol. x,
II.
Ageing of Transmission Line
Insulators
When the surface of an insulator is contaminated, the arrival of moisture produces a conductive layer causing LC to flow. Ohmic heating due to LC leads to the formation of dry bands. These dry bands will have high resistance causing the system voltage to concentrate across them. Partial discharges (arcing) activities take place within the dry bands as a result of localized insulation breakdown. If these discharge activities are sustained, they can lead to ageing. On the other hand, flashover occurs when the arcs elongates and bridge the whole insulator surface.
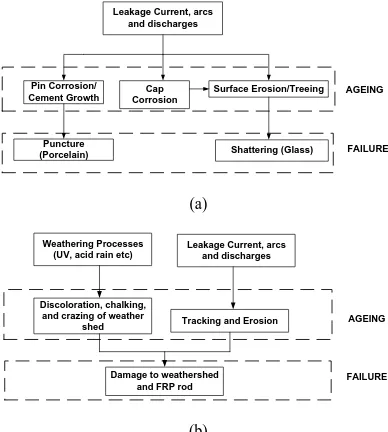
Ceramic insulators experience cap-and-pin corrosion and surface erosion during service as a result of frequent wetting and heavy contamination [12]. In polymeric insulators, concerns due to ageing are largely housing material tracking and erosion, failures along the rod-shed interface and brittle fracture [13]. Figure 1 shows the processes of insulator ageing and failure. A detailed explanation on the ageing processes has been reported in [14].
Leakage Current, arcs and discharges
Pin Corrosion/
Cement Growth Surface Erosion/Treeing
Puncture (Porcelain)
Cap Corrosion
Shattering (Glass) FAILURE AGEING
(a)
Weathering Processes (UV, acid rain etc)
Discoloration, chalking, and crazing of weather
shed Tracking and Erosion AGEING
Damage to weathershed and FRP rod
Leakage Current, arcs and discharges
FAILURE
(b)
Fig. 1. Ageing and failure processes of insulators (a) Ceramic insulators (b) Polymeric insulators
III.
System Development
The system block diagram developed for the diagnosis of aged insulators is shown in Figure 2. The system consists of 2 parts; hardware and software.
Shunt
Voltage divider
Analogue-to-digital Converter Computer Program for
Condition monitoring and Diagnosis
Fig. 2. Block diagram of the insulator intelligent diagnostic system
III.1. Hardware Design
The hardware part of the system consisted of a resistor (shunt), resistive voltage divider and an ADC.
The LC of an insulator under test was measured through a resistor. The resistor was connected in series with the test insulator between its low voltage terminal and ground. The voltage across the resistor is proportional to the measured LC. A protection circuit was designed incorporating the shunt. The protection circuit was designed to protect the entire system from over-voltages and over-currents. The over-current protection consists of a 50 mA fuse connected in series with the test sample. The over-voltage protection circuit consisted of two stages. Stage one was a gas discharge tube which suppresses any over voltage to 90 V. The
second stage was a zener diode with VZ = 9.1V placed to
clamp any voltage that exceeds the maximum allowable voltage of the ADC and data acquisition (DAQ) card. The maximum allowable voltage of the DAQ card used for this system is ±10 V. The resistor was placed after the protection circuit. The measured voltage drop (LC) across the shunt was further passed through a resistive voltage divider. The purpose of the divider was to fraction the voltage from the shunt to within the allowable input voltage range of the DAQ card (±10 V). The ADC was a 16 bit National Instruments Universal Serial Bus (USB) card NI USB-6259 having 32 analogue input channels, 4 analogue outputs, a sampling rate of 1.25 MS/s and an input voltage range of ±10 V.
III.2. Software Development
Insulator condition monitoring and diagnosis were done using computer programmes developed using LabVIEW and MATLAB softwares in a laptop computer.
a) LC Acquisition, Measurement and Storage:
languages systems use text-based languages to create lines of code, LabVIEW uses a graphical programming language, often called "G," to create programs in a pictorial form called a block diagram. Graphical programming eliminates a lot of the syntactical details associated with text-based languages [15]. These advantages make LabVIEW ideal for use in this work. LabVIEW programs are called VI. VIs appear and operate like actual physical instruments such as oscilloscopes, multimeters etc, but behind the scenes, they are analogous to main programs, functions and subroutines from programming languages like C or BASIC. A VI has two main parts [16]:
a. Front Panel: This is the interactive user interface
of a VI. It may contain push buttons, knobs, graphs, controls (for user inputs) or indicators (for program outputs). Data can be input using a mouse or keyboard and results viewed on the screen as well as stored by writing to files.
b. Block diagram: This is the VI’s source code
constructed in LabVIEW’s graphical programming language; G. The block diagram is the actual executable program consisting of built-in functions, constants, sub-VIs and program execution control structures.
The LC signal from the insulator under test is analogue in nature, and thus needs to be digitized before measurement via a PC is possible. The ADC acquires the signal through a process known as sampling and then digitizes the analogue samples. A sampled signal can be given as [17]:
where x(t) is the periodic signal with a sampling period of
T sampled at t = nT; n is the number of samples; Cn is the
fourier coefficient of any periodic signal; and p(t) is the sampling function with period T with a sampling
frequency of
T fs
1 = .
After the LC signal was digitized, to analyze the harmonic contents of the signal, Fourier Transform analysis was performed on the measured insulator LC signal. Fourier transformation transforms a time-domain signal to its frequency domain. Let x(t) be the time domain representation of a given signal x; the frequency domain representation of the signal x is denoted by X(f) in equation (2):
To compute the Fourier Transform digitally, numerical integration is performed. This gives an approximation to a true Fourier Transform called DFT. Equation (3) was used to compute the DFT:
∑
=− − = signal was the Fast Fourier Transform (FFT). To compute the amplitude spectrum of the LC in ampere rms, equations (4) and (5) were used [18]:= 1
where A is the insulator LC in the frequency domain. The amplitude spectrum gives the root-mean-square (rms) quantity of the measured insulator samples’ LC harmonic contents. In LabVIEW, the Harmonic Distortion Analyser VI was used to compute and display the power spectrum and amplitudes of the harmonic contents of the measured insulator LC as well as THD of the LC waveform. The THD was calculated using the equation (6) below:
1
where, h is the harmonic number, I1 is the fundamental
The amplitude and phase spectrum VI were used to display the LC amplitude spectrum.
Copyright © 2008 Praise Worthy Prize S.r.l. - All rights reserved International Review on Modelling and Simulations, Vol. x,
shown in Figure 3. Figure 4 shows the flow chart of the LabVIEW program to acquire and measure the LC.
Fig. 3. Front panel of LabVIEW program for LC measurement
START
Select DAQ Channel & Input
Terminal Configuration
Select Filter type, filter order; Set
cut-off freq.
Select Measurement Type
Select window type for amplitude
spectrum measurement Set highest
harmonic number to be measured
Press “run continuously”
button for continuous operation
Display averaged values of LC (peak and rms); frequency of
measured LC signal Display LC waveform (time
domain), Power & amplitude Spectrum
Display averaged values of harmonic amplitudes
Store all displayed values in excel files
STOP Set Buffer Size &
Sampling rate Create file path for
data storage of measured LC parameters
Fig. 4. Flow chart of the LabVIEW Program
b) Insulator Diagnosis:
The most widely used Artificial Intelligence (AI) technique in problems requiring estimation, prediction or pattern recognition is the ANN [19]. ANN has been successfully used in insulator contamination and flashover studies [20-25] and condition monitoring of power equipment [26-27]. In this work, ANN was employed to diagnose aged insulators according to the degree and type of ageing they have exhibited.
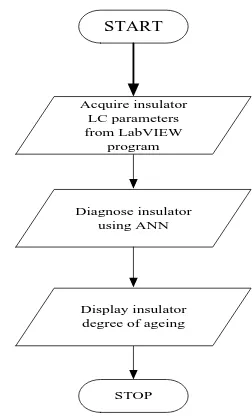
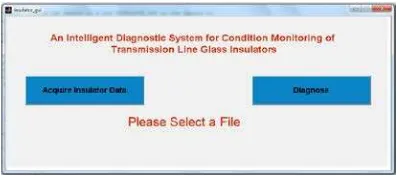
For the intelligent insulator diagnosis, two computer programs were developed using the MATLAB software. The first program was the construction of the ANN while the second program was the GUI. Figure 5 and Figure 6 show the GUI and flow chart of the program respectively. The MATLAB ANN toolbox was used to design and
construct the ANN. The back propagation ANN
algorithm was used due to its simplicity [19]. LC parameters measured by the LabVIEW program served as inputs of the ANN. The ANN had 3 layers; 2 hidden layers for higher efficacy [28] and an output layer comprising of 3 outputs. The values of the LC parameters were normalized before passing them to the ANN to ensure uniform statistical distribution.
The GUI pops up on the computer screen after LC acquisition and measurement has been done and prompts the user to acquire the LC parameters measured with the LabVIEW program by pushing the “acquire insulator data” button. To perform diagnosis, the user pushes the “diagnose” button on the GUI as shown in Figure 4(b). In the background, the designed ANN performs the diagnosis. The result of the diagnosis in words is displayed on the GUI stating the test insulator degree of ageing.
START
Diagnose insulator using ANN
STOP Display insulator degree of ageing Acquire insulator
LC parameters from LabVIEW
program
Fig. 6. GUI of insulator diagnosis program
IV.
Results and Discussion
The workability of the insulator intelligent diagnostic system was tested by carrying out laboratory experiments on new and naturally field-aged glass insulator samples. Three new insulator units and 42 insulator units of varying degree of corrosion, ranging from virgin insulator surface to severely corroded surface removed from 132 kV transmission line were used. The 45 insulator samples were grouped into 3 according to their degree of ageing; virgin, mild corrosion and severe corrosion. From the grouping, 14 insulators were virgin, 22 mildly corroded and 9 severely corroded.
The laboratory experiments were conducted inside an Artificial Climatic chamber (ACC) also known as fog chamber [29]. ACCs are widely used to carry out insulator studies simulating in-service conditions under controlled conditions. The laboratory experimental set-up and procedure as well as description of the ACC have been reported in detail in [30].
The LC characteristics of each insulator sample were measured and a strong correlation was observed between the degree of ageing and harmonic contents. The amplitudes of the insulator leakage currents’ odd harmonic components of transmission line glass insulators had distinct features in respect to their degree of ageing. Table 1 shows the harmonic patterns of the insulator samples.
TABLEI
PATTERNS OF INSULATOR LCHARMONICS
Insulator Samples (group)
Degree of ageing (corrosion)
LC Frequency Components (harmonics)
THD 1st 3rd 5th 7th
1 Severe LW HS HS HS HS
2 Mild L H H H H
3 Virgin HS LW LW LW LW
HS = Highest, H = High, L = Low, LW = Lowest
With this strong correlation, the LC harmonic components were used as input of the ANN. The relationship between the output value of the ANN and insulator ageing is shown in Table 2.
TABLEII
RELATIONSHIP BETWEEN ANNOUTPUT AND INSULATOR AGEING
Output Neuron Value 1 2 3
Degree of Ageing (corrosion) 1 0 0
0 1 0 0 0 1
Severe Mild Virgin (none)
There were two phases involved in the application of ANN; the learning and recall phases. In the learning phase, the ANN was trained to recognise the harmonic patterns in relation to degree of ageing. After the ANN has “learnt” this task, it was put to test (recall phase) by using it to diagnose aged insulator.
In the learning phase, the LC data of 28 insulator samples were used to train the ANN and 17 samples (remaining samples of the 45 samples that were not used in training the ANN) were used to test it.
Table 3 shows the ANN neuron outputs of the 17 insulator samples diagnosed using AI technique. Figure 7 shows the GUI of the diagnostic system displaying the diagnosis result of an insulator sample that was severely corroded.
TABLEIII
ANNNEURON OUTPUT FOR DIAGNOSED 17INSULATOR SAMPLES
Degree of corrosion
Neural network output 1 2 3 Severe 1.0000 0.0099 0.0000 Severe 1.0000 0.0018 0.0009 Mild 0.0000 1.0000 0.0000 Mild 0.0000 1.0000 0.0000 Mild 0.0000 1.0000 0.0000 Mild 0.3397 1.0000 0.0000 Mild 0.0000 0.9978 0.0217 Mild 0.0000 0.9996 0.0027 Mild 0.0000 1.0000 0.0000 Mild 0.0204 0.9538 0.0000 None 0.0000 0.0000 1.0000 None 0.0000 0.0000 1.0000 None 0.0000 0.0000 1.0000 None 0.0000 0.0000 1.0000 None 0.0000 0.0000 1.0000 None 0.0000 0.0000 1.0000 None 0.0000 0.0065 0.9890
Copyright © 2008 Praise Worthy Prize S.r.l. - All rights reserved International Review on Modelling and Simulations, Vol. x,
V.
Conclusion
In recent times utilities are shifting from breakdown or periodic maintenances of their power equipments to predictive maintenance such as online condition monitoring. In view of this, for predictive maintenance of transmission line insulators, diagnostic systems monitoring insulator LC have been developed for the prevention of contamination build-up and flashover. However, the main limitation of such systems is their ineffectiveness in monitoring and diagnosing aged insulators due to lacking relationship between LC and insulator ageing. To overcome this limitation, an intelligent diagnostic system to monitor ageing of transmission line insulator has been presented. Besides the ability of the system to monitor aged insulators online and in situ, diagnosis in real-time has been made possible due to the integration of ANN into the system.
References
[1] M. A. R. M. Fernando, S. M. Gubanski, Leakage Current on Non-ceramic Insulators and Materials, IEEE Transactions on Dielectrics and Electrical Insulation, vol. 6 n. 5, 1999, pp. 660-667.
[2] J. L. Fierro-Chavez, I. Ramirez-Vazquez, G. Montoya-Tena, On-line Leakage Current Monitoring of 400 kV Insulator Strings in Polluted Areas, Proc. IEE Generation, Transmission and Distribution, pp. 560- 564, 1996.
[3] W. L. Vosloo, J. P. Holtzhausen, The Prediction of Insulator Leakage Currents from Environmental Data, IEEE Region 8 International Workshop (AFRICON), pp. 603-608, 2002. [4] E. Thalassinakis, C. G. Karagiannopoulos, Measurements and
Interpretations concerning Leakage Currents on Polluted High Voltage Insulators, Meas. Sci. Techno., Vol. 14, 2003, pp. 421-426.
[5] C. J. Bennoch, M. D. Judd, J. S. Pearson, System for on-Line Monitoring of Pollution Levels on Solid Insulators, IEEE Intern. Sympos. Electr. Insul. (ISEI), pp. 237-240, 2002.
[6] S. Kurihara, Y. Z. Arief, T. Tsurusaki, S. Ohtsuka, Y. Hashimoto, S. Higashi, M. Hikita, "Construction of Remote Monitoring System for Separative Measurement of Leakage Current of Outdoor Insulators", Intern. Conf. Propagation & Application Dielectr. Materials (ICPADM), pp. 1-4, 2003, Nagoya, Japan, [7] E. Fontana, S. C. Oliveira, F. J. M. M. Cavalcanti, R. B. Lima, J.
F. Martins-Filho, E. Meneses-Pacheco, Novel Sensor System for Leakage Current Detection on Insulator Strings of Overhead Transmission Lines, IEEE Trans. Power Delivery, Vol. 21, 2006, pp. 2064-2070.
[8] J.-H. Kim, W.-C. Song, Y.-K. Park, H.-G. Cho, Y.-S. Yoo, K.-J. Yang, Leakage Current Monitoring and Outdoor Degradation of Silicone Rubber, IEEE Trans. Dielectr. Electr Insul., Vol. 8, 2001, pp. 1108-1115.
[9] A. H. El-Hag, S. H. Jayaram, E. A. Cherney, Fundamental and Low Frequency Harmonic Components of Leakage Current as a Diagnostic Tool to Study Aging of RTV and HTV Silicone Rubber in Salt-Fog, IEEE Trans. Dielectr. Electr. Insul, Vol. 10, 2003, pp. 128-136.
[10] H. Ahmad, M. A. Salam, Y. Y. Lee, N. Bashir, Harmonic components of leakage current as a diagnostic tool to study the aging of insulators, Journal of Electrostatics, Vol. 66, 2008, pp. 156-164.
[11] N. Bashir and H. Ahmad, Leakage Current Harmonic Components: Indexes to Insulator Ageing, IEEE Region 10 Conference (TENCON), pp. 1-5, 2009, Singapore.
[12] R. Parraud, D. Dumora, Corrosion Mechanism of Insulators in Tropical Environment, CIGRE Symposium, 2001, Queensland, Australia.
[13] J. P. Reynders, I. R. Jandrell, S. M. Reynders, Review of Aging and Recovery of Silicone Rubber Insulation for Outdoor Use, IEEE Trans. Dielectrics & Electrical Insulation, vol. 6 n. 5, 1999, pp. 620 - 631.
[14] N. Bashir, H. Ahmad, Ageing of Transmission Line Insulators: The Past, Present & Future, 2nd IEEE International Power & Energy Conference, pp. 30 – 34, 2008, Johor Bahru, Malaysia. [15] J. Travis and J. Kring, LabVIEW for Everyone: Graphical
Programming Made Easy and Fun, 3rd ed. (Prentice Hall, 2006).
[16] LabVIEW Manual, National Instruments, 2006.
[17] R.E. Zeimer, W.H. Tranter and D.R. Fannin, Signals and Systems: continuous and discrete, 4th Ed. (Prentice Hall, 1998). [18] LabVIEW, The Fundamentals of FFT-Based Signal Analysis
and Measurement in LabVIEW and LabWindows/CVI, (National Instruments, 2006).
[19] A. Konar, Artificial Intelligence and soft Computing: Behavioral and Cognitive Modeling of the Human Brain (CRC Press, 2000).
[20] A. S. Ahmad, S. A. K. Aljunid, A. S. Ahmad, P. S. Ghosh, Estimation of salt contamination level on the high voltage insulators surfaces during rainy season using Artificial Neural Network, 5th Int’l Conf. on Power Sys. Management & Control, pp. 303-308, 2002, London, United Kingdom.
[21] P. Clines, W. Lannes, G. Richards, Use of Pollution Monitors with Neural Network to Predict Insulator Flashover, Electric Power Systems Research, vol. 42, 1997, pp. 27-33.
[22] M. Ugur, D. W. Auckland, B. R. Varlow, Z. Emin, Neural Networks to Analyze Surface Tracking on Solid Insulators, IEEE Trans. Dielectrics & Electrical Insulation, vol. 4 n. 10, 1997, pp. 763-766.
[23] V. T. Kontargyri, A. A. Gialketsi, G. J. Tsekouras, I. F. Gonos, I. A. Stathopulos, Design of an Artificial Neural Network for the estimation of the Flashover Voltage on Insulators, Electric Power Systems Research, vol. 77, 2007, pp. 1532-1540.
[24] A. N. Jahromi, A. H. El-Hag, S. H. Jayaram, E. A. Cherney, M. Sanaye-Pasand, H. Mohseni, A Neural Network Based Method for Leakage Current Prediction of Polymeric Insulators, IEEE Trans. Power Delivery, vol. 21 n. 1, 2006, pp. 506-507. [25] P. S. Ghosh, S. Chakravorti, N. Chatterjee, Estimation of
Time-to-flashover Characteristics of Contaminated Electrolytic Surfaces using a Neural Network, IEEE Trans. Dielectrics & Electrical Insulation, vol. 2 n. 6, 1995, pp. 1064-1074.
[26] G. Mokhtari, G. B. Gharehpetian, R. Faraji-dana, M. A. Hejazi, On-line Monitoring of Transformer Winding Axial Displacement Using UWB Sensors and Neural Network, International Review of Electrical Engineering, vol. 5 n. 5, 2010, pp. 2122 – 2128.
[27] M. Sengul, S. Ozturk, B. Alboyaci, Sympathetic Inrush Phenomenon on Power Transformers and Fault Identification Using Artificial Neural Networks, International Review of Electrical Engineering, vol. 4 n. 5, 2009, pp. 1069 – 1075. [28] A. Zilouchian, M. Jamshidi, Intelligent Control Systems Using
Soft Computing Methodologies CRC Press, 2001).
[29] S. A. sebo, T. Zhao, Utilization of Fog Chambers for Non-ceramic Outdoor Insulator Evaluation, IEEE Trans. Dielectrics & Electrical Insulation, vol. 6 n. 8, 1999, pp. 676-686. [30] N. Bashir, H. Ahmad, Leakage Current Harmonic Components:
Authors’ information
1
Universiti Teknologi Malaysia, Malaysia 2
Sriwijaya University, South Sumatera, Indonesia
Nouruddeen Bashir was born in Kano, Nigeria. He received his B. Eng in Electrical/Electronics Engineering from Abubakar Tafawa Balewa University, Bauchi, Nigeria. He further received his M.Eng in Electrical Power Engineering and PhD in the area of High Voltage Engineering from University Teknologi Malaysia in 2006 and 2009 respectively. He is a senior lecturer at the Institute of High Voltage and High Current, Faculty of Electrical Engineering, Universiti Teknologi Malaysia. His research interests high voltage engineering, dielectrics and electrical insulation, surges, condition monitoring and diagnostics of high voltage power apparatus.
Hussein Ahmad was born in Mersing, Johor, Malaysia. He obtained his B.Sc (Hons) and M.Sc in Electrical Engineering from the University of Strathclyde, Scotland in 1977 and 1981 respectively and subsequently obtained his PhD degree in High Voltage Voltage Engineering from University of Manchester (formerly UMIST) in High Voltage Voltage Engineering from University of Manchester (formerly UMIST) in 1986. Currently he is a Professor in the faculty of Electrical Engineering, and the Director, Institute of High Voltage & High Current (IVAT), Universiti Teknologi Malaysia. His research interests include lightning protection, grounding system, Low voltage protection and insulation performance.