E-LEARNING IN PHOTOGRAMMETRY, REMOTE SENSING AND
SPATIAL INFORMATION SCIENCE
Vyas Anjana a, König Gerhard b
a Faculty of Technology, CEPT University, Ahmedabad, INDIA, [email protected]
Chair, ISPRS, TC IV/2
b Geodesy and Geoinformation Science, Technische Universität Berlin, Germany, [email protected]
Co-Chair, ISPRS, TC IV/2
COMMISSION VI, WG VI/2
KEY WORDS: e-Learning, Photogrammetry, Remote Sensing, Geo Spatial, Assessment Methods
ABSTRACT: Science and technology are evolving leaps and bounds. The advancements in GI-Science for natural and built environment helps in improving the quality of life. Learning through education and training needs to be at par with those advancements, which plays a vital role in utilization of technology. New technologies that creates new opportunities have enabled Geomatics to broaden the horizon (skills and competencies). Government policies and decisions support the use of geospatial science in various sectors of governance. Mapping, Land management, Urban planning, Environmental planning, Industrialization are some of the areas where the geomatics has become a baseline for decision making at national level. There is a need to bridge the gap between developments in geospatial science and its utilization and implementation. To prepare a framework for standardisation it is important to understand the theories of education and prevailing practices, with articulate goals exploring variety of teaching techniques.
E-Learning is an erudition practice shaped for facilitating learning and improving performance by creating, using and managing appropriate technological processes and resources through digital and network-enabled technology. It is a shift from traditional education or training to ICT-based flexible and collaborative learning based on the community of learners, academia, professionals, experts and facilitators. Developments in e-learning is focussed on computer assisted learning which has become popular because of its potential for providing more flexible access to content and instruction at any time, from any place (Means et al, 2009). With the advent of the geo-spatial technology, fast development in the software and hardware, the demand for skilled manpower is increasing and the need is for training, education, research and dissemination. It suggests inter-organisational cooperation between academia, industry, government and international collaboration. There is a nascent need to adopt multi-specialisation approach to examine the issues and challenges of research in such a valued topic of education and training in multi-disciplinary areas. Learning involve a change in an individual's knowledge, ability to perform a skill, participate and communicate. There is considerable variation among the theories about the nature of this change. This paper derives from a scientific research grant received from ISPRS, reveals a summary result from assessing various theories and methods of evaluation of learning through education, system and structure of it for GeoInformatics.
1. INTRODUCTION
Geoinformatics is ever expanding subject touching almost all areas of human endeavour ranging from retail to institutional domains. Use of geoinformatics to individuals, communities, governments, public bodies on national and global level increases its appeal.
Technological pace of the subject is ever increasing and envelope of technological advances is expanding fast. Being multidisciplinary to its core the advances are diverse and rapid. Geoinformatics is a force multiplier as it enhances the learning in many other disciplines which incorporate geography as one of the dimensions. Even without direct utility, this multiplicative character expands it to touch humanities, sciences and engineering domains. The human resource demand of geoinformatics is likewise quite diverse given the areas like research to industry to academic to governments.
The infrastructure of learning and teaching being the source of human capital so intensely related to progress of geoinformatics is indeed vast and multidimensional. There are world class institutes, plethora of courses teach the subject through universities, industry and institutions. The learning pedagogy, like many other disciplines, is adapting the e-learning concepts and some world class e-learning programs with myriads of national programs exist or on the anvil.
The present scenario of teaching and learning infrastructure being very vast, needs improvements in methods related to pedagogy and evaluation – almost on on-going basis.
This study is a step towards coming to the grips with pedagogy innovations required for future teaching and learning of Geo-Informatics.
1.1 Methodology
The methodology used for the study can be explained through a simple diagram shown in Fig. 1. The study contains three major parts, benchmarking, performance measurement and derivation of subjective model, which are performed one after another.
Fig. 1: Methodology used
.
2. GEO-INFORMATICS EDUCATION AND LEARNING
Education and training play vital role in the utilization of the technology. Shared and coordinated knowledge that geospatial technology and GIS deliver provides a deeper understanding of our present and will also help to better understand our future development. But it is not enough to explain new technological developments during workshops and seminars; it is also necessary to promote these new ideas and to distribute the knowledge by applying new learning strategies. (Vyas A and Koenig G, 2014). Education is a media through which the foundation of the knowledge and skill is built. The statistics reveal an increase in literate population globally. As a result, a shift in the employment structure is observed from a primary sector to a secondary and tertiary sectors. Thomas Friedman in his book ‘The World is Flat’ quotes the impact of globalization on adaptation of science and technology, the world has become large to tiny, he explains as it is a direct impact of faster medium of communication such as internet, cell phones, etc. (Friedman T., 2005). With the advancement in the data collection and analytical capabilities of remote sensing, geographical information system, global positioning system, the database management system has become one of the important areas. The nations have allocated funds for technology, research, education and capacity building.
E-learning is defined as all forms of electronically supported learning and teaching. It includes varied approaches, components and delivery, such as audio-video, literature sharing, animation, discussion boards, etc. The aim is to enhance the possible platforms for teaching, bring flexibility with time, availability for professionals, and open for any one and every one, hence attract the large population of learners beyond the boundaries, across the Globe. The level of flexibility is the biggest advantage by which individuals can get access to courses from the best institutes according to their own convenience. MOOC (Massive Open Online Course) is an online portal which allows unlimited participation and open access via web, while demonstrating through readings, lectures and forums which are interactive. MOOCs have the great advantage to share knowledge and teaching resources with a broad community. However it remains difficult to assess the work of students outside formal academic programs. (Gillieron P. Y, Vincent G and Merminod (2015). E-learning is complementary to the conventional learning but with the added benefit of flexibility of time, place and a wide variety of
choices. It bridges the geographical gap almost entirely. Virtual classrooms are as effective as real classrooms and admirable more where the scarcity of resources exists. The advantage for the students enrolled in e-learning programmes is availability of the lectures and reading material, all the time and any time.
Assessment of delivery methods can gauge the efficacy of e-learning and provide a guideline for introduction of e-e-learning techniques. It can counsel to realize varied sources and their respective pros and cons. Also it assists for getting a clear idea about how helpful the learnings would prove to be for their prospective profession. It can act as a tool for mentoring the designers of the courses. Assessment can help in meeting the objectives, and provide invaluable experience to the learners too. This research exercises for both the groups: students as well as designers of the course.
E-Learning is rapidly emerging as a ‘go-to’ option for new learners; a new paradigm of modern education. Hence, it is vital to know the effectiveness of e-learning by assessing and appraising. Assessment helps to get a clear direction on the information that the learner is looking for. The main objective for estimating the efficiency of e-learning courses is a) to increase the convenience to the learner for the best choice, b) guidance to the trainer for the impactful teaching and c) overall improvement at system’s level. Geo-Informatics Education Analysis.
Preparation of this case study is done through scanning of data available of all the major universities. These universities have been selected for the study as they offer education in Geo-Informatics specialisation. The information on the courses offered, the type of the courses, the duration, etc. have been collected.
2.1 Geo-Informatics Education Dogma
From the 115 universities, a random selection has been done for 24 universities across the globe which offer education in Geo-Informatics. Data about the professional careers of graduates in Geo-Informatics from these universities have been collected through different social media. These graduates are employed in various fields, at various levels and various locations. It was very interesting to note that many of these graduates having Geo-Informatics degree and knowledge are not necessarily working in the same specialised field of Geo-Informatics.
2.2 Field of Profession: Dominants and Minor
The analysis considers the dominant and minor fields in which the skilled graduates has chosen as profession. One of the analysis reveals that considering, each university defines a dominance in one or more fields, but not necessarily the graduates gets a placement in the same or similar domain. Secondly, the minor field defined as the field where very less number of graduates are pursuing their professional career. The result of this analysis could empower the university to redesign, upgrade and modify the offered programme, even decide on introducing a new course or closing down the current course. This analysis may provoke a university to carry out an extensive research to understand the demand and supply gap prevailing between industry and academia.
3. ASSESSMENT OF LEARNING METHODOLOGY
The traditional view has always been an assessment is about grading. One or more instructors assess the work of the students, with the primary—and perhaps sole—aim of assigning fair and appropriate grades to each of the students at the end of the course. An alternative view is that assessment can and should also play a vital part in the learning process itself. The most radical form of this alternative view is that the primary role of assessment is not about grading at all, but about learning, and that assessment practices should be developed and refined so that they assist the learner to learn effectively and feedbacks or surveys. In this the individuals who are part of the system will be asked to answer a typical set of questions related to behaviour and performance of the system.
3.1 External Assessment of Educational Program
Different agencies do assessment of a university or its program for different purposes. Media agencies do assessment to build a competitive scenario and accreditation institutes do the assessment for benchmarking. Whereas, funding organisations do the assessment to predict the initial credit score of a student or alumnus. Each such institute generates their own assessment method considering their vision towards education and respective understanding. Few institutes even generate a list of rank of universities and their courses using criteria and formula for a competitive assessment.
Times Higher Education ranks the universities on basis of five performance indicators namely Teaching, Research, Citations, International Outlook and Industry performance. The universities which do not teach undergraduates or their research output amounted to fewer than 200 articles, which were excluded from the list. The required data is collected from the concerned universities. The standardization approach was used for each indicator and then this whole data is crunched as per the assigned proportions to get to the final result. For e.g., teaching that carries 30% of overall weightage is further divided into five sub categories like Reputation survey (15%), Staff-to-student ratio (7.5%), Doctorate-to-bachelor’s ratio (2.25%), Doctorates awarded-to-academic staff ratio (6%) and institutional income (2.25 %).
AICTE-CII (All India Council for Technical Education - Confederation of Indian Industry) survey of industry-linked engineering institutions consists of two phases. In first phase, AICTE and CII team takes an extensive desk research to decide who would be invited to be part of the survey on the basis of fulfilment of certain conditions. In the second phase, the shortlisted institutes fill in the survey responses given by AICTE. The data is compiled and thereby analysed by the jury. The objective scores are obtained by evaluating the institutes against following parameters of Governance (10%), Curriculum (15%), Faculty (15%), Infrastructure (10%), Services (20%), Entrepreneurship (10%) and Placements (20%). For the final analysis, all the absolute data provided by the institutions are normalized and converted to the relative data to evaluate the
relative distance among the institutes across different parameters, thereby after normalization, the data is multiplied with their respective weights of each parameter and the total objective score is calculated.
Whereas QS World university rankings takes into account six indicators carrying different weightages. Four of the indicators from these are based on hard data and the remaining two are based on major global surveys. The indicators to be followed are Academic reputation, Employer reputation, Student -to-faculty ratio, Citations per -to-faculty, International -to-faculty ratio and international student ratio. The weightages given to the above indicators are as 40%, 10%, 20%, 20%, 5% and 5% respectively.
For the year 2012, the India Today Group in partnership with The Nielsen Company determined India’s top universities in the arts, science and commerce streams. The universities offering only post graduate programs were considered. To determine the ranks, the formula based on a perception score and an objective score was evolved. First step included the interviews with the experts to rectify the parameters on which the universities were to be judged. The list of universities was generated for the survey in the second step. After that, the experts were shown the list of universities and asked to rate them on identified parameters. They were told to distribute 100 points across the listed parameters. Every parameter was assigned weight based on the average importance given by experts. The overall perceptual score of a university was calculated on the basis of the ratings given by the experts on the five key parameters weighted by their importance. Then, the factual information was also collected in the next step from these shortlisted universities. Information was collected on parameters such as infrastructure, placements, academic input, research and publication, as well as faculty strength. At last, to get the overall score the weightage of 50% was applied to the overall perceptual score and 50% to overall factual scores.
With each ranking system applied, there is a variation of the parameters by which these gradations have been done. To truly understand the depth of any field, one must follow as many ranking styles to identify which sections require more attention, hence evaluating on a deeper level. These external assessments help universities to judge the requirements and expectations of the students with the universities.
3.2 Internal Assessment of Educational Programmes
Educational institutes use various methods of data representations to do an assessment of the education programme they are offering. A brief of such methods is explained below, followed by the strength and weaknesses of each methods.
3.2.1 Rubrics method
Rubric is a method of classifying and categorizing identified criteria for successfully completing an assignment or task and to establish levels for meeting these criteria. Rubrics is used to assess essay questions, projects, portfolios and representations and given to all faculties that are conducting and scoring the assessment. A well designed rubric will describe the definitions of each characteristic being assessed and descriptions of the best, worst and unacceptable characteristics of the identified criteria.
3.2.2 Rating Scale
Rating scale is a tool for stating specific criteria by appropriate information gathered by students and teachers and to make decision what students can do in relation to the outcomes. Rating Scales allow teachers to indicate the degree or frequency of the behaviours, skills and strategies displayed by the learner. Rating scales state the criteria and provide three or four response selections to describe the quality or frequency of student work.
3.2.3 Checklist
Checklist usually offer a direct interrogative type of questionnaire, which is in relation to student demonstration of specific criteria. They are mostly used to collecting sacrosanct data. They used to indicate relative quality of a product or performance.
3.2.4 Critical Thinking
As a method of evaluation, students are evaluated on the basis of their ability of critical thinking. In these method trainers evaluate students, based on their understanding on the concept of the subject from online discussions, their engagement with the course and brain storming with students. They try to find out what is the student’s contribution in learning by teamwork, writing or from presentation done by the student. All these activities done for evaluating the students measured by a scale named ART Scale. The ART Scale is comprised of factors like discussions, teamwork, writing, presenting etc.
3.2.5 Student Learning Outcome (SLO)
It is a method which evaluates students on the basis of their skills, knowledge and value of the course. SLO looks for the ability of the students to demonstrate their mastery of course. SLO is measured by student’s assignments, work samples, tests etc. It also evaluate the student’s attitude and the value toward the course. Student’s perspective towards the focus on course clarity in fundamental of course students can demonstrate their knowledge and skills.
3.2.6 Blended Delivery
In this method students are evaluated by computer based assessment. The students are encouraged and helped by the trainers to increase their motivation and support. Trainers also offer opportunities to improve student’s work before final grading.
3.2.7 Students Perspective for Assessment
In this method, the evaluation is completely done by the choice of student. The evaluation method is done from the student’s perspective. Students prefer the method to evaluate themselves, which can be less traditional and fully incorporated by technological tools. Also, trainers look at the level of enjoyment, engagement and creation of knowledge by student during the teaching period
Universities also go for internal assessment on a timely manner through feedbacks and surveys among the students, faculties and management. Way of conducting this assessment is very easy. Universities performs a series of surveys by end of each academic session to get a feedback from students about the course, curriculum development and teaching methods. Students get an opportunity to rate the course content as well as gives an overall rating to their mentor. This feedback collected is used for educational development and inculcate such apt changes into the course structure before new academic session starts. Currently, statistical properties are calculated out of these
feedbacks collected and relevance of such evaluation process does not produce any inference so far. Proper data analytics and inferences may ensure significant improvements in the course content, structure and teaching methodology.
Surveys and feedbacks conducted to collect and understand the qualitative analysis. The data collected through such surveys and feedbacks are processed through statistical methods and an inference from it is made by measuring the qualitative analysis resulted into quantity. The data collected through such means is based on human behaviours and opinions which is one of the challenge to measure it in quantitative terms. Soft computing may be used to design or find a model which can process the subjective data aptly.
Often, a survey is conducted or a feedback is collected through predefined questionnaires. The questionnaire comprises of closed and open ended questions wherein the respondents needs to give rank. In the end of the set, the overall evaluation is done by the respondents through the survey comprises of common question to understand the commonalities. There is surely a pattern which exists and governs how the ratings given to couple of questions affect the rating as a whole.
Statistical properties (like mean, mode, median etc.) are dealing with non-linear models. Fuzzy Inference Systems (FIS) are piecewise linear models and contains capabilities of processing natural language terms as well. Fuzzy sets were introduced by Zadeh (1965) as a means of representing and manipulating data that was not precise, but rather fuzzy. Fuzzy logic provides an inference morphology that enables approximate human reasoning capabilities to be applied to knowledge-based systems. The theory of fuzzy logic provides a mathematical strength to capture the uncertainties associated with human cognitive processes, such as thinking and reasoning. The development of fuzzy logic was motivated in large measure by the need for a conceptual framework which can address the issue of uncertainty and lexical imprecision. There are two main characteristics of fuzzy systems that give them better performance for specific applications. One, Fuzzy systems are suitable for uncertain or approximate reasoning, especially for the system with a mathematical model that is difficult to derive, and second, Fuzzy logic allows decision making with estimated values under incomplete or uncertain information. (Donner R F, 1995). So rather than assuming a linear model, assumption of model to be a FIS could yield better results. An Adaptive-FIS could be trained by the data collected in the survey to find the model containing the pattern which moulds the final rating of the whole depending on the ratings of the individual parts.
Neuro fuzzy hybrid system is a learning mechanism that utilizes the training and learning neural networks to find parameters of a fuzzy system based on the symptoms created by the mathematical model. Adaptive learning is the important characteristics of neural networks. Adaptive Neuro Fuzzy Inference System (ANFIS) is used for system identification
based on the available data. (Loganathan C and Girija K V, 2013). An adaptive neuro-fuzzy inference system or adaptive network-based fuzzy inference system (ANFIS) is a kind of an artificial neural network that is based on fuzzy inference system. Since it integrates both neural networks and fuzzy logic principles, it has potential to capture the benefits of both in a single framework. Its inference system corresponds to a set of fuzzy ‘IF–THEN’ rules that have learning capability to approximate nonlinear functions.
ANFIS being a universal estimator can be used to learn the pattern which exists and governs how the ratings given to couple of questions affect the rating as a whole. Thus the fuzzy membership functions learned by the system will reveal the bias of an average mind towards each aspect covered in the feedback.
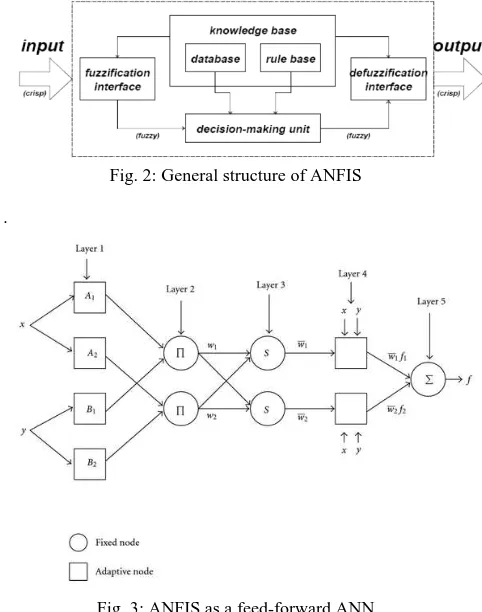
The general structure of ANFIS is shown in Fig. This clearly shows that the system is simultaneously rule based as well as data-driven. FIS basically consist of five subcomponents, a rule base (covers fuzzy rules), a database (portrays the membership functions of the selected fuzzy rules in the rule base), a decision making unit (performs inference on selected fuzzy rules), fuzzification inference and defuzzification inference. The first two subcomponents generally referred knowledge base and the last three are referred to as reasoning mechanism (which derives the output or conclusion). An adaptive network is a feed-forward multi-layer Artificial Neural Network (ANN), Fig, with; partially or completely, adaptive nodes in which the outputs are predicated on the parameters, and the adjustment of parameters due to error term is specified by the learning rules. Generally learning type in adaptive ANFIS is hybrid learning.
Fig. 2: General structure of ANFIS
.
Fig. 3: ANFIS as a feed-forward ANN
The fuzzification interface (Layer 1) contains the fuzzy membership functions which could be any continuous function
defined for all the possible input values. These membership functions captures the subjectiveness of the answer given. The knowledge base (Layer 2) contains the rule base which defines the dependencies of dependent question on to the independent questions. For example, for a feedback system containing only positive questions a possible rule could be: IF (Layer 1) all the independent questions get good ranks then (Layer 4) the dependent question will get good rank. After crunching down the outputs of each rule when the fuzzy inputs are applied to them a final decision is made. This final decision is the predicted rank for the dependent question.
During the training of the system the error between the predicted rank of dependent question and the actual rank from the database is used to change the weightage given to each rule in rule base as well as to change the parameters of the membership functions. Thus, the system actually learns to predict the rank of the dependent question using the ranks of independent questions.
Complexity of this system is directly proportional to the number of rules, number of independent questions, number of membership function associated with each question and the shape of membership function chosen. With complexity, the size of dataset needed for training also increases. As an ANFIS is a universal estimator and can learn any complex and higher order non-linear function one can do a good analysis even with a small number of rules and simple membership functions. But a good amount of training data ensures good results.
Once the system is trained over a good amount of dataset, it can be used to gain multiple insights. Simply, the difference between the predicted rank and the submitted rank could tell about the genuineness of the feedback given. Level of overlap different membership functions for same question tells about the possible polarity of responses. Which could be further used to make judgement over importance or relevance of the questions in the questionnaire leading to development of a better questionnaire. Whereas, shape of this membership curves could be used to judge the bias contained by each question over the final rating. This will help in building the guidelines to enhance the subject delivery.
The relevance and importance of the method is that it can be applied to any feedback system containing set of independent and dependent questions. The only need is a set of rules to be defined and a good amount of data from where the learning can happen. The outcome of the method is a better understanding of the subjectiveness of human behaviour. The bias given to each question will help to decide the importance of each question and thus development of a better questionnaire for future feedbacks.
This method helps in:
Defining the genuineness of a submitted feedback by estimating the answers to the dependent questions.
Design a better questionnaire by calculating the bias or impact created by each rank in each question. Same impact of each rank for a question means the question is irrelevant.
Setting up the priorities for bringing in the improvement in the whole system.
4. RESULTS
Study of dominant areas of the placement for respective university and minor areas of placement. The analysis represents two distinct doctrine:
University Area Envelope – Universities receive an attention to upgrade, enhance and modify the philosophy of the Geo-Informatics programme in their respective areas, can compare with the global scenario.
Student Recourse - students can use this analysis as the guideline to choose the university according to respective desired professional realm.
4.1 Trends of Different Fields
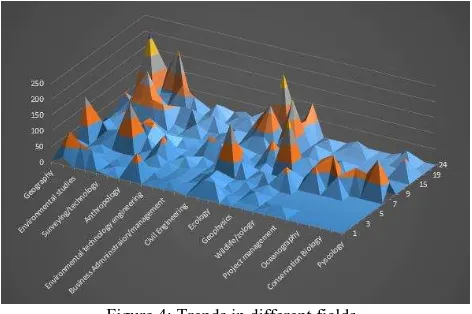
The analysis of 24 universities, selected (out of 115 universities) such that those offer similar subjects in Geo-Informatics at post-graduation. Three data sets, i.e., universities, no. of students opted for post-graduation in Geo-Informatics and the discipline, represented through a 3-D model (Graph 1). This inference from this statistics emerges the students’ desire to take Geo-Informatics as a specialisation or higher studies. For instance, more number of students from disciplines like Geography, surveying technology and environmental studies opting for post-graduation in Geo-Informatics, followed by graduation in oceanography, forestry, biology students opt for Geo-Informatics as higher studies.
Figure 4: Trends in different fields. 4.2 Assessment of Educational Program
The whole exercise of internal assessment through surveys was performed on a typical set of students for courses in a program. The ANFIS was trained over a dataset of more than 2,500 tuples. The feedback form was containing two set of question in it, and a student has to answer the question in terms of a number between 1 and 5, 1 being very bad. First set was containing five questions about the course and second set was containing ten questions about the content delivery. It can be clearly observed that the answer to question #5 is directly dependent on answers to questions #1 to #4 and similarly answer to question #15 is directly dependent on answers to questions #6 to #14.
When 2 ANFIS were trained, over this dataset, for two rules:
About the course
IF answer to #1 is Bad AND …. AND #4 is Bad THEN answer to #5 is Bad.
IF answer to #1 is Good AND …. AND #4 is Good THEN answer to #5 is Good.
About the content delivery
IF answer to #6 is Bad AND …. AND #14 is Bad THEN answer to #15 is Bad.
IF answer to #6 is Good AND …. AND #14 is Good THEN answer to #15 is Good.
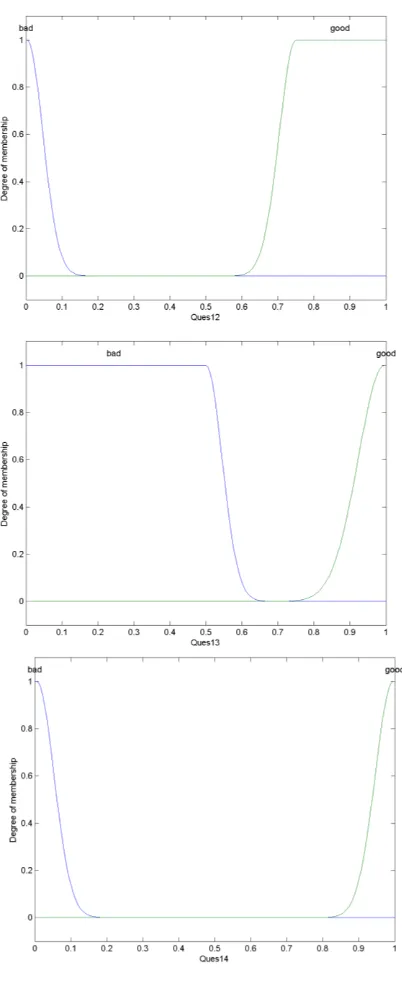
Here, each question is given two membership function “Good” and “Bad”. For these typical ANFIS, Gaussian curves were chosen to be trained as they are very much similar in shape to the firing functions of human brain neurons. The general equation to such a function is:
where, is name of fuzzy set, is the input and , , are constant parameters. Thus during training these constant parameters are changed in a way that the dependency of the primitive questions on the conclusive question is captured.
Membership functions for question #1 - #4 and #6 - #14, of the trained ANFIS are shown:
Using the membership curves obtained from the trained ANFIS Impact Matrix can be formed. In this matrix, impact created by movement in rating given to one question is showcased.
Depending the grade received in each question an instructor/academician can prioritize onto which question he/she should work so that the overall rating (Ques. 5 & 15) will improve faster. For example, if the rating in Ques. 1—4 are 3, 2, 2, 2 respectively, the priority (descending order) for the instructor should be Q.4, Q.2, Q.3 & Q.1 to get a higher positive impact on rating of Q.5 with minimum efforts.
5. CONCLUSION
The paper contains a brief survey about the various teaching and assessment methods used by educational institutions across the globe elaborating over pedagogy.
A novel method of analysis of internal assessment carried out through feedbacks is also proposed. This leads to instructions for significant improvements in the system including course content, structure and teaching methodology, for which an artificial neural network that is based on fuzzy inference system (adaptive network-based fuzzy inference system (ANFIS)) was adopted and tested on the large database, which reveal the bias of an average mind towards each aspect covered in the feedback. The outcome of the method is a better understanding of the subjectiveness of human behaviour. The bias given to each question will help to decide the importance of each question and thus development of a better questionnaire for future feedbacks. The result derived from this method are: a) Defined the genuineness of a submitted feedback by estimating the answers to the dependent questions, b) Developed better questionnaire by calculating the bias or impact created by each rank in each question. Same impact of each rank for a question means the question is irrelevant, c) Set up the priorities for bringing in the improvement in the entire system of learning and education.
ACKNOWLEDGEMENTS
The authors acknowledge the receipt of the grant received from 2015 ISPRS Scientific Initiative. This paper is a result of the study undertaken under this grant.
REFERENCES
Christine Spratt, Paul Lajbcygier (2009): E-learning technologies and evidence based assessment approaches, IGI Global Publications.
Coppock J.T. & Rhind D.W., 1991, "The History of GIS". In Maguire D.J., Goodchild M.F., and Rhind D.W. (editors) Geographical Information Systems : Principles and Applications, Volume 1, John Willy & Sons, Ltd.
Deshogues, P.Y. Gilliéron Enhancement of e-learning in Geomatics by the integration of dynamic mathematics, 2010 tools E-book.
Donner R F (1995): Neural Fuzzy Systems; Abo Akademi University ISBN 951-650-624-0, ISSN 0358-5654 ˚Abo. Friedman T.(2005): The World is Flat, Farrar, Straus and Giroux.
Gerhard Koenig, Jochen Schiewe (2006): E-learning courses for GIS and remote sensing in Germany status and perspectives; international Archives of the Photogrammetry, Remote Sensing and Spatial Information Science, Volume XXXVI, Part 6, Tokyo Japan.
Vyas Anjana and Koenig Gerhard (2014): Computer aided Teaching in Photogrammetry Remote Sensing and Geomatics– A Status Review; The International Archives of the Photogrammetry, Remote Sensing and Spatial Information Sciences, Volume XL-6, pp 113-118.
Ghirardini Beatrice (2011): E-learning methodologies a guide for designing and developing e-learning courses, FAO, Viale delle Terme di Caracalla, 00153 Rome, Italy.
Figure 4: ANFIS Impact Matrix