DOES COIMBRA NEED A 3D CADASTRE? PROTOTYPING A CROWDSOURCING APP
AS A FIRST STEP TO FINDING OUT
C. Ellula,c∗, J.P. de Almeidab,c, R. Romanob a
Department of Civil, Environmental and Geomatic Engineering, University College London, UK - [email protected] bGeomatic Engineering Lab., Dept. of Mathematics, University of Coimbra,Portugal
c
Institute for Systems Engineering & Computers (INESCC), Coimbra, Portugal
ICWG
KEY WORDS:3D Cadastre, App Development, Usability, HTML5, 3D sketches
ABSTRACT:
The Municipality of Coimbra in Portugal, and indeed the country as a whole, is currently undergoing a long-term land registration (cadastre creation) exercise, with approximately 50% of the country having been surveyed, amounting to 1/3 of the total properties, by the end of 2013. The survey process is currently generating two-dimensional (2D) maps. However, as with many other countries, these maps have limitations when representing the real three-dimensional (3D) complexities of land and property ownership. Capturing 2D cadastre is an expensive process, and does not provide the required insight into the number of properties where the ownership situation is inadequately represented, as the survey does not include the internal building structure. Having information about the extent of the 2D/3D issue is, however, fundamental to making a decision as to whether to invest resources in even more expensive 3D survey. Given that the 3D complexity inside buildings is only known to residents/occupants - thus making crowd sourcing perhaps the only economically feasible approach for its capture - this paper describes the development of a web-based App envisaged for use by the general public to flag different land and property ownership situations. The paper focuses on two aspects of the problem - firstly, identifying an appropriate, clear, set of diagrams depicting the various different ownership situations from which the user can then pick one, and secondly prototyping and user testing an App for multi-platform VGI data capture in absence of direct feedback from the final end users - i.e. the general public.
1. INTRODUCTION
An up-to-date property cadastral system (defined as providing “data on land” and “the basis for legal aspects like ownership as well as fiscal aspects like taxation of land” as well as pro-viding for “data for planning assignments” (Navratil and Frank, 2004) is fundamental for sustainable development and environ-mental protection (Navratil and Frank, 2013, Stoter, 2011, Dale and McLaughlin, 1999). Currently, the majority of property cadas-tral registries use 2D parcels to register these types of informa-tion. However, while in many cases this is sufficient to give clear information about the legal status of real estate, in cases of mul-tiple use of space, with stratified property rights in land, the tra-ditional 2D cadastre can perhaps reflect the spatial information about those rights in the third dimension only in a limited way. With increasing urbanization (the United Nations predicts that 66% of the world’s population will live in urban areas in 2050, growing from a current figure of 54% (Department of Economic and Social Affairs, n.d.)) this situation is only going to get more complex as construction seeks to make best use of vertical and underground space on limited land.
In Portugal, the SiNErGIC system (Presidencia do Coneslho De Minsistros, 2006) which forms the basic of SNIC, the national cadastral information system, has been implemented, based on a 2D mapping approach. The cadastre is, however, far from com-plete due to the laborious and expensive data capture process. While by the end of 2013 more than 50% of the mainland´s ter-ritory had been surveyed, this corresponds to roughly 1/3 of the total number of properties in the country. Additionally, as with most other countries, Portugal faces the urbanization challenges listed above. Previous work (de Almeida et al., 2012) highlights
∗Corresponding author
a number of case studies for the Municipality of Coimbra (the site of the case study described in this paper), illustrating vari-ous complex land ownership / land rights situations where a 2D cadastral system is insufficient to fully model the situation on the ground. However, these cases have been identified from a list of those known to staff at the local Municipality cadastral offices. The full extent of the problem - i.e. 3D situations that cannot be appropriately represented in 2D - is as yet unknown. This lack of information means that it is not possible for the Municipality to evaluate whether the effort and cost of implementing a 3D cadas-tre is warranted and a justifiable use of taxpayer funds, in par-ticular when the additional complexity of a 3D cadastre (Khoo, 2012) is considered.
The full extent 3D complexity inside buildings is only known to their residents/occupants, thus making crowd sourcing (see Sec-tion 2.2) perhaps the only economically feasible approach for its capture. While the crowd cannot be expected to conduct a full cadastral survey, it may be possible to ask them to indicate the location of complex situations and hence to facilitate the Munic-ipality’s understanding of the extent of the problem. This paper describes the development of a web-based App envisaged for use by the general public to flag different land and property owner-ship situations. It focuses on two aspects of the problem - firstly, identifying an appropriate, clear, set of diagrams depicting the various different ownership situations from which the user can then pick one1and secondly describing the hitherto relatively un-reported process of prototyping and usability testing of an App
1
for multi-platform VGI data capture, which contrary to current User-Centered Design guidelines tends to take place in absence of direct feedback from the final end users - i.e. the general pub-lic.
2. LITERATURE REVIEW
2.1 Cadastral Survey in Portual - Current Approaches
Two different databases currently hold information about land ownership in Portugal - the Registo Predial (the land registry database) and Matriz Predial (the inland revenue database). Both of these are text based, with no geo-referenced information, and it is this issue that the current cadastral data capture efforts in Por-tugal seeks to address. The main aim of the cadastral process is straightforward: to put in a single data base information (based on text) currently spread across the two databases, and to com-bine this information in turn with geometry data newly acquired in the field. Thus, the first step in the process, before any field work is done, requires an updating and cross-referncing of the two databases. Data acquisition itself is focussed on the juridi-cal land parcel, and includes parcel marks and boundaries (spa-tial data) along with personal data relating to the property right holder, the nature of the parcel, the property registration identifi-cation, the property tax identification and a parcel number (Juli˜ao et al., 2010). The cadastral system is based on the The interna-tional standard ISO 19152, adapted to Porguguese Cadastral Law (de Almeida et al., 2012).
2.2 Crowd Sourcing and Volunteered Geographical Infor-mation
The growth of the web and the range of interactions has prompted the interest in using widely available GPS-enabled technology to create, assemble, and disseminate geographic information pro-vided privately and voluntarily by everyday citizens, not neces-sarily trained or holding formal qualifications to deal with this sort of data. (Goodchild, 2007) terms this type of data collec-tion as “volunteered geographic informacollec-tion” - VGI - an umbrella term meaning any kind of geographic data that is freely provided by web users. Several authors have explored the potential of VGI in the context of specific applications. VGI can be a fresh source of detailed, update and free geospatial data, and may constitute a strong and inexpensive opportunity for the future development of spatial data infrastructures, with an opportunity for providing increasing data as participation increases (Elwood et al., 2012, Genovese and Roche, 2010, McDougall, 2009); however, VGI is often seen to be insufficiently credited, structured, standard-ized, and quality validated (Flanagin and Metzger, 2008, Haklay, 2010).
2.2.1 Use of VGI in Cadastral Mapping - Existing Case Stud-ies To date, there have been very few studies exploring the use of VGI in the context of cadastral systems, with (Basiouka and Potsiou, 2012) exploring the potential of VGI for cadastral map-ping, and a follow-up paper (Basiouka and Potsiou, 2013) ex-ploring citizen’s motivations for participation. (Clouston, 2012) also explored this issue, noting that opinions ranges from “volun-teers should know what they are doing” as there is an expectation that the information provided will improve the existing cadas-tre to “As long as the VGI data is flagged with key meta data about source, accuracy etc., then in all cases representation of all the cadastre is better than non representation”. A similar study to assess perceptions within land administration teams was car-ried out by (Keenja et al., 2012) with responses reflecting both a top-down (mostly government controlled) and bottom-up (citizen
controlled) approach to capturing and sharing land-related data. Finally (Mclaren, 2012) highlights the very important potential of crowd sourcing in situations where land tenure is not secure -e.g. in slums - proposing a partnership between citizens and land professionals.
2.3 Motivation for Participation and Engagement in VGI Activities
For many VGI applications, it is important as developers to “un-derstand what motivates content contributors, and identify which motivations are associated with high or low levels of contribu-tion” (Nov, 2007) as well as to understand how to best recruit participants to an activity and retain them as active contributors once a study has commenced. Given the impossibility of inter-viewing participants (as they are generally distributed around the world and may not, in many cases, wish to be interviewed) stud-ies attempt to find proxstud-ies as metrics for levels engagement, and frequently use time spent contributing as a proxy for engagement (Nov, 2007, Neis and Zipf, 2012).
More in depth investigations cite “Fun, Ideology, Values, Under-standing, Enhancement, Social, Career, Protective” (Nov, 2007) as motivation for participation, with (Coleman et al., 2009) noting three different groups of contributors to VGI activities - market driven, where the goal is to contribute to a commercial database; social networks - e.g. open street map; civic/governmental - where the contribution supports some act of the concerned citizen - e.g. environmental issues or animal rights. (Coleman et al., 2009) also note that contributors can be complete neophytes right through to expert authorities. (Coleman et al., 2009) list motivations for con-tributions including:
• Altruism contributing purely for the benefit of others with
no promise of gain or improvement of ones own personal situation
• Professional or Personal Interest making a contribution as
part of an existing job, mandate or personal project
• Intellectual Stimulation - improvement of technical skills,
knowledge and experience gained through contributions
• Protection or enhancement of a personal investment where
offering a practical solution to a shared problem offers an immediate payback for participation through shared improve-ment of a common resource
• Social Reward - being part of a larger network or virtual
community
• Enhanced Personal Reputation - providing the opportunity
for registered contributors to develop on-line identities that are respected, trusted and valued
• Provides an Outlet for creative and independent self-expression • Pride of Place where adding information about one’s own
group or community may provide personal satisfaction, or be good for public relations, tourism, economic develop-ment
(Becker et al., 2013) trialled methods including flyers, banners on the sides of mobile vehicles and direct engagement with com-munities having an interest in the topic, concluding that where a dedicated recruitment campaign is in action participation in en-hanced (e.g. via Facebook (Sˆırbu et al., 2015)).
2.4 Ensuring VGI Data Quality
(Goodchild and Li, 2012) distinguished between different meth-ods for geospatial data quality and categorised them as follows (categories reviewed by (Navratil and Frank, 2013)):
• The crowdsourcing approach, based on the principle that
data may be correct if a large group of people agree on it
• The social approach, based on the principle that trusted users
may act as gatekeepers for data entered by other people sup-posedly less qualified
• The geographic approach, based on the principle that the
provided data is compared to existing geographic knowl-edge
In addition to this (Navratil and Frank, 2013) discussed the types of geospatial data potentially used in land administration, and an-alyzed categories above in order to identify the areas where VGI can actually provide reliable contribution. These authors empha-sised the fact that VGI can only provide data on topics where direct observation is sufficiently possible. Indeed, information on invisible facts, such as the ownership of a given property parcel unit, may be provided by a rather limited number of people.
2.5 Usability Testing
User Centered Design (UCD) puts the user at the core of the de-sign process, and usability is an essential part of this. It is defined in ISO 9241-11 (1998) “the extent to which a product can be used by specified users to achieve specified goals with effectiveness, efficiency and satisfaction in a specified context of use”. Char-acteristics of a usable interface include appropriateness recognis-ability, learnrecognis-ability, operrecognis-ability, user error protection, user inter-face aesthetics and accessibility (ISO, 2011). Similarly, (Nielsen, 2012) defines usability of user interfaces by five quality compo-nents which are widely applied in evaluating websites and desk-top PC applications:
• Learnability: the easiness for users to use it without training
beforehand
• Efficiency: the time consuming for uses in performing tasks
once users have learned the system.
• Memorability: how easily can users remember and re-establish
their proficiency in the same system after a period of not us-ing it.
• Errors: the errors (with the severity and reparability) that the
users make when performing tasks
• Satisfaction: the pleasure when using the system
Usability evaluation methods (UEMs) are used to improve usabil-ity by evaluating the interaction of the human with the computer (Gray and Salzman, 1998). Inspection methods such as Heuris-tic Evaluation (HE) and Cognitive Walkthrough (CW) are based on examination the system or interface by evaluators of special-ists. Empirical methods such as User Testing and Co-operation Evaluation are based on real users´experience (Jacobsen, 1999).
CW is a evaluates user interfaces by examining the mental pro-cess of users (Lewis and Rieman, 1993). It simulates a specific users goals and problem-solving process (Nielsen, 1995) in a spe-cific scenario. To perform a CW, an evaluator places him/herself in the role of an end users and analyses the correct sequences
of actions, asking if the users will actually follow these correct actions to achieve their goals (Lewis and Wharton, 1997). HE is a widely-used usability inspection method, where the evalua-tors are asked to comment on an interface design if the interface follows a series of established principles (Nielsen and Molich, 1990), and assesses the whole design of the interface.
User testing or usability testing is the most commonly used em-pirical method (Nielsen, 1995) and involves observing how real users use an interface and what problems they may encounter. Both qualitative and quantitative data can be collected from this method such how long do the users spent on the tasks, how many errors they made and their think-aloud comments on the inter-face. According to (Nielsen, 2000), between five and seven users are sufficient to discover 80% of usability issues.
3. DATA - CREATING DIAGRAMS OF 3D CADASTRAL SITUATIONS
3.1 First sketches
At the outset of the project, an attempt was made to identify the various possible 3D ownership situations that the user of the App may wish to select from. As well as the special cases al-ready identified in previous work (de Almeida et al., 2012), the research team sketched a total of 96 possible configurations of land and property ownership combinations, including four “spe-cial cases” identified in (de Almeida et al., 2012). Figure 1 shows some of these configurations - as can be seen, the key differences between the images either related to the presence or absence of land in front of, to the side of or behind the building, or to the sub-division of ownership within the building. Combinations of these options were sketched out. More complex cases were also included, as shown in Figure 2.
3.2 Refining the sketches - first feedback
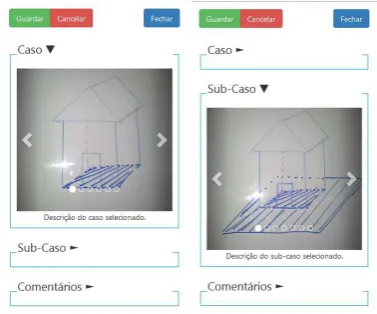
Initial CW tests on the first interface revealed that the number of cadastral cases that the user was being asked to scroll through was excessive, and the interface was redesigned to group the cases into 4 major groups (similar cases were grouped together for sim-plicity) with 4 sub cases in each to allow for the different types of land ownership. Figure 3 shows the results, including a comment option to allow each user to annotate the selected case/sub case.
3.3 Refining the sketches - subsequent feedback
Following discussions with representatives at Coimbra Munici-pality as part of a User Testing process, the original list of Cases and Sub Cases (in total) was deemed to be potentially confus-ing, in particular the distinction between the Sub Cases. Thus, Sub-Cases were replaced with two questions:
• Is the land and the building owned by the same owners?
(Edifcio e terreno do mesmo proprietrio?) - Yes, no, don’t know
• Is there any land surrounding the property? (Com terreno
volta?)
Figure 1: Property and Land Ownership Sketches - Top Left: Different owner for land and building, front and back garden, Top Right: same owner for land and building, no garden, Mid-dle left: same owner for land and building, surrounding garden, Middle right: different owner for land and building, surround-ing garden, Bottom left: different owner for upstairs, downstairs and land, back garden only, Bottom right: different owner for upstairs, downstairs and land, front and back garden
Figure 2: Property and Land Ownership Sketches - Left: Private property built over a public road, Right: Block of apartments, each having a different owner with the land having a different owner, surrounding the property on all sides
Figure 3: Two Tier Property Case Selection, with a comment op-tion
Figure 4: Two Tier Property Case Selection Using Questions (left) and providing Additional Information (right)
4. DEVELOPING THE APP
4.1 Iterative Development - the AGILE Approach
“AGILE project management is a style of project management that focuses on early delivery of business value, continuous im-provement of the projects product and processes, scope flexibil-ity, team input, and delivering well-tested products that reflect customer needs” (Mark, 2012).It involves members of the pro-gramming team carrying out extensive testing as part of every development cycle, regular feedback from end users and short “scrums” that involve all members of the team in planning the next phase of development. Although these principles are gen-erally applied to larger teams and projects than this prototype, two-week development cycles were employed on this project and priorities for development re-examined after each cycle. As one of the team members was based overseas (in London) the “scrum” meetings were held via Skype with screen sharing enabled. A to-tal of eight iterations of the App were developed over a period of four months, with regular feedback from members of the Coim-bra Municipality team, acting as proxies for the target end users. The final version of the system is described here.
4.2 Selecting a Development Environment
(August et al., 2015) note the emergence of a “write once, deploy anywhere” approach to App creation, which is slowly replacing natively written apps specific to a particular phone (e.g. using Java for Google Android). They note that this approach makes such Apps more economical to produce, and in particular note that the increasing capabilities of HTML5 support this process, with the advantage that any changes or bug fixes are automati-cally rolled out when the user loads an App.
Given a requirement to reach a wide audience with the 3D Cadas-tral App, working on multiple platforms, and the fact that no spe-cific device sensors beyond GPS were required, HTML5 was se-lected as the development environment for this project. HTML5 relies very heavily on client-side scripting and makes extensive use of JavaScript for this purpose. Server-side scripting (in this case using PHP) is also required to provide a bridge between the front end (what the user sees) and the database where all the 3D cadastral data is stored, as well as to select and serve the appro-priate images of the 3D cadastral cases to the Apps users. All data is stored in a PostgreSQL/PostGIS database and CSS (Cascading Style Sheets) are used for styling.
4.3 Functional Requirements
A list of functional requirements for the App was generated and modified at each “scrum” review meeting, with the key features as shown in Table 1. In addition, user registration, login and
pass-Functionality Comment Search for a
location
User can type in an address, postcode or coor-dinates to take them to a specific location on the map.
Add a point to the map
In add mode clicking on the map adds a new cadastral case, and allows the user to select the case type and add coments and upload addi-tional documents.
Edit (move) the point
The user can relocate the point and/or change the details of the Case associated with the point Delete the
point
Remove the point and any associated case de-tails from the map
Add a
Comment
Once the 3D Case is selected, the user can add a comment or additional descriptive text to be associated with the Case
Upload a Document
Upload a sketch, photos or PDF including addi-tional information about the Case
Table 1: Functional Requirements
word reminder functions, as well as the opportunity to manage their own data, have been included.
4.4 Final Testing with End Users
As well as the CW tests, and feedback from Municipality team members described in Section 4.1, a final series of tests was car-ried out with a broader user base, as the first part of the process of testing with real end users rather than with Municipality staff as proxies. In this case a ’friends and family’ approach to identi-fying users was taken, with the tests focussing on evaluating App usability, identifying possible errors and usability issues, and ask-ing for further suggestions for improvement. Before actual tests were carried out, volunteer end-user profiles were pre-defined. Only people familiar with and capable of navigating on the In-ternet were considered potential volunteers for testing purposes. Two categories were pre-defined beforehand according to their academic/professional background: GIS experts versus non-GIS experts. A total of 8 volunteers participated in the test process,
6 of them were considered as “non-experts” (Users 1 - 6), and 2 as “experts” (Users 7 and 8). Testing methodology including providing a brief initial summary on the purposes of the research and ultimate aim of the App. However, to ensure that the tests were as close to those within a real VGI context, no details about the App were given at anytime. The volunteer end-user was then invited to create an account and start exploring the App with the objective to check whether the end-user was capable enough of figuring out how to report at least one occurrence of a 3D cadas-tral case. User/App actual interaction was fully recorded, both audio (oral comments) and visual (computer screen).
5. RESULTS
5.1 The Sketches of the Case Studies
Overall, positive results were achieved in terms of users’ under-standing of the sketches presented, with specific comments in-cluding:
• User1: “Great 3D sketches of both common and complex
cadastral cases, however: in terms of a shared property unit, the most common situation is possibly a shop on the ground floor shared by different buildings, not so much a flat; the illustration of the underground creeping freehold should be more generic not necessarily including neighbouring build-ings”
• User 3: “pretty illustrative 3D sketches”
Only 2 of the 8 users didn’t find the “i” button to show additional information, although one did comment that this should be made larger. Another user suggested that the descriptive text should pop up too as the user hovers over the Case title or even over associate picture, and noted that the number of allowed characters in the Comments too limited. A third user acknowledged that implementing all possible common and uncommon 3D cadastral cases is virtually impossible and proposed that this is handled by including an “Other Cases” option.
5.2 The Resulting System
A brief description of the App is presented here, with the App it-self, along with the user guide (in Portuguese) available online.2.
5.2.1 Startup screen and project information On launching the App, the user is given a short description of the project, and can chose to login or create an account (buttons at the top left of the screen). Once logged in, the user is given a menu button which shows additional functionality offered by the App.
5.2.2 User registration, login and lost passwords On launch-ing the App, existlaunch-ing users can log in or ask for a password minder. New users are offered a registration option, which re-quests minimal details (username, e-mail address and a password chosen by the user.
5.2.3 Adding a new case The user follows a 4-step process to add a new case. They first select the Add New icon from the map toolbar (circled in Figure 5 below) and then place the pin on the map. Clicking on the pin brings up the list of possible 3D Cases, and the user can scroll through these and select a case. Finally, additional comments can be added before the data is saved.
2
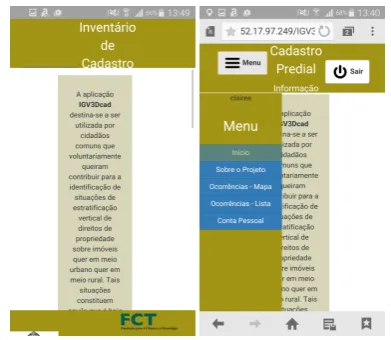
Figure 5: Map view showing existing 3D Cases entered by the user, with Add New button circled
5.2.4 Viewing existing cases One logging in to the system, the user can select to view a map or a list of his/her existing cases. The data can also be edited or deleted by clicking on one of the points on the map.
5.3 Results- Testing on Mobile Device
As described in Section 4.2 above, using HTML5 provides the de-veloper with the opportunity to deploy the resulting App on a di-verse range of devices. However, a number of problems were en-countered when doing this out-of-the-box - in other words, with-out adding mobile-appropriate styling (via CSS) to the HTML used in the App. Figures 6 and 7 below show some of the sit-uations where this worked well and also some of the resulting issues:
Figure 6: HTML5 in Action - Mobile Usage - No/few CSS mod-ification required
Figure 7: HTML5 in Action - CSS Modifications required
5.4 User Testing Results
All users managed to found their way around the App, add an account, pan and zoom around the map as required, and add a new cadastral case to the map. Feedback included the comments below:
• User 1: found it difficult to see at a first glance where the
Editing Tools are and suggested that there should be like a label calling users attention. They also suggested renaming a misleading label in the Editing Tools should be changed: Localizao atual (current location) instead of Posio atual (cur-rent position)
• User2: struggled slightly with account creation, not
real-ising that this was mandatory before adding a point to the map, and also struggled with zoom/pan operations, and for-got to save their edits so lost some data
• User3: also noted that a “save changes” warning should be
given and that going back to a previous stage was difficult, but otherwise found the App very easy to use
• User4: again noted that a warning to save changes before
closing is needed, but stated that overall using this App was very much straightforward and intuitive
• User5: noted that the App was very easy to use, and made
suggestions with regard to the 3D cases
• User6: found placing pins on the map a bit awkward, and
had to log out and in before this would work, and also sug-gested that as some steps were not intuitive a “help” function should be included
• User7: had no issues with the App and again made
com-ments on the 3D cases
• User8: suggested that “Editing tools” should include actual
drawing tools to enable a better indication and dissection of vertical stratification of cadastral occurrences on the 2D map
6. DISCUSSION
The eight users who tested the first released version of this App managed to capture a point on the map and select a related 3D cadastral case from the available list, providing positive and rele-vant feedback on the App itself, in particular given its relatively early stage of development.
6.1 Selecting the Appropriate 3D Case
The initial approach to 3D case selection, while an interesting exercise, could not guarantee that all possible 3D cases were mapped even though it was approached systematically - indeed, generating such a list may only be possible once the App is de-ployed. As shown it also caused issues with the App due to the large number of cases and sub cases generated. The stream-lined approach, combining sketches with additional information, sketching the diagrams, met with positive feedback from the test users, however, although minor changes are required to add an ’other’ case and make the “i” tool more prominent.
6.2 HTML5 as a Universal Development Option
to be customised to different platforms. It is also possible that issues relating to user expectations for behaviour of Apps on dif-ferent devices may require further thought - for example iOS the tab bar always appears at the bottom edge of the screen whereas on Android tabs are placed on a Top Bar just below the Action Bar (Barea et al., 2013).
6.3 Combining Usability and VGI - Evaluating Approaches to App Development
While not implemented to its full extent, the AGILE approach to development -with regular review of requirements - lent itself well to the development of a VGI App within a multi-country team. The consistent feedback given by the eight users who tested the final App - the majority of whom were not mapping experts - also appears to validate the (Nielsen, 2000) assertion that five users are generally sufficient for user testing. Interestingly, un-like most software, there is an expectation in this case that the user will only use the App a few times (even assuming that they have multiple properties), and this issues such aslearnability, effi-ciencyandmemorability(Section 2.5) are not perhaps as relevant as with other Apps. However it could be said that theerrorsand satisfaction(Section 2.5) are still important, as problems encoun-tered will discourage users from recommending the App to their friends and family.
It remains to be seen whether, even though the test results from the eight users were consistent, these were in fact good proxies for the real users of the App, or whether a much wider range of users, with particular focus on those with only basic IT skills, should be employed. Issues relating to the digital divide (with some people having no access to computers or not having the appropriate skills to participate) are very important when consid-ering VGI tools (Sui et al., 2013) and although it can be hypoth-esized that making applications to collect VGI data usable would facilitate uptake of the tools, to date little research has been done in this regard. The difficulty in working with typical end users, who may be remote from the development team, contradicts cur-rent User-Centered Design approaches where there is first hand observation of the users by the development team, and this obser-vation occurs on a regular basis as part of the AGILE approach. Is the approach utilised in this project - where representatives of the client organization (i.e. the group commissioning the App) stood in for the target end users - useful?
6.4 VGI and 3D Cadastral Systems
As mentioned in Section 2.3, in traditional VGI, user engage-ment is measured by the number of times a user repeats an ac-tivity. However, in the case of the 3D Cadastral App described here, the user is only required to engage once with the App, to record their cadastral situation (with multiple use only being re-quired where multiple properties are owned). This may in turn impact motivation for participation with motivations (as listed by (Coleman et al., 2009) includingaltruism, professional interest, intellectual simulationandcreative outletsperhaps taking a back seat toprotection or enhancement of a personal investment. As the information provided is also not shared with the public, due to confidentiality reasonspride of place motivation is also not a factor here. Approaches to participant engagement may also require modification - gamification or working with a specific in-terest group may not be appropriate, whereas channels such as Facebook or flyers or other advertising may have better success. Incentives - for example, a discount on local taxes - may also be considered.
In many VGI applications, the number of contributions is also used as a proxy for data quality, with increasing data quality also
being ascribed to data where a number of users have made ed-its (Haklay et al., 2010). In this case, as users in this case only make one contribution per property, this approach is not feasible. While this may have an impact when Coimbra try to identify the exact number of each specific case present in the Municipality, the fact that some users may not identify their case correctly, or that many may select theother option as they don’t recognise their case in the list provided, may not, in itself, cause an issue when answering the question posed by this research as to thetotal numberof cadastral situations that cannot be represented in 2D, although further validation work will be required to assign a mar-gin of error to the resulting data, via on-site survey of a sample of the captured data. This survey, however, will be far less extensive and expensive than a full indoor survey of every property in the Municipality.
7. CONCLUSION AND FURTHER WORK
The work described in this paper is the first phase of a poten-tially larger project and a number of related avenues remain to be explored, including:
• 3D Sketching Apps - is it possible to make use of mobile
Apps that allow users to create 3D models of indoor space to allow more technically skilled users to upload detailed drawings of their specific 3D cadastral situation?
• Recruitment and Engagement - while theoretical approaches
to encouraging participation have been discussed, it remains to be seen which, if any, of these will work in practice. In particular, will there be resistance on the part of the residents of Coimbra when it comes to providing property informa-tion via an App to the Municipality. Will they trust that this data will not be used for other purposes - e.g. taxation?
• Further App Development and Testing - to encompass a wider
range of users with different skills, and a wider range of desktop, laptop and mobile devices. Understanding the rel-evants of cadastre/land ownership to different age groups is also relelvant. On the technical side frameworks such as Bootstrap3may be useful here
• Research into understanding of 3D sketches - are the sketches
sufficient to enable the user to make a “correct” choice about their situation, do they represent a wide enough range of sit-uations, would users prefer sketches, or more formal dia-grams - e.g. CAD? Would it be simpler to present the user’s with the standard 2D case and then ask them if their case fits this - i.e. a yes/no answer? This research may be better carried out separately from the App testing process, to allow focus on the user understanding of 3D space
• Capturing cadastral rights beyond the building - should/can
the App be extended to capture invisible rights such as those over parking spaces, or situations where a property right does not correspond to the physical building layout?
• The App developed is currently for one-time use to meet
the specific purpose of capturing information on where 3D cadastral survey is required. However, it may also have po-tential utility in terms of educating the general public about the Cadastral system and Cadastral Registration process, per-haps by re-using the data captured on a public web map or making use of the App as part of a broader spatial education / training programme. This will, of course, change the terms of use of the App as the re-use of data for this purpose will need to be clear to those capturing the data.
Many of the above tasks form part of a wider investigation into whether the App can be used without any training, whether video
3
or online training is sufficient or whether formal training would be required. In the case of the latter, the cost of this will need to be weighed against other options for capturing the data - e.g. a door-to-door survey.
Given the positive feedback from Coimbra Municipality, it is en-visaged that this testing will form part of a second phase of the project, and the project team are currently investigating additional sources of funding to take this work forward, perhaps extending it to the fourth dimension, cited by (Khoo, 2012) as a key aim for a 3D Cadastral system.
8. ACKNOWLEDGEMENTS
This project was supported by COMPETE Portugal (project nr. FCOMP-01-0124-FEDER-041587) and FCT Portugal (project ref. EXPL/ATP-EUR/1643/2013).
REFERENCES
Adriaens, T., Sutton-Croft, M., Owen, K., Brosens, D., van Valkenburg, J., Kilbey, D., Groom, Q., Ehmig, C., Th¨urkow, F., Van Hende, P. et al., 2015. Trying to engage the crowd in recording invasive alien species in europe: experiences from two smartphone applications in northwest europe. Manag Biol Invasion 6(2), pp. 215–225.
August, T., Harvey, M., Lightfoot, P., Kilbey, D., Papadopoulos, T. and Jepson, P., 2015. Emerging technologies for biological recording. Bio-logical Journal of the Linnean Society 115(3), pp. 731–749.
Barea, A., Ferre, X. and Villarroel, L., 2013. Android vs. ios interaction design study for a student multiplatform app. In: HCI International 2013-Posters Extended Abstracts, Springer, pp. 8–12.
Basiouka, S. and Potsiou, C., 2012. Vgi in cadastre a greek experiment to investigate the potential of crowd sourcing techniques in cadastral map-ping. Survey Review.
Basiouka, S. and Potsiou, C., 2013. The volunteered geographic infor-mation in cadastre perspectives and citizens motivations over potential participation in mapping. GeoJournal.
Becker, M., Caminiti, S., Fiorella, D., Francis, L., Gravino, P., Haklay, M. M., Hotho, A., Loreto, V., Mueller, J., Ricchiuti, F. et al., 2013. Awareness and learning in participatory noise sensing. PloS one 8(12), pp. e81638.
Brown, G. and Kytt¨a, M., 2014. Key issues and research priorities for public participation GIS (PPGIS): A synthesis based on empirical re-search. Applied Geography 46, pp. 122–136.
Cicali, C., Tria, F., Servedio, V. D., Gravino, P., Loreto, V., Warglien, M. and Paolacci, G., 2011. Experimental tribe: a general platform for web-gaming and social computation. In: Proceedings of NIPS workshop on computational social science and the wisdom of crowds, pp. 1–5. Clouston, A., 2012. Volunteered geographic information in new zealand cadastre.
Coleman, D. J., 2013. Potential contributions and challenges of vgi for conventional topographic base-mapping programs. In: Crowdsourcing Geographic Knowledge, Springer, pp. 245–263.
Coleman, D. J., Georgiadou, Y., Labonte, J. et al., 2009. Volunteered ge-ographic information: The nature and motivation of produsers. Interna-tional Journal of Spatial Data Infrastructures Research 4(1), pp. 332–358. Dale, P. and McLaughlin, J., 1999. Land Administration. Oxford Univer-sity Press.
de Almeida, J., Ellul, C. and Rodrigues-de Carvalho, M., 2012. Towards a Real Estate Registry 3D Model in Portugal: Some Illustrative Case Stud-ies.
Department of Economic and Social Affairs, U. N., n.d. World urbaniza-tion prospects - highlights.
Ellul, C., Gupta, S., Haklay, M. M. and Bryson, K., 2013. A platform for location based app development for citizen science and community mapping. In: Progress in Location-Based Services, Springer, pp. 71–90. Elwood, S., Goodchild, M. F. and Sui, D. Z., 2012. Researching vol-unteered geographic information: Spatial data, geographic research, and new social practice. Annals of the association of American geographers 102(3), pp. 571–590.
Flanagin, A. J. and Metzger, M. J., 2008. The credibility of Volunteered Geographic Information. GeoJournal 72(3-4), pp. 137–148.
Genovese, E. and Roche, S., 2010. Potential of VGI as a resource for SDIs in the North/South context. Geomatica 64(4), pp. 439–450. Goodchild, M., 2007. Citizens as sensors: the world of volunteered ge-ography. GeoJournal 69, pp. 211–21.
Goodchild, M. F. and Li, L., 2012. Assuring the quality of volunteered geographic information. Spatial statistics 1, pp. 110–120.
Gray, W. D. and Salzman, M. C., 1998. Damaged merchandise? a re-view of experiments that compare usability evaluation methods. Human– Computer Interaction 13(3), pp. 203–261.
Haklay, M., 2010. How good is Volunteered Geographical Information? A comparative study of OpenStreetMap and Ordnance Survey datasets. Environment and planning B: Planning and design 37(4), pp. 682–703. Haklay, M., Basiouka, S., Antoniou, V. and Ather, A., 2010. How many volunteers does it take to map an area well? The validity of Linus law to volunteered geographic information. The Cartographic Journal 47(4), pp. 315–322.
ISO, I., 2011. Iec25010: 2011 systems and software engineering–systems and software quality requirements and evaluation (square)–system and software quality models. International Organization for Standardization p. 34.
Jacobsen, N. E., 1999. Usability evaluation methods: the reliability and usage of cognitive walkthrough and usability test. PhD thesis, Department of Communication, Journalism and computer Science, Roskilde Univer-sity.
Juli˜ao, R. P., Roque, C. and Neto, J. P., 2010. Sinergic: A visi´on for cadastre. In: Catastro: formaci´on, investigaci´on y empresa: Selecci´on de ponencias del I Congreso Internacional sobre catastro unificado y multi-prop´osito, pp. 735–746.
Keenja, E., De Vries, W., Bennett, R. and Laarakker, P., 2012. Crowd sourcing for land administration: Perceptions within netherlands kadaster.
Khoo, V., 2012. Towards smart cadastre that supports 3d parcels. In: 3rd International Workshop on 3D Cadastres: Developments and Practices. Lane, N. D., Miluzzo, E., Lu, H., Peebles, D., Choudhury, T. and Camp-bell, A. T., 2010. A survey of mobile phone sensing. Communications Magazine, IEEE 48(9), pp. 140–150.
Lewis, C. and Rieman, J., 1993. Task-centered user interface design. A Practical Introductio.
Lewis, C. and Wharton, C., 1997. Cognitive walkthroughs. Handbook of human-computer interaction 2, pp. 717–732.
Mark, L., 2012. Agile Project Management For Dummies. Wiley. McDougall, K., 2009. The potential of citizen volunteered spatial infor-mation for building SDI.
Mclaren, R., 2012. Crowdsourcing support of land administration a part-nership approach. Proceedings of Global Geospatial Conference. Murphy, R. J., 2015. Facilitating Citizen Science Through Gamification. PhD thesis, Memorial University of Newfoundland.
Navratil, G. and Frank, A., 2013. Vgi for land administration a qual-ity perspective. InternationalArchives of the Photogrammetry, Remote Sensing and Spatial Information Sciences XL-2/W1, pp. 159–163. Navratil, G. and Frank, A. U., 2004. Processes in a cadastre. Computers, Environment and Urban Systems 28(5), pp. 471–486.
Neis, P. and Zipf, A., 2012. Analyzing the contributor activity of a volun-teered geographic information projectThe case of OpenStreetMap. ISPRS International Journal of Geo-Information 1(2), pp. 146–165.
Nielsen, J., 1995. Severity ratings for usability problems. Papers and Essays.
Nielsen, J., 2000. Why you only need to test with 5 users. Nielsen, J., 2012. Usability 101: Introduction to usability.
Nielsen, J. and Molich, R., 1990. Heuristic evaluation of user interfaces. In: Proceedings of the SIGCHI conference on Human factors in comput-ing systems, ACM, pp. 249–256.
Nov, O., 2007. What motivates wikipedians? Communications of the ACM 50(11), pp. 60–64.
Presidencia do Coneslho De Minsistros, 2006. Resoluo do conselho de ministros nr. 45. dirio da repblica portuguesa, srie i-b, nr. 86, 4 de maio. Reddy, S., Estrin, D. and Srivastava, M., 2010. Recruitment frame-work for participatory sensing data collections. In: Pervasive Computing, Springer, pp. 138–155.
Sˆırbu, A., Becker, M., Caminiti, S., De Baets, B., Elen, B., Francis, L., Gravino, P., Hotho, A., Ingarra, S., Loreto, V. et al., 2015. Participatory patterns in an international air quality monitoring initiative. PLOS one 10(8), pp. e0136763.
Stoter, J., 2011. Geoprofessionals should look outside their own box. GIM International.