ACCURACY OF CULTURAL HERITAGE 3D MODELS BY RPAS AND TERRESTRIAL
PHOTOGRAMMETRY
M. Bolognesi a,*, A. Furini a, V. Russob, A. Pellegrinelli a, P. Russo a
a
Engineering Department, University of Ferrara, Via Saragat 1, 44122, Ferrara, Italy (marcello.bolognesi, alessio.furini, alberto.pellegrinelli, paolo.russo) @unife.it,
Commission V, WG V/2
KEY WORDS: Multi-image photogrammetry, RPAS (UAV), Digital Model, Accuracy, Structure from Motion
ABSTRACT:
The combined use of high-resolution digital images taken from ground as well as from RPAS (Remotely Piloted Aircraft Systems) have significantly increased the potential of close range digital photogrammetry applications in Cultural Heritage surveying and modeling. It is in fact possible, thanks to SfM (Structure from Motion), to simultaneously process great numbers of aerial and terrestrial images for the production of a dense point cloud of an object. In order to analyze the accuracy of results, we started numerous tests based on the comparison between 3D digital models of a monumental complex realized by the integration of aerial and terrestrial photogrammetry and an accurate TLS (Terrestrial Laser Scanner) reference model of the same object.
A lot of digital images of a renaissance castle, assumed as test site, have been taken both by ground level and by RPAS at different distances and flight altitudes and with different flight patterns. As first step of the experimentation, the images were previously processed with Agisoft PhotoScan, one of the most popular photogrammetric software. The comparison between the photogrammetric DSM of the monument and a TLS reference one was carried out by evaluating the average deviation between the points belonging to the two entities, both globally and locally, on individual façades and architectural elements (sections and particular). In this paper the results of the first test are presented. A good agreement between photogrammetric and TLS digital models of the castle is pointed out.
* Corresponding author.
1. INTRODUCTION
Digital Photogrammetry has made many advances in recent years. The combined use of high-resolution digital images, Computer Vision codes and new image acquisition systems, like RPAS (Remotely Piloted Aircraft Systems), have significantly increased the potential of the technique. With regard to close range photogrammetry and its application to cultural heritage survey, a significant progress is mainly due to the development of image processing codes (SfM) which automatically realize object point cloud by a simultaneous elaboration of large number of images, taken at any scale and orientation, with even not calibrated cameras (Fonstad et al, 2013; Green et al, 2014). In the meantime RPAS systems have undergone a rapid evolution with particular regard to micro-RPAS (Nex and Remondino, 2014; Turner et al, 2012; Mancini et al, 2013), opening the way to the integration of aerial and terrestrial close range images. In this way, it is now possible to create accurate digital models of entire buildings, including the roof and the parts inaccessible to the scanner (Hashim et al, 2012).
The question arises spontaneously, how far a photogrammetric survey based on such integrated approach (Koutsoudis et al, 2014) is reliable and accurate? And again, is it possible to define a procedure that yields the best results in terms of accuracy, optimizing the duration of acquisition and processing images? The solution of the problem is complicated, since the accuracy of the results depends on many factors as, for example, the optical and digital performances of the camera, the spatial distribution, scale, overlapping and orientation of the images, the photogrammetric processing code and the setting of its parameters, etc.
To answer these questions we started with an important experimental measurements campaign. Our intention is to obtain several models by varying the RPAS flight altitude (50; 100; 150 meters), the inclination of the camera optical axis (vertical as well as 45°), the position of ground level images, the number and location of GCPs. Various Photogrammetric codes will be employed for processing the same set of images and GCPs. Each model will be then compared with the reference one in order to determine random and systematic discrepancies. The aim of the research is to point out the optimal solutions either for an object strongly 3D (like a monument) or for a flat surface like the ground that surrounds it.
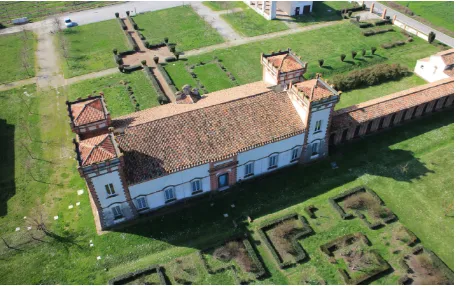
Figure 1. The test site: the “Delizia del Verginese” Castle (XVth century)
The monument selected for the tests is the “Delizia Estense del Verginese” (Fig. 1), a renaissance castle located in the province
of Ferrara (Italy) already used in the past for assessing the accuracy of early TLS applications in cultural heritage surveys (Balzani et al., 2001).
It is an ideal test-site for its historical and cultural importance, and for the possibility to survey it easily with different techniques. The Castle, including the surrounding area, was initially surveyed with TLS in order to create a geometrical model as accurate as possible. After that, many digital images were taken both by ground level and by RPAS at different distances from the building, varying flight altitudes and patterns.
In this paper we present the results of the first step of the experimentation, which was carried out in order to define the methodological process of the research. For this purpose a large number of images have been processed with one of the most popular photogrammetric software, Agisoft PhotoScan, so as to realize different digital models of the “Delizia”. The comparison among the photogrammetric DSM and the reference one was carried out by evaluating the deviations between the points belonging to the two entities, both globally, in the whole model, and locally, on individual façades and architectural elements (sections and particular).
2. THE REFERENCE MODEL OF THE CASTLE
In order to estimate the accuracy of the photogrammetric survey it is necessary to have a high accurate reference model of the castle. For this purpose the first step of the research was the set up and the survey of a small geodetic 3D network in order to realize an absolute coordinate system for georeferencing all the phases of the test in the same frame. The network is made up of 11 vertices located around the Castle and in the surrounding monumental area (Fig. 2). The survey was carried out by static GNSS surveying and high accuracy digital leveling. All measurements were adjusted by least square method, obtaining local residues less than one centimeter.
Figure 2. The 3D reference network
Subsequently, it was made an accurate TLS survey by a Leica C10 laser scanner with a sampling grid of 0,10 m at 100 m away. The model of the castle was realized by several point clouds registered in the absolute reference system (Fig. 3).
Figure 3. The TLS point cloud model of the Castle
Moreover 96 horizontal and vertical control points divided equally between the four sides of the castle were surveyed by total station (Fig. 4).
Figure 4. Location of control points on the main façade of the Castle
3. THE PHOTOGRAMMETRIC SURVEY
The integration between aerial (from RPAS) and terrestrial photogrammetry is one of the key points of this research. The digital images can be divided into three major groups: aerial images taken with vertical and inclined camera optical axis and terrestrial ones.
3.1 Aerial photogrammetry
The platform used for the data acquisition is a small RPAS model like DJI S800 (Fig. 5) equipped with a digital camera CANON EOS M with a 18 megapixels CMOS sensor of 22,3 x 14,9 mm and a focal length of 18 mm.
Figure 5. The RPAS flying over the castle.
To get a GSD compatible with the sampling grid of the scanner the drone has flown at an altitude of 50 meters above the ground so as to have a pixel size of about 11 mm (Fig. 6). Images were taken with a 80% longitudinal overlapping rate (Fig. 7) in order to be able to select datasets with overlapping ranging from 40% to 80%. As lateral overlapping instead a fixed value of 60% was applied.
Figure 6. Example of RPAS digital images.
Figure 7. Flight plan and camera positions.
In total 130 frames were acquired corresponding to a surveyed surface of about 3300 m2. In order to take also images with inclined camera optical axis it was planned a flight following a path around the castle. In this way a total of other 170 frames were acquired (Fig. 8).
Figure 8. Camera positions of inclined camera axis survey.
3.2 Terrestrial photogrammetry
The camera used for this survey was a CANON EOS 7D with a 18 megapixels CMOS sensor of 22.3 x14, 9 mm and a Canon EF 35mm f/1.4L USM lens.
The images were acquired for any façade at a distance of about 6-7 meters from it, with a an average overlapping of 80%. An example of the layout of the camera positions is showed in figure 9.
Figure 9. Camera positions for the survey of the front façade.
4. DATA PROCESSING AND RESULTS
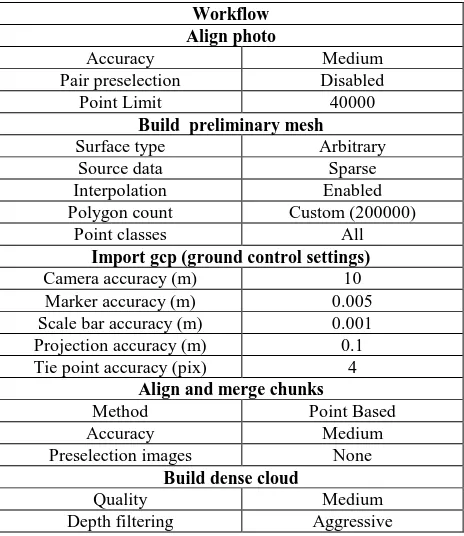
Given the large number of digital images to be used for data processing, it was decided to reduce the number of at least aerial images, so as to optimize the computational time for the same accuracy of the geometrical model. The percentage of overlapping of nadir images was the selection criterion. For this purpose some preliminary tests were performed. The default parameters and the procedure used are listed in Table 1.
Workflow Align photo
Accuracy Medium
Pair preselection Disabled
Point Limit 40000
Build preliminary mesh
Surface type Arbitrary
Source data Sparse
Interpolation Enabled
Polygon count Custom (200000)
Point classes All
Import gcp (ground control settings)
Camera accuracy (m) 10
Marker accuracy (m) 0.005
Scale bar accuracy (m) 0.001 Projection accuracy (m) 0.1 Tie point accuracy (pix) 4
Align and merge chunks
Method Point Based
Accuracy Medium
Preselection images None
Build dense cloud
Quality Medium
Depth filtering Aggressive
Table 1. Parameters and workflow used in Agisoft PhotoScan
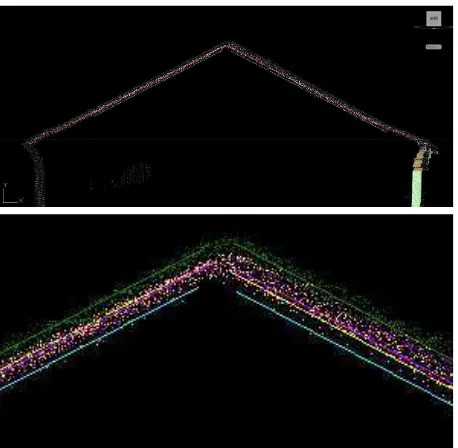
Three different data sets were selected, which correspond respectively to a 80%, 60% and 40% overlapping of the aerial images. The point clouds were realized by a separate processing of the data sets. Each point cloud was compared with the TLS one, by examining 5 cross sections on the roof of the building (Fig. 10 and Tab. 2 ).
Figure 10. Comparison between the point clouds of the castle roof from TLS and from RPAS photogrammetry. In the enlarged detail of the cross section (section 2), the cyan line fits
the TLS cloud, while the green, yellow and violet ones fit respectively the photogrammetric clouds from 40%, 80% 60%
datasets.
Table 2. Average deviations of the component along z axis of the photogrammetric point clouds from the reference TLS one.
Even if comparable residues (2-3 cm) were obtained in the orientation procedure of the different aerial image data sets, there’s a remarkable difference among their average deviations from TLS data. The 40% overlapping data set was rejected because of its higher deviation. Moreover noting that the difference between 80% and 60% presents a very small average value, equal to 0.0059 m, we decided to use the dataset datasets, distinguishing them between aerial and terrestrial ones. Therefore six different models were created using images from RPAS (model 1 and 2) and from ground level (model 3,4,5,6). Each of them was oriented in the same reference system, on the basis of the GCPs. In particular the model M1 regards to the roof of the castle, while the models M2 to M6 regard mainly the façades. In table 3 for each model is reported the number of images processed (Cam), the number of GCPs used and the residual errors obtained at the end of the orientation procedure.
Model Dataset
Figure 11. Point cloud obtained from model M3: front façade of the castle.
Considering the M3 model (fig. 11), we can observe that the point cloud is slightly noisy, especially in areas such as land and sky. The castle walls are instead well defined, with higher resolution, as is evident from Figure 12 and 13.
Figure 12. A detail of the points cloud of M3 model.
Figure 13. Enlarge view of the detail in figure 12.
Unfortunately, leaving out the GCPs, the control points are not in sufficient number to make a statistically meaningful analysis. Therefore we only report in Table 4 a simple comparison between total station and photogrammetry survey.
CP ∆East (m) ∆North (m) ∆Height (m)
M3 24 0.016 0.021 0.011
M4 2 0.024 0.020 0.014
M5 31 0.024 0.017 0.013
M6 5 0.017 0.008 0.010
Table 4. Averages of the absolute values of the differences between the coordinates of the Control points determined by total station and those obtained by photogrammetry.
A more reliable result is obtained by comparing the photogrammetric point cloud of each façade with the corresponding TLS one. For example, for the front side (model M3), we selected about 130 natural points clearly visible on both clouds and computed the differences of their coordinates. The sample data is sufficiently large to perform a statistical treatment of results ( Fig. 14, 15, 16, 17).
Figure 14. Frequency histogram of the deviations in East component of natural control points positions.
Figure 15. Frequency histogram of the deviations in North component of natural control points positions.
Figure 16. Frequency histogram of the height deviations of natural control points positions
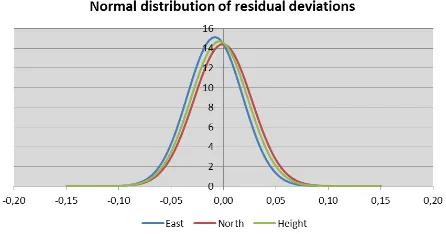
The mean and standard deviation for each discrepancy component, assuming that the data have a normal distribution, are reported in table 5.
∆East (m) ∆North (m) ∆Height (m)
Mean -0,004 -0,019 -0,002
St.Deviation 0,027 0,024 0,017
Table 5. Average coordinates differences between points from TLS and photogrammetric models and their standard deviations.
Figure 17. Normal distributions of coordinate deviations between points from TLS and photogrammetric models.
4.2 Merged dataset point cloud.
To create a unique model of the castle were processed all the images, those obtained from RPAS as well as those taken from ground. Images present varying scale and overlapping, parallel or converging axes, and different cameras used. A total of 494 images were used and 28 GCPs.
The software allows to align the partial models using external orientation parameters, markers, or tie points.
The orientation results of the unique model is listed in table 6.
Cam GCPs Error(m) Error(pix) Unique
model 494 28 0.018 0.689
Table 6. Cameras, GCPs and residual error of GCPs estimated by PhotoScan for the entire model.
Then all images were processed to obtain a single point cloud, using the default settings of the modeler listed in Table 1. The final model produced by the software is shown in Figure 17 and 18 without any review work on our part.
Figure 18. Front view of the final model.
Figure 19. Back view of the final model.
The model, from a qualitative point of view, is definitely complete in all its parts, even if the cloud is slightly noisier of the preceding especially in dense areas of architectural details. It's interesting to note that the software automatically reduces the sampling step especially if we compare the clouds obtained from single façades (Fig.19).
Figure 20. The images above show the difference between the point cloud of model M3 (on the left) and the one obtained from the unique model (on the right). The comparison shows the higher definition of the first one.
Some control points were rejected, particularly those located in the vicinity of the battlements of the towers, where the cloud has errors too high.
With regard to the accuracy, the results are described in figure 21, 22, 23, 24 and summarized in table 7 and 8.
CP ∆East (m) ∆North (m) ∆Height (m) Unique
model 46 0.0225 0.0217 0.0221
Table 7. Average of the absolute values of the differences between the coordinates of the control points obtained with the total station and those obtained by photogrammetry.
Figure 21. Frequency histogram of the deviations in East component of natural control points positions.
Figure 22. Frequency histogram of the deviations in North component of natural control points positions.
Figure 23. Frequency histogram of the height deviations of natural control points positions.
Figure 24. Normal distributions of coordinate deviations between points from TLS and photogrammetric models.
∆East (m) ∆North (m) ∆Height (m)
Mean -0,0082 -0,0007 -0,0040
St.Deviation 0,0264 0,0277 0,0271
Table 8. Average coordinates differences between points of TLS and photogrammetric models and standard deviation.
With regard to the expected results, some perplexity remains on both the sampling step, worsened by the addition of photos, and
the lower quality of the detail. Exhaustive investigations will be carried out in the future so as to definitely understand the real reason for this behavior and if possible improve it.
It must be underlined the fact that all of the models obtained until now have been processed according to the standards of the software, that is, leaving unchanged the default parameters. By analyzing some of the details of the models created, even if only from a purely qualitative point of view (Fig. 25), one can observe how the differences have an impact in the form of noise, making it sometimes difficult the vectorization of sections, prospects and architectural elements.
Figure 25. Profiles of the same architectural detail obtained from three different point clouds. Left one comes from the TLS, the middle one from the unique model, and the right from the M3 model.
In the first image (TLS) the profile of an architectural element is well-defined, while the quality decreases by using the point cloud obtained by photogrammetry. There are instead other parts of the building in which such problems do not occur: on the roof, smooth walls or on the ground. The cloud is in such areas are similar to that one from the scanner.
5. CONCLUSIONS also using images take from RPAS flying at 50 meters away. As regards the design of the optimal mode for taking digital images from RPAS and from ground, in relation to the software used for processing data, the test is far from being complete, but it is useful to develop the methodology of the investigation on the factors affecting the accuracy of the results.
Numerous tests are still to be made. Changing such as software, parameters and algorithms, strategy orientation, distances grip etc etc ... we could probably get to answer the questions we posed.
ACKNOWLEDGEMENTS
The authors would like to thank Ing. Francesca Ferrari for her help in surveying, data processing and analysis.
REFERENCES
Balzani, M., Pellegrinelli, A., Perfetti, N., Uccelli, F., 2001. A terrestrial 3D laser scanner: accuracy tests. In: Proceedings
ISPRS Arcchives – Vol. XXXIV-5/C7, XVIII CIPA Symposium, Postdam 2001, pp. 445-453.
Green, S., Bevan A., Shapland, M., 2014. A comparative assessment of structure from motion methods for archaeological research. Journal of Archaeological Science, 46, pp. 173-181.
Fonstad, M. A., Dietrich, J., T., Courville, B. C., Jensen, J. L., Carbonneau P. E., 2013. Topographic structure from motion: a new development in photogrammetric measurement. Eart. Surf.
Process. Landforms, 38, pp. 421-430.
Hashim, K. A., Ahmad, A., Samad, Abd. M., Nizam Tahar, K., Udin, W. S., 2012. Integration of low altitude aerial & terrestrial photogrammetry data in 3D heritage building modelling. In: Proceedings – 2012 IEEE Control and System
Graduate Research Colloquium, ICSGRC, Shah Alam,
Malaysia, Article number 6287166, pp. 225-230.
Koutsoudis, A., Vidma, B., Ioannakis, G., Arnaoutoglou, F., Pavlidis, G., Chamzas, C., 2014. Multi-Image 3D reconstruction data evaluation. Journal of Cultural Heritage, 15, pp. 73-79.
Mancini, F., Dubbini, M., Gattelli, M., Stecchi, F., Fabbri, S., Gabbianelli, G., 2013. Using unmanned aerial vehicles (UAV) for high-resolution reconstruction of topography: the structure from motion approach on coastal environments. Remote
Sensing, 5 (12), pp. 6880-6898.
Nex, F., Remondino, F., 2014. UAV for 3D mapping applications: A review. Applied Geomatics, 6 (1), pp. 1-15.
Turner, D., Lucieer, A., Watson, C., 2012. An automated technique for generating georectified mosaics from ultra-high resolution Unmanned Aerial Vehicle (UAV) imagery, based on Structure from Motion (SFM) point clouds. Remote Sensing, 4 (5), pp. 1392-1410.