www.elsevier.comrlocateratmos
Fine scale spatial variations in wet deposition
D.W.F. Inglis
), T.W. Choularton
Department of Physics, Institute of Science and Technology, UniÕersity of Manchester, P.O. Box 88,
Manchester, M60 1QD, UK
Received 15 December 1999; received in revised form 10 July 2000; accepted 25 July 2000
Abstract
Results are presented from an experiment designed to investigate the processes that cause
Ž .
small-scale sub-20 km variations in wet deposition to upland terrain in the UK. Bulk rain and orographic cloud collections were made at a network of sites of typical separation 1–3 km.
Detailed analysis of two frontal rain events that occurred in westerly and southwesterly flows was aided by the use of a computer model of wet deposition. The accuracy of model predictions of inter-site variations of rain amount and ion deposition in rain is supported by the data except in the lee of higher terrain. This suggests that the model realistically simulates most of the important physical processes which cause fine scale spatial variation in wet deposition. The role of the upstream temperature profile in modifying the deposition through its effect on the position and properties of the orographic cloud is considered. Again, the data support the predictions of the model.q2000 Elsevier Science B.V. All rights reserved.
Keywords: Wet deposition; Orographic rainfall; Seeder–feeder effect; Sub-grid scale variations
1. Introduction
In mountainous terrain, the formation of orographic cap clouds is common. Cloud droplets are efficiently scavenged by rain falling from aloft and are deposited to the
Ž . surface. This is the seeder–feeder effect, first described by Bader and Roach 1977 . The cap clouds often contain high concentrations of dissolved ions and thus, the wet deposition of ions to the surface can be enhanced. This was first discussed by Carruthers
Ž . Ž .
and Choularton 1984 . Experiments in Cumbria by Fowler et al. 1988 , Choularton et
)Corresponding author.
0169-8095r00r$ - see front matterq2000 Elsevier Science B.V. All rights reserved.
Ž .
( ) D.W.F. Inglis, T.W. ChoulartonrAtmospheric Research 55 2000 139–157 140
Ž . Ž .
al. 1988 and Dore et al. 1992a observed and quantified the enhancement. These experiments lead to the adoption of a simple scheme to predict and map orographic
Ž .
enhancement nationally Dore et al., 1992b; RGAR, 1990 . The central assumption was that the concentration of ions in the scavenged water is on average twice that in the
Ž
unperturbed rain. More recent experiments have observed single rain events Inglis et
. Ž
al., 1995a,b and monitored rain and orographic cloud over long time scales Fowler et .
al., 1995 . This work has confirmed the dominance of the scavenging process in determining deposition to upland terrain and verified the simple mapping scheme ŽRGAR, 1997 ..
However, the parameterisation only predicts average deposition to large grid squares
Ž .
of terrain 20=20 km . Sub-grid scale variation is important in terms of damage to soils and ecosystems which typically have characteristics which vary on length scales which are considerably smaller than 20 km. Ultimately, the aim is to improve the resolution of wet deposition predictions to length scales close to 1 km. They can then be directly compared to critical load calculations that are carried out on a length scale similar to that
Ž .
of the current soil type and land use maps CLAG, 1994 . Ž .
Raper and Lee 1996 made weekly collections of rain from a network of 10 sites in the south Pennines for 1 year. Sub-grid scale variations were observed in the average concentrations of calcium, hydrogen, and sulphate.
Here, we report results from an experiment specifically designed to address the mechanisms that cause sub-grid scale variation in wet deposition to upland terrain. The terrain and site separation are selected to allow the detailed evolution of wet deposition processes to be observed as the boundary layer encounters an extended region of elevated terrain. The monitoring equipment deployed is simple, but full consideration of associated uncertainties is made and carried through to comparison to computer simula-tions allowing firm conclusions to be reached.
2. The field experiment: Saddleworth Moor, 1993
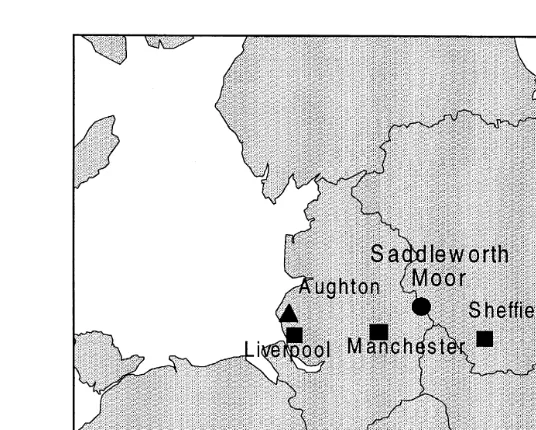
The experiment was carried out in October and November 1993. The location of Saddleworth Moor in the south Pennines is shown in Fig. 1.
The bulk rain collectors are simple funnels mounted in boxes 1.5 m above the Ž .
surface, following the original design of May 1961 . The cloud collectors also support Ž .
an array of vertically mounted polytetrofloromethane PTFE strings following the
Ž . Ž .
design of Dollard et al. 1983 and May 1961 . Cloud droplets impact onto the strings and run down to be collected by the funnel in the same manner as rain. Samples are
Ž .
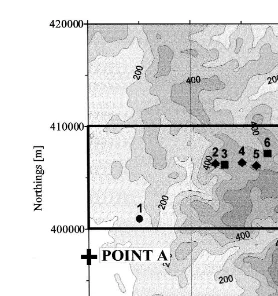
refrigerated until analysis in duplicate for all the major ions using an ion chromatogra-phy technique. Fig. 2 shows the configuration of the collector sites and the distribution of monitoring equipment.
The collection efficiency of a rain collector is expected to depend on wind speed.
Ž .
Fig. 1. Map of northern England showing the position of Saddleworth Moor, regional boundaries, major cities and the radio-sonde launch site at Aughton.
here. Average wind speeds at 0.2 m are less than 40% of that at 1.4 m, yet, the total rain amount agreed to within 2%. Despite this, on occasions when the wind speed is high or the average drop size is low, the collection efficiency may be reduced. However, all moorland sites are at a similar altitude and were selected to be far from small surface features on the moor. Differences in the wind speed between moorland sites are therefore expected to be small. Computer modelling of the surface speed during the two events considered confirmed this. It follows that observed differences in deposition between these sites are unlikely to be a result of differences in collection efficiency.
The main function of the cloud collectors is to provide information on the ionic material dissolved in the orographic feeder cloud, i.e. the mass of ions dissolved per unit volume of cloudy air. To do this, some considerations of the sampling characteristics of the cloud collectors are necessary. The simple design of the collectors means that they sample both rain and cloud. The collection efficiency for rain was assessed over the same 2-year period, again at site 9, by isolating periods when rain but not cloud occurred. During these periods, the volume sampled by the cloud collector averaged 97% of that sampled by an adjacent tipping bucket rain collector. According to this result, all data presented as representing cloud in this work, have been arithmetically adjusted to remove the fraction of the sample resulting from rain. This process introduces the dominant uncertainty in the calculation for cloud loading. The uncertainty depends on the observed fractions of rain and cloud.
( ) D.W.F. Inglis, T.W. ChoulartonrAtmospheric Research 55 2000 139–157 142
Fig. 2. Contour map showing position of collector sites on Saddleworth Moor.B, Rain collector only;l, rain and cloud collector;', rain and cloud collector and AWS; andv, rain collector and AWS.
important. In addition, the volume of rain in each event was large enough for liquid left on the funnel and not collected to be insignificant.
3. Computer simulations of wet deposition
The three-dimensional rainfall model, Rainstar is described by Dore and Choularton Ž1992 and is based on the model of Carruthers and Choularton 1983 . Terrain heights. Ž . and roughness lengths are input on a rectangular grid of 64=64 elements. Model output can be accessed at any grid point. The boundary layer is treated as eight horizontal
Ž layers that flow over the terrain as dictated by a computational airflow model
Car-.
ruthers and Hunt, 1990 . In the discussion that follows, the layer closest to the surface is referred to as layer 1.
speed and direction. Orographic cloud may condense or evaporate in any layer according to adiabatic temperature changes as it flows over the terrain.
Raindrops at the top of the model grid can also contain dissolved ions corresponding to observations of unperturbed rain. As they fall through the layers, they are subject to growth by accretion with cloud drops, evaporation in cloud-free layers and horizontal drift. The number and size of raindrops are defined by the rainfall rate and the assumed
Ž .
drop size distribution Marshall and Palmer, 1948 . Ionic deposition to a point at the surface is the sum of the dissolved ions in all drops arriving at that position.
3.1. Rain eÕent 3
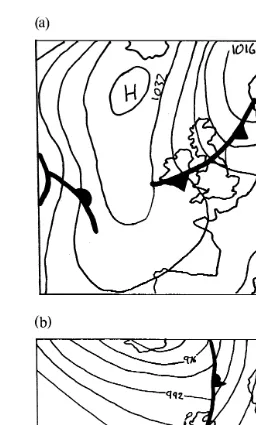
Rain event 3 occurred between 12:00 and 20:00 GMT on 20 October 1993. Fig. 3a shows the synoptic situation at 12:00 GMT. The rain is associated with a cold front that lies over southern Ireland, north Wales and northern England. Moderate precipitation resulted in approximately 3 mm of rain at lowland sites close to Saddleworth Moor.
3.1.1. Model input parameters
We are primarily interested in ions of anthropogenic origin of which the most important include nitrate and sulphate. We choose to examine nitrate since its primary
Ž .
source motor vehicles is more widely distributed than for sulphate, making a homoge-neous input to the domain, as assumed by the model more likely.
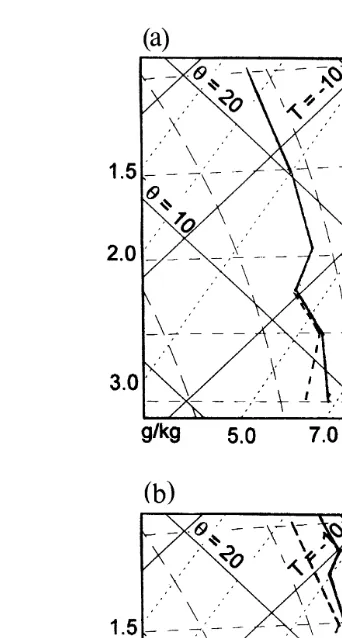
3.1.1.1. Vertical temperature and waterÕapour profiles. We take the radio-sonde profile
Ž .
recorded at Aughton at 12:00 GMT Fig. 4a as being representative of the boundary layer structure during the rain event. The temperature throughout the sounding closely follows the saturated adiabatic curve. There is a layer between 850 and 900 mb in which mechanical lifting would result in the release of potential instability. However, this layer is not considered deep enough to result in any convective rainfall. Throughout the sounding, deviations from saturation and the saturated adiabatic curve are such that buoyancy forces acting on mechanically lifted air would be very small. Under these circumstances, we consider it most appropriate to assume the boundary layer tempera-ture profile to be neutral. The model domain reaches to an altitude of 1500 m above the surface.
The freezing level is at 850 mb. However, for this case, simulations show that over 90% of precipitation enhancement occurs below this level. It is therefore unnecessary to consider the ice phase in the simulation.
3.1.1.2. Nitrate loading of the orographic cloud. Of all model input parameters, the
ionic loading of the cloud is the most difficult to assess accurately. We consider the method described below to represent the best estimate possible. The uncertainty associated with the loading dominates uncertainty in the model output.
( ) D.W.F. Inglis, T.W. ChoulartonrAtmospheric Research 55 2000 139–157 144
Ž . Ž . Ž .
Fig. 3. a Surface chart for 12:00 GMT on 20 October 1993 rain event 3 . b Surface chart for 12:00 GMT
Ž .
on 9 November 1993 rain event 8 .
to be 97"30% as estimated in Section 2. This introduces the dominant source of uncertainty into the calculation of cloud loading. Estimates of the range of possible model output are based on the forward propagation of this uncertainty.
Ž . Ž . Ž .
Fig. 4. a Radio-sonde ascent data from Aughton on 20 October 1993 at 12:00 GMT rain event 3 . b
Ž .
Radio-sonde ascent data from Aughton on 9 November 1993 at 18:00 GMT rain event 8 .
surface at site 2 to be 0.33 g my3. This is achieved by initialising the model with the observed water vapour profile as described above. We are confident in this value since the model also correctly simulates the relative humidity at site 1 to be 90%. The cloud loading can now be calculated as 2.9"0.8mg NO m3 y3.
Direct chemical observations of the boundary layer upstream of cloud formation would certainly have added valuable information to this estimate for the model input. However, the method applied here does have the advantage of directly reflecting the ionic content of the orographic cloud that is available for scavenging rather than its precursors. Having fully considered the uncertainties that arise from our method and having followed these through to the comparison with data, we still consider it possible to reach firm conclusions using this approach.
( ) D.W.F. Inglis, T.W. ChoulartonrAtmospheric Research 55 2000 139–157 146
event, however, cloud layers of less than four oktas are recorded as low as 200 m. In this cloud, it is reasonable to assume that all available nitrate ions are already dissolved in cloud drops and contribute to the concentration of ions in seeder rain through collision and coalescence. When these cloudy layers are lifted orographically, excess water vapour will condense onto the existing cloud drops and scavenging efficiency is affected only marginally. This is in contrast to cloud-free layers where the formation of orographic cloud dramatically increases the scavenging efficiency for material that becomes dissolved in the cloud drops. This means that it is logical to apply the ion loading calculated above to cloud-free layers only. The depth of the cloud-free layer is clearly variable, and the structure of the cloud base is complex during the event. However, we simplify the situation by assuming that only the lowest two layers in the
Ž .
model below 530 m are cloud-free at the upstream edge of the model domain.
3.1.1.3. Concentration of ions in upstream rain. The concentration of ions in upstream
rain is set to reproduce the observed concentration at site 1. The model predicts that no scavenged material is received at site 1 but that some evaporation takes place in the lowest layers. Taking account of this, a value of 22 meq ly1 reproduces the observed
value.
3.1.2. Comparison of model results to data for rain eÕent 3
Table 1 compares data to model predictions for the observational sites during rain event 3. Fig. 5 shows model simulations near the collector sites.
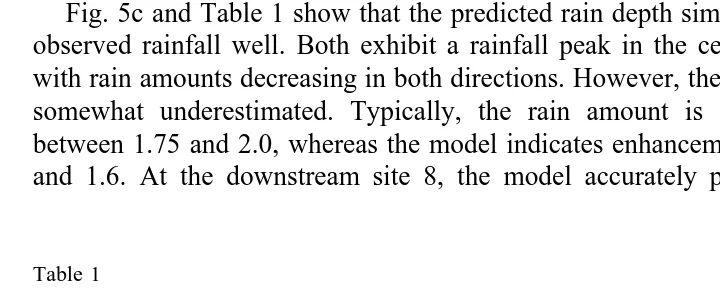
Fig. 5c and Table 1 show that the predicted rain depth simulates many aspects of the observed rainfall well. Both exhibit a rainfall peak in the centre of the moor at site 4 with rain amounts decreasing in both directions. However, the increase in rain amount is somewhat underestimated. Typically, the rain amount is enhanced by a factor of between 1.75 and 2.0, whereas the model indicates enhancement factors of between 1.4 and 1.6. At the downstream site 8, the model accurately predicts a return to a rain
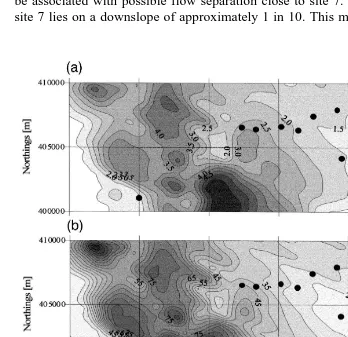
Table 1
Comparison of model results to data for rain event 3
Site 1 2 3 4 5 6 7 8 9
Data 24.7 40.1 40.2 32.5 26.6 24.5 19.5 34.3 12.9
Model 24.7 43.8 40.1 32.1 27.8 29.0 30.5 31.1 22.8
Ž"5.8. Ž"4.9. Ž"4.6. Ž"3.0. Ž"3.0. Ž"3.5. Ž"3.1. Ž"2.1.
y2
[ ]
NO – N deposition mg m3
Data 1.07 3.14 3.04 2.87 2.12 1.54 2.18 1.78 0.78
Model 1.07 2.76 2.75 2.25 1.87 1.66 1.71 1.44 1.50
amount close to the upstream value and the prediction of rainfall at the summit site 9 is also accurate. However, there is disagreement on the downstream edge of the moor at site 7. The data show a large increase in rainfall amount up to 8.0 mm. This is not reproduced by the model, which shows only a small increase in rainfall at site 7 as compared to site 6. This is associated with the small hill positioned 2 km upstream from
Ž . Ž
site 7 Fig. 5f that generates increased liquid water content in the orographic cloud Fig. .
5d and e .
The physical explanation for the large sample volume at site 7 is not clear but it may be associated with possible flow separation close to site 7. In the direction of the flow, site 7 lies on a downslope of approximately 1 in 10. This may be steep enough to cause
Fig. 5. Contour plots showing model output corresponding to box A in Fig. 2 for rain event 3. Collector sites
Ž . Ž . w y2x Ž .
shown v. a Deposition of nitrate ions in rain mg NO N m3 . b Concentration of nitrate ions in rain
w y1x Ž . w x Ž . w y3x Ž .
meq l . c Rain depth mm . d Orographic cloud liquid water content for model layer 2 g m . e
w y3x Ž . w Ž .x
( ) D.W.F. Inglis, T.W. ChoulartonrAtmospheric Research 55 2000 139–157 148
Ž .
Fig. 5 continued .
flow separation close to the surface in this region. This represents a large and abrupt change to the wind velocity field and would have a significant effect on the horizontal wind drift of raindrops allowing the possibility of sudden changes to the rainfall amount in this region. A linearized airflow model generates the wind field used for calculating
Ž .
Ž .
More generally, the model predictions of rainfall depth Fig. 5c are seen to be
Ž .
closely related to the liquid water content of the orographic cloud Fig. 5d and e . Maximum rainfall depths are observed approximately 1 km downstream of the maxi-mum cloud liquid water content. This indicates the scale of the average horizontal drift of raindrops through the cloud. Primarily, the vertical motion of the model layers over the terrain controls the cloud liquid water content. However, the water content can be seen to decline well before the terrain descends. This is a result of the progressive washout of liquid water by raindrop scavenging.
The concentration of nitrate ions in the rain is reproduced within the uncertainty limits of this simulation at sites 2, 3, 4, 5 and 8. Thus, the enhancement to the concentration between site 1 and the western end of the moor is accurately simulated, as is the decline in concentration observed over the central region of the moor. The model significantly underestimates the concentration at sites 7 and 9. If the concentration of ions in individual raindrops is dependent on raindrop size, then the result at site 7 may be explained by the same process, which is suggested for the discrepancy in the rain amount at this site. For this rain event, site 9 is also in the lee of higher terrain and so flow separation may also explain the results at this site.
Between sites 1 and 2, the terrain rises enough to generate thin cloud in layers 1 and
Ž .
2 Fig. 5d and e . The concentration of ions in this cloud is high since its liquid water content is low and scavenging has not yet seriously depleted it. It is in this region that the model predicts the highest concentrations of ions in rain as the thin cloud is scavenged. Unfortunately, there are no datapoints in this region so we cannot comment confidently on this important feature.
Ion deposition is the product of rainfall amount and ion concentration. The model reproduces the main features of the deposition pattern observed at the sites, although as a result of the underestimation of rain amount, the deposition is generally somewhat low. However, in many cases, the observed value is close to the upper limit of the modelled value. Both model and data indicate a maximum deposition at the upstream
Ž .
edge of the moor site 2 and a steady decline till site 6. Both then show an increase in deposition at site 7. However, it should be noted that the reasonably good agreement seen at this site is an artefact brought about by the under-prediction of rainfall and the over-prediction of nitrate concentration.
The data support many of the model predictions, such as the location of the greatest deposition of nitrate ions, and the decreasing trend in deposition moving downstream across the moor. The model reveals that this is due to the progressive washout of ions by rain. In general, the predicted deposition is somewhat low as a result of the underestima-tion of rain amount at most of the sites. Discrepancies between the model and data at sites 7 and 9 may be a result of flow separation in the wake of high terrain, an area in which the airflow model is known to be inaccurate.
3.2. Rain eÕent 8
( ) D.W.F. Inglis, T.W. ChoulartonrAtmospheric Research 55 2000 139–157 150
3.2.1. Model input parameters
3.2.1.1. Vertical temperature and water Õapour profiles. The radio-sonde temperature profile recorded at Aughton at 18:00 GMT defines the temperature and water vapour profiles. From the surface to the 920 mb level, the atmosphere is stable with a potential temperature gradient of 0.0025 K my1. Above this, up to the 800 mb level, the
atmosphere can be considered saturated, since only a small vertical uplift would result in the formation of cloud. The environment curve shows a gradual increase in wet equivalent potential temperature, the gradient being approximately 0.0033 K my1. The
airflow model does not allow for a layered atmosphere of this type. However, it is a good approximation to apply an average potential temperature gradient throughout the boundary layer. This produces an average value of the Brunt–Vaisala frequency,
Ns0.01 sy1, which is used as input to the model. To isolate and examine the effect of
stratification on deposition, we present simulations produced using the observed atmo-spheric temperature profile alongside simulations assuming an adiabatic temperature profile.
The vertical displacement of the lowest layer is not sensitive to the boundary layer temperature structure since it is close to the lower boundary condition for the flow. However, in higher layers, the position and liquid water content of orographic cloud is influenced by the upstream temperature structure. The implications of this dependence are examined in the analysis below.
3.2.1.2. Nitrate loading of the orographic cloud. The method used to calculate the
nitrate cloud loading takes advantage of extra data available during this rain event. It is important that the loading used as input to the model is representative of the orographic cloud that was actually available to be scavenged by rain. During this rain event, high resolution cloud and rain sampling was carried out at site 9 during the period of maximum rainfall intensity. Sufficient sample for analysis could be collected in a 15-min period. Large variations in the concentration of ions in cloud water were observed before, during and after the rain event. To compute the most appropriate cloud loading, we exclude cloud sampled when it was not raining.
For each 15-min observation period, we correct the concentration of ions in cloud samples for contamination by rain. Based on the 15-min sampling, the volume averaged concentration of nitrate ions in the cloud, at site 9, during the period of rain, after correction for contamination by rain, was found to be 77"10 meq ly1. However, the
rainfall rate varies considerably during the event and scavenging is most intense during the heaviest rain. Accordingly, the cloud loading recorded during the most intense precipitation ought to be weighted more heavily than the loading during periods of lighter rain. We therefore choose to use the average concentration of ions in cloud weighted with respect to the recorded rain amounts rather than cloud amounts. This process reduces the concentration of the cloud to 63"13 meq ly1. This is our best
estimate of the average concentration of nitrate ions in cloud that are available to be scavenged by rain at site 9.
ascent data that reproduce the observed humidity at site 1 produce cloud liquid water content at site 9 of 0.21 g my3. This value is not sensitive to the input temperature profile. It is however, dependent on the seeder rainfall rate, which defines the rate at which liquid water and nitrate ions are stripped from the cloud. The loading of nitrate ions in cloud at site 9 can now be evaluated as 0.82"0.16 mg NO m3 y3.
We know that nitrate ions are progressively removed from the cloud by seeder rain at a rate that depends on the rainfall rate. Because of this, the loading calculated for site 9 is lower than that which should be used as an upstream input. Again, model runs are used to simulate the rate at which nitrate is removed. Using the model inputs described above, we find that the loading at site 9 is reproduced if a value of 2.5mg NO m3 y3 is
used as an upstream loading.
As for rain event 3, we use cloud layer data from Ringway to determine the appropriate vertical distribution of the nitrate loading. These indicate that the nitrate loading should be applied to the lowest three model layers only.
3.2.1.3. Concentration of ions in upstream rain. It should be noted that the model input
for this parameter refers to the concentration of ions in the rain when it begins to fall from the top of the model domain. The model simulation using the observed temperature structure predicts the formation of orographic cloud upstream of site 1 in layers 3 and above. Thus, the rain collected at site 1 contains a proportion of scavenged material. We use as input the concentration of ions in the seeder rain that reproduces the observed concentration at site 1 taking the scavenging, and also any evaporation in the lowest layer, into account. This results in an input concentration of 20.0 meq ly1.
( ) D.W.F. Inglis, T.W. ChoulartonrAtmospheric Research 55 2000 139–157 152
For this scenario, the model predicts site 1 to be free from the effects of scavenging and so we may use an upstream concentration that takes account of evaporation only. This results in a concentration of 28.0 meq ly1.
3.2.2. Comparison of model results to data for rain eÕent 8
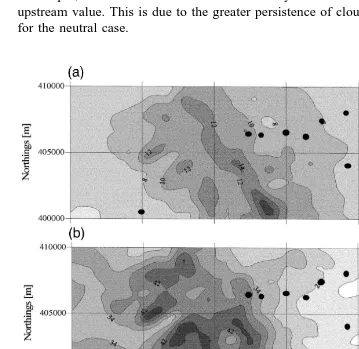
Modifications to the flow caused by the stratification affect the position and shape of the cap cloud, and hence, may affect the pattern of deposition. Fig. 6 illustrates this point with model simulations of orographic cloud in layer 3 which is far enough from the ground for the model streamlines to respond freely to the temperature profile. For the stratified case, cloud condenses approximately 12 km further upstream than for the neutral case and then evaporates about 2 km further upstream. Closer to the surface, the position of the cloud for the two model runs shows a much greater similarity.
This modification to the position of orographic cloud affects the wet deposition since layer 3 is one of the layers in which the orographic cloud nitrate loading is applied. Above this, modifications to the cloud do not affect ion deposition but do affect rainfall amount since the orographic cloud acts as a source of liquid water.
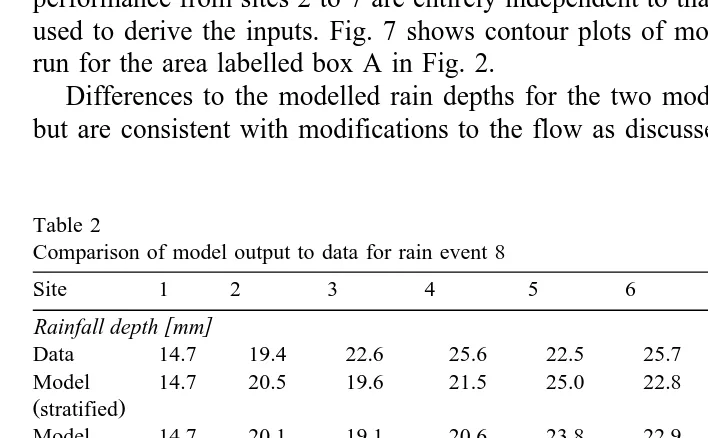
Model simulations are produced using the initialising parameters discussed above and compared to data in Table 2. It should be noted that the data used to assess model performance from sites 2 to 7 are entirely independent to that of sites 1 and 9 which are used to derive the inputs. Fig. 7 shows contour plots of model output for the stratified run for the area labelled box A in Fig. 2.
Differences to the modelled rain depths for the two model runs are relatively small but are consistent with modifications to the flow as discussed above. The formation of
Table 2
Comparison of model output to data for rain event 8
Site 1 2 3 4 5 6 7 8 9
[ ]
Rainfall depth mm
Data 14.7 19.4 22.6 25.6 22.5 25.7 22.6 12.3 20.0
Model 14.7 20.5 19.6 21.5 25.0 22.8 21.2 12.5 23.0
Žstratified.
Model 14.7 20.1 19.1 20.6 23.8 22.9 21.9 15.5 24.3
Žneutral.
y1
[ ]
NO concentration3 meq l
Data 34.2 32.6 29.1 25.9 26.5 22.5 36.2 47.6 24.0
Model 34.2 39.2 33.9 29.0 25.8 26.1 24.2 23.0 23.5
Žstratified. Ž"4.3. Ž"3.3. Ž"2.5. Ž"2.2. Ž"2.0. Ž"1.7. Ž"0.0. Ž"1.5.
Model 34.2 48.5 47.0 41.3 37.8 37.6 33.8 27.5 31.5
Žneutral.
Model 7.0 13.6 12.6 11.9 12.6 12.1 10.4 6.0 10.7
high altitude orographic cloud further upstream for the stratified case allows more scavenging and so produces somewhat larger rainfall amounts over the terrain upstream of site 6. Downstream of this point, the neutral simulation predicts more orographic cloud than the stratified case and so the rainfall amount is correspondingly larger. Both simulations reproduce the scale of the rainfall enhancement successfully and correctly place the rainfall peak close to the centre of the moor. The most significant difference between the simulations can be seen at site 8, the neutral flow simulation over-predicts rain depth, whereas the stratified case correctly returns the rainfall rate to below the upstream value. This is due to the greater persistence of cloud downstream of the moor for the neutral case.
Fig. 7. Contour plots showing model output corresponding to box A in Fig. 2 for rain event 8. Collector sites
Ž . Ž . w y2x Ž .
shown v. a Deposition of nitrate ions in rain mg NO N m3 . b Concentration of nitrate ions in rain
w y1x Ž . w x Ž . w y3x Ž .
meq l . c Rain depth mm . d Orographic cloud liquid water content for model layer 3 g m . e
w y3x Ž . w Ž .x
( ) D.W.F. Inglis, T.W. ChoulartonrAtmospheric Research 55 2000 139–157 154
Ž .
Fig. 7 continued .
sites 1 and 2 where cloud first forms. Second, for the stratified case, site 1 actually receives some scavenged material from cloud formed in layer 3 as indicated in Fig. 7d. This means that in order to match the observed concentration at site 1, the concentration of ions in the seeder rain need not be as high as for the neutral case. Thus, the overall availability of ions for deposition is greater for the neutral simulation.
Both model simulations under-predict nitrate ion concentration at sites 7 and 8. Numerically, the values computed by the neutral simulation are closer to the data. However, we believe this to be co-incidental and not indicative of a more realistic interpretation of the physical processes that give rise to the large concentrations at these sites than that of the stratified model run.
Although differences in rain volume for the model runs are small, we can conclude that the stratified run is more successful since it more accurately returns the rain volume at the downstream site 8 to below the upstream value. For ion concentration and ion deposition, the stratified model runs clearly agrees more closely with the observations for the moorland sites 2, 3, 4, 5, 6 and 9. The data generally lie close to the lower limit of the model uncertainty. The stratified run agrees more closely with both the absolute values of the observed concentration and the gradient in the data. The main discrepancy in the neutral simulation is the consistent over-prediction of ion concentration at the moorland sites. Neither model run succeeds in predicting the large increase in ion concentration observed at sites 7 and 8, which may be the result of lee-side flow effects.
4. Conclusions
The mechanisms that cause variation in deposition are examined for two rain events. Both are examples of frontal rain events observed during a westerly or southwesterly
Ž .
flow. Comparison was made to simulations from a computer model Rainstar which incorporates cloud droplet scavenging and raindrop drift. The model results are inter-preted in terms of the position and properties of the orographic cloud through which raindrops that fall onto the moor pass. The data lend strong support to the accuracy of the model predictions when initialised with observed input parameters. The model successfully reproduced most features of the deposition, concentration, and rainfall fields observed on the moor. For both of the rain events, considered data from sites positioned in the lee of higher terrain were not successfully reproduced by the model. It is suggested that this may be due to lee-side flow effects that have been previously shown to be outside the range of linear airflow modelling techniques.
The upstream temperature profile affects the airflow pattern over the terrain, and therefore, the position and liquid water content of the orographic cloud. The model was successful in reproducing these changes. Alteration to orographic cloud occurs primarily in the higher model layers, whereas alteration to the deposition is controlled by the lowest layers that are cloud-free upstream. This means that if there is only a shallow
Ž .
( ) D.W.F. Inglis, T.W. ChoulartonrAtmospheric Research 55 2000 139–157 156
Acknowledgements
The authors wish to thank the landowners in the Saddleworth Moor area for their cooperation during the experiment. They are Yorkshire Water, Huddersfield Sailing Club, Ashton-under-Lyne Golf Club, BBC at Holme Moss and Mr. John Crowther. Synoptic charts were derived from data supplied by the Royal Meteorological Office and terrain maps are based on data supplied by Ordnance Survey. We would also like to thank Mrs. Anna Haley for the chemical analysis and Mr. Michael Parkin for helping with the sample collection. This work was carried out under contract to the Department of the Environment, Transport and the Regions.
References
Bader, M.J., Roach, W.T., 1977. Orographic rainfall in warm sectors of depressions. Q. J. R. Meteorol. Soc. 103, 269–280.
Carruthers, D.J., Choularton, T.W., 1983. A model of the seeder–feeder mechanism of orographic rain including stratification and wind drift effects. Q. J. R. Meteorol. Soc. 109, 575–588.
Carruthers, D.J., Choularton, T.W., 1984. Acid deposition in rain over hills. Atmos. Environ. 18, 1905–1908. Carruthers, D.J., Hunt, J.C.R., 1990. Fluid mechanics of airflow over hills: turbulence, fluxes and waves in the boundary layer. Atmospheric processes over complex terrain. Am. Meteorol. Soc. Meteorol. Monogr. 23
Ž45 , Chap. 5..
Choularton, T.W., Gay, M.J., Jones, A., Fowler, D., Cape, J.N., Leith, I.D., 1988. The influence of altitude on wet deposition, comparison between field measurements at Great Dun Fell and the predictions of a
Ž .
seeder–feeder model. Atmos. Environ. 22 7 , 1363–1371.
Ž .
Critical Loads Advisory Group CLAG , 1994. Critical loads of acidity in the United Kingdom, Critical Loads Advisory Group summary report, February 1994, ISBN 1-870393-20-1.
Dollard, G.J., Unsworth, M.H., Harvey, M.J., 1983. Pollutant transport in upland regions by occult precipita-tion. Nature 302, 241–242.
Dore, A.J., Choularton, T.W., 1992. A three-dimensional model of airflow and orographic rainfall enhance-ment. Q. J. R. Meteorol. Soc. 118, 1041–1056.
Dore, A.J., Choularton, T.W., Brown, R., Blackall, R.M., 1992a. Orographic rainfall enhancement in the mountains of the Lake district and Snowdonia. Atmos. Environ. 26, 357–371.
Dore, A.J., Choularton, T.W., Fowler, D., 1992b. An improved wet deposition of the United Kingdom incorporating the seeder–feeder effect over mountainous terrain. Atmos. Environ. 26A, 1375–1381. Fowler, D., Cape, J.N., Leith, I.D., Choularton, T.W., Gay, M.J., Jones, A., 1988. The influence of altitude on
rainfall composition at Great Dun Fell. Atmos. Environ. 22, 1355–1362.
Fowler, D., Leith, I.D., Binnie, J., Crossley, A., Inglis, D.W.F., Choularton, T.W., Gay, M., Longhurst, J.W.S., Conlan, D.E., 1995. Orographic enhancement of wet deposition in the United Kingdom: continuous monitoring. Water, Air, Soil Pollut. 85, 2107–2112.
Inglis, D.W.F., 1992. A field and modelling study of airflow over complex terrain and in forest canopy. PhD Thesis, UMIST.
Inglis, D.W.F., Choualrton, T.W., Wicks, A.J., 1995a. The effect of orography on wet deposition in an industrial area. Q. J. R. Meteorol. Soc. 121, 1575–1588.
Inglis, D.W.F., Choualrton, T.W., Wicks, A.J., Fowler, D., Leith, I.D., Werkman, B., Binnie, J., 1995b. Orographic enhancement of wet deposition in the United Kingdom: case studies and modeling. Water, Air, Soil Pollut. 85, 2119–2124.
Marshall, J.S., Palmer, W.McK., 1948. The distribution of raindrops with size. J. Meteorol. 5, 165–166. May, K.R., 1961. Fog droplet sampling using a modified impactor technique. Q. J. R. Meteorol. Soc. 87,
Raper, D.W., Lee, D.S., 1996. Wet deposition at the sub-20 km scale in a rural upland area of England. Atmos. Environ. 30, 1193–1207.
Ž .
Review Group on Acid Rain RGAR , 1990. Acid deposition in the United Kingdom 1986–1988. Third report of the Review Group on Acid Rain, September 1990, ISBN 0-85624-650-6.
Ž .