Prepared by:
Fernando & Yvonn
Quijano
11
Chapter
Input Demand:
The Capital Market
1:
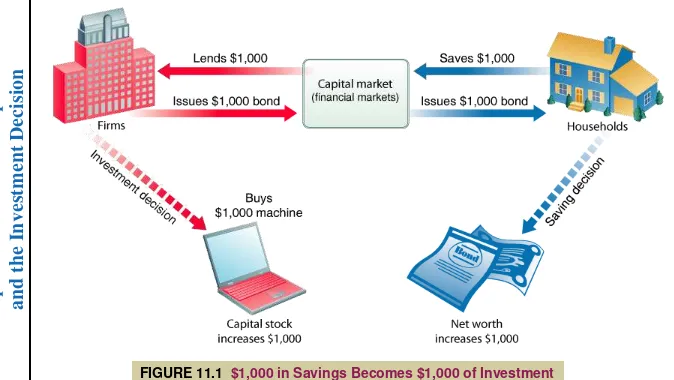
The Capital Market
and the Investment Decision
Capital, Investment, and Depreciation
Capital
Investment and Depreciation
The Capital Market
Capital Income: Interest and Profits
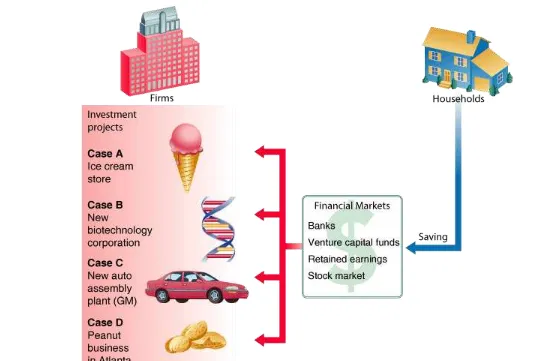
Financial Markets in Action
Capital Accumulation and Allocation
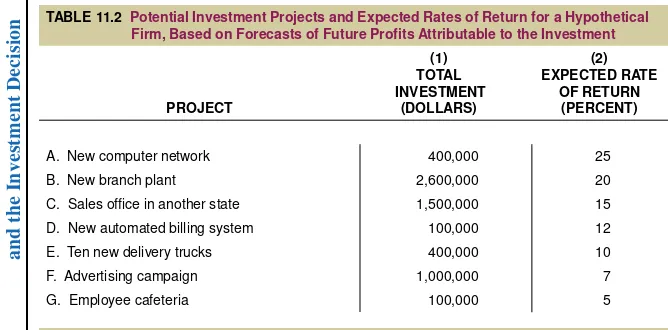
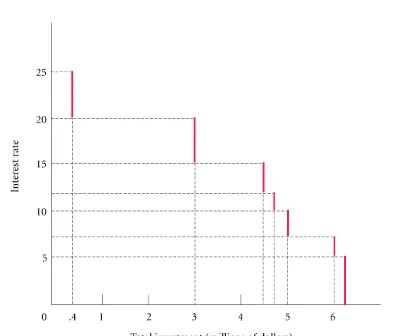
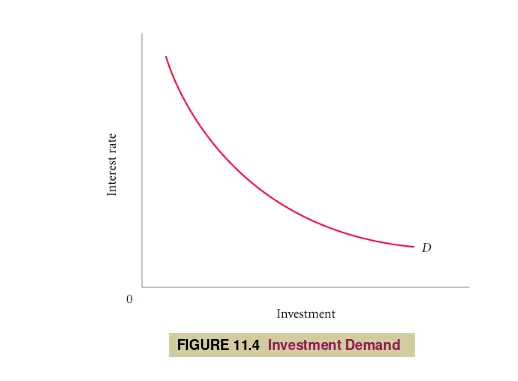
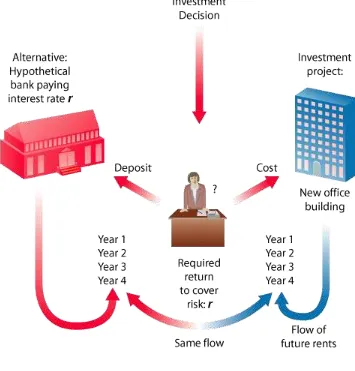
The Demand for New Capital and the Investment Decision
PT
CAPITAL, INVESTMENT, AND DEPRECIATION
CAPITAL
capital
Those goods produced by the
economic system that are used as inputs
to produce other goods and services in the
future.
1:
CAPITAL, INVESTMENT, AND DEPRECIATION
Tangible Capital
physical, or tangible, capital
Material
things used as inputs in the production of
future goods and services. The major
categories of physical capital are
nonresidential structures, durable
PT
CAPITAL, INVESTMENT, AND DEPRECIATION
Social Capital: Infrastructure
social capital, or infrastructure
Capital
that provides services to the public. Most
social capital takes the form of public works
(roads and bridges) and public services
1:
CAPITAL, INVESTMENT, AND DEPRECIATION
Intangible Capital
intangible capital
Nonmaterial things that
contribute to the output of future goods and
services.
human capital
A form of intangible capital
that includes the skills and other knowledge
that workers have or acquire through
PT
CAPITAL, INVESTMENT, AND DEPRECIATION
The Time Dimension
The value of capital is only as great as the value of the services it will render
over time.
Measuring Capital
When we speak of capital, we refer not to money or to financial assets such as bonds and
stocks, but instead to the firm’s physical plant, equipment, inventory, and intangible assets.
capital stock
For a single firm, the current
market value of the firm’s plant, equipment,
1:
CAPITAL, INVESTMENT, AND DEPRECIATION
investment
New capital additions to a
firm’s capital stock. Although capital is
measured at a given point in time (a stock),
investment is measured over a period of
time (a flow). The flow of investment
increases the capital stock.
PT
CAPITAL, INVESTMENT, AND DEPRECIATION
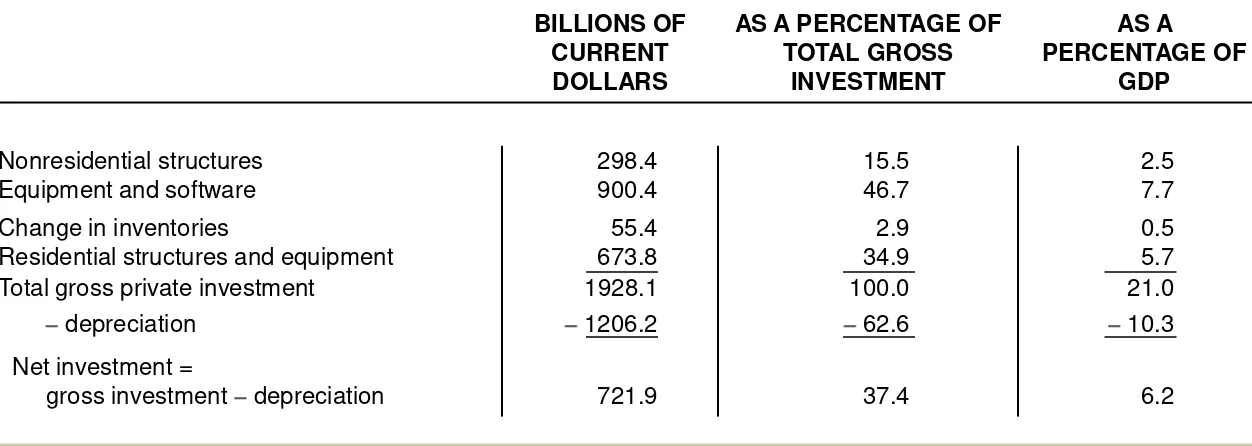
TABLE 11.1
Private Investment in the U.S. Economy, 2004
GDP = 11,734.3
Gross private domestic investment = 1,928.1
BILLIONS OF CURRENT DOLLARS
AS A PERCENTAGE OF TOTAL GROSS
INVESTMENT
AS A
PERCENTAGE OF GDP
Nonresidential structures 298.4 15.5 2.5 Equipment and software 900.4 46.7 7.7 Change in inventories 55.4 2.9 0.5 Residential structures and equipment 673.8 34.9 5.7 Total gross private investment 1928.1 100.0 21.0 depreciation 1206.2 62.6 10.3 Net investment =
gross investment depreciation 721.9 37.4 6.2