COMPARISON OF MICROWAVE BACKSCATTER ANISOTROPY
PARAMETERISATIONS OVER THE ANTARCTIC ICE SHEET
Alexander D. Frasera, Neal W. Younga,band Neil Adamsc
a
Antarctic Climate & Ecosystems Cooperative Research Centre University of Tasmania
Private Bag 80
Hobart, Tasmania, Australia, 7001 [email protected]
b
Australian Antarctic Division Channel Highway
Kingston, Tasmania, Australia, 7050
c
Australian Bureau of Meteorology GPO Box 727
Hobart, Tasmania, Australia, 7001
Commission VIII/10
KEY WORDS:Snow, Ice, Glaciology, Research, Active, Microwave, Satellite
ABSTRACT:
The Antarctic Ice Sheet exhibits a strong anisotropy in microwave backscatter, both as a function of azimuth angle and incidence angle. This anisotropy arises as a result of i) the alignment of roughness elements and other wind-related surface and sub-surface features, as well as ii) internal layers and snow grain size gradient within the snowpack. As a result of its antenna configuration, the European Organisation for the Exploitation of Meteorological Satellites (EUMETSAT) Advanced SCATterometer (ASCAT) satellite instrument is able to observe much of the continent with a large azimuth and incidence angle diversity. A lack of azimuth and incidence diversity has restricted previous backscatter parameterisations to relatively simple bi-sinusoidal (azimuth angle) and linear (incidence angle) parameterisations. Using ASCAT, we show that a better fit can be obtained using a cubic incidence angle function and a Fourier series of up to four terms for parameterisation of the azimuth angle anisotropy. Scatterometer instruments have previously been used in Greenland to retrieve accumulation rate by observing the change in backscatter as a function of incidence angle. Here we present preliminary results of an empirical study linking the isotropic component and incidence angle dependence to snow accumulation rate in Antarctica, using snow stake measurements as ground truthing.
1 INTRODUCTION
Surface mass balance (SMB) is the net input term for ice mass balance calculations and is thus a critical parameter for accurate estimation of the Antarctic Ice Sheet (AIS) contribution to sea level rise (Allison et al., 2009). Despite this, reliable in-situ mea-surements of SMB are sparse throughout the AIS, particularly in the interior of the continent where few staffed stations exist. The mass input to the AIS can be determined from knowledge of the spatial distribution of SMB (the spatial integral of which gives the total mass input), and the temporal variations of this. Spatial ex-tensions of sparse in-situ data can be provided by either modeling or large-scale observation. Recent advances in atmospheric mod-eling capability (e.g., Lenaerts et al. (2012) included the effects of snow redistribution due to blowing snow) have given rise to high-resolution, large-scale maps of SMB throughout the AIS. Satellite remote sensing of SMB provides an indepentent large-scale spa-tial extension of in-situ point and line measurements such as snow stakes (e.g., Higham et al. (1997)) and ground penetrating radar-derived isochronous horizons (e.g., M¨uller et al. (2010)). Passive microwave thermal emission signals are sensitive to SMB, and several studies have explored these links in detail, e.g., Winebren-ner et al. (2001); Arthern et al. (2006). Empirically-derived re-lationships between SMB and scatterometer measurements have been studied in Greenland, but no equivalent study has yet been conducted in Antarctica.
Scatterometers are typically spaceborne, active instruments orig-inally designed to obtain microwave backscatter measurements from small scale roughness on the surface of the ocean for multi-ple azimuth angles. From this information, surface wind strength and direction can be inferred. For approximately two decades, spaceborne scatterometer instruments have also been applied to the great ice sheets in Greenland (e.g., Long et al. (1992)) and Antarctica (e.g., Remy et al. (1992)), in order to retrieve surface and near-surface snow parameters. Large parts of the surface of both the Greenland Ice Sheet (GrIS) and Antarctic Ice Sheet (AIS) are characterised by sastrugi (wind-aligned snow structural features of magnitude depending on wind speed at the time of for-mation, rarely greater than 50 cm in height (Kobayashi, 1980)). Microwave backscatter is enhanced by several dB when look-ing across these roughness features (Furukawa and Young, 1997). For non-nadir microwave observations of the great ice sheets, a large azimuthal diversity of observation is essential, in order to accurately characterise this strong azimuthal anisotropy.
and Drinkwater (2000). Other cryospheric applications of scat-terometer data include iceberg tracking (Young and Hyland, 1997), surface melt detection and facies classification (e.g., Oza et al. (2011); Long and Drinkwater (1994); Drinkwater and Long (1998)). Since many scatterometers also observe the surface at a range of incidence angles, the dependence of backscatter on incidence an-gle can be exploited to retrieve physical parameters of the snow/ firn, e.g., snow grain size (Ulaby et al., 1996) and SMB (Drinkwa-ter et al., 2001). This lat(Drinkwa-ter study found an empirical relationship between SMB and the slope of the backscatter dependence on incidence angle. With the aid of a multilayer scattering model, this dependence was mainly attributed to changes in grain size profile as a function of SMB, and the presence of dielectric dis-continuities in the form of horizontal layers generated either by annually-recurring patterns of snow accumulation, or changes in near-surface meteorological conditions (Drinkwater et al., 2001). It is worth emphasising that this is not a direct retrieval of SMB or accumulation rate, but a complex combination of factors which are related to SMB, i.e., grain size (a function of temperature and time since deposition), the presence/absence of dielectric layers (which can be annual, and hence related to SMB, but also can be sub-annual in the case of wind glaze or episodic snowfall events). Since there is often a dominant azimuthal modulation of surface backscatter from the Antarctic snow cover, particularly in katabatic wind regimes where snow micro-roughness can become strongly mono-directional, this must be accurately characterised and removed before sub-surface parameters (e.g., SMB) can be accurately retrieved.
The EUMETSAT Advanced SCATterometer (ASCAT) instrument was launched in 2007 aboard the MetOp-A satellite. The two-sided antenna configuration of ASCAT gathers data from two 500 km wide swaths separated by a nadir band 700 km wide to pro-vide a combined diversity in incidence and azimuthal observation directions. ASCAT is a C-band scatterometer, with a 29-day re-peat orbit. Antenna beams are oriented 45◦fore, abeam, and 45◦ aft of the satellite track. Incidence angle observations range be-tween∼25◦and 65◦(Figa-Salda˜na et al., 2002).
The excellent azimuth and incidence angle diversity offered by ASCAT raises the possibility of using complex parameterisations to represent the backscatter anisotropy. With a few exceptions, i.e., Long and Drinkwater (2000); Long et al. (2003); Ashcraft and Long (2006); Lambert and Long (2008), parameterisations have been limited to relatively simple second-order Fourier se-ries for azimuth anisotropy parameterisation, and to a linear rela-tionship between backscatter and incidence angle. Here, we in-vestigate the empirical relationships between snow stake-derived measurements of SMB on the AIS, using a Fourier series of order 1, 2 and 4 for azimuth (φ) anisotropy parameterisation, and linear and cubic polynomials for incidence (θ) anisotropy tion. We remove the third order Fourier term in the parameterisa-tion due to its relatively small value throughout most of the AIS (Fraser et al., in prep.). The two parameterisations used in this work are:
Where,Arepresents the isotropic component of backscatter. In the linear parameterisation,Bthe linear coefficient relating back-scatter to incidence angle. This is generalised to a cubic poly-nomial in the cubic parameterisation, with the linear coefficient designatedB1. The incidence angle is normalised to a mid-range
value of 40◦. A more complete comparison of parameterisations will be presented in a forthcoming publication (Fraser et al., in prep.).
2 METHODS
“Gridded-swath” ASCAT Level 1B (data code “ASCA SZR 1B”) data were obtained from the EUMETSAT data centre (http://www. eumetsat.int), and gridded to a polar stereographic projection, with a ground resolution of approximately 12.5 km. The study period was chosen to a) cover at least one repeat cycle of the MetOp-A satellite (29 days), giving the maximum possible az-imuth and incidence diversity, and b) coincide with stable, well below freezing conditions throughout the AIS. Thus, a thirty day period from Day Of Year (DOY) 211, 2010 to DOY 240, 2010 was chosen. Data used in this study were backscatter, azimuth angle, incidence angle, andKp (the normalised RMS error in
backscatter).
For each pixel in the output grid, least-squares fitting was per-formed to both the cubic and linear parameterisation, using the freely-available MPFIT program (Markwardt, 2009), written for ITT’s Interactive Data Language (IDL) software suite. This re-turns values for each of the parameters in the model. Fits were weighted by theKpvalue. Here, theAandB(linear)/B1(cubic)
parameters are empirically compared to measurements of SMB from snow stake traverses throughout Wilkes Land (∼95 - 130◦
E) and around the Lambert Glacier Basin (LGB,∼55◦- 65◦E).
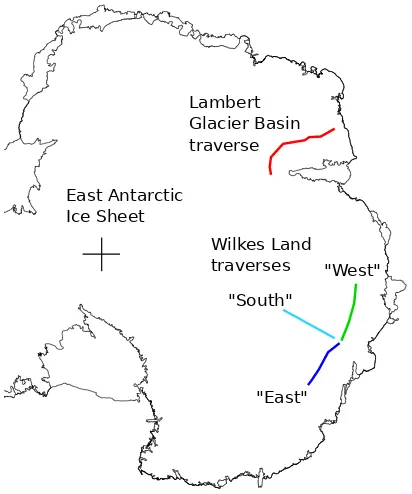
The LGB traverses (Higham and Craven, 1997; Higham et al., 1997) were conducted in the early 1990s. For the traverse sec-tion presented here (“LGB00 - 35”), the interval between deploy-ment and final SMB measuredeploy-ment is approximately 3 years (Nov-Dec 1990 to Nov-(Nov-Dec 1993), satisfying the Magand et al. (2007) requirement for high-quality snow stake measurements of SMB to be multi-year. The Wilkes Land traverses were conducted in the early 1980s, and were taken over intervals of either 3 years (“West” and “East”) or 5 years (“South”). In both the Wilkes and LGB traverses, snow stakes were placed approximately ev-ery 2 km. The Wilkes Land East and West, as well as the LGB traverses all approximately follow the 2,000 m contour, whereas the Wilkes Land South traverse tracks approximately southward to∼3,000 m elevation. All traverse routes are marked in Figure 1. For an initial appraisal, Wilkes Land traverse snow stake data were averaged together in each gridded satellite pixel where snow stake observations were made (maximum of seven 2 km interval snow stake measurements in a∼12.5 km pixel). For the LGB
tra-verse data, following the method of Higham and Craven (1997), SMB measurements were smoothed by an unweighted filter of 30 km width, to remove high frequency temporal and spatial noise. A more consistent averaging scheme cognizant of the scatterom-eter beam pattern will be adopted in future work.
3 RESULTS AND DISCUSSION
After Drinkwater et al. (2001) working in the Greenland dry snow zone, we performed a least-squares fitting of the formSM B = ea−bx, wherexis the “A” parameter (isotropic component of
Lambert
Figure 1: Australian traverse routes for measuring SMB using snow stakes.
angle for the cubic incidence angle parameterisation). These three plots are shown in Figure 2.
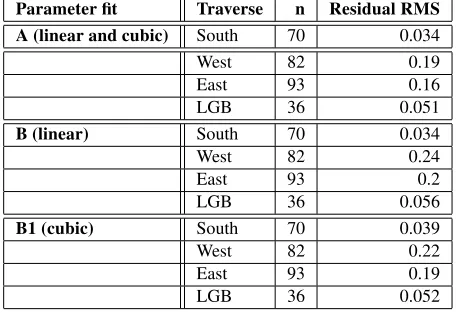
All three sub-figures show a relatively robust empirical relation-ship between SMB andA,BorB1. Table 1 shows that the order
of increasing RMS residual is South, LGB, East, West, regardless of the parameter being fitted against SMB. Analysis of individ-ual, unfiltered snow stake measurements suggests that much of the West traverse route crosses a region where accumulation rate is low and surface wind glaze conditions are prevalent. Similar conditions were also encountered throughout the LGB traverse, to a lesser extent (Higham and Craven, 1997), though the lower residual can likely be attributed to lower values of SMB encoun-tered here.
Drinkwater et al. (2001) discovered SMB had a stronger rela-tionship with theB parameter than with theA parameter, i.e., the incidence angle anisotropy is more sensitive to changes in SMB than the isotropic component. In the present study, we find a lower RMS residual in the empirical fit between SMB and A (0.20 m accumulation/annum), than with SMB and B (0.24 m/annum) orB1 (0.27 m/annum). We note that in the
Greenland dry snow zone, there are annual layers that exhibit a strong dielectric contrast, likely a result of autumnal hoarfrost formation (Hawley et al., 2006). Complex interactions between precipitation-bearing synoptic systems and local orography are important along the East Antarctic coast (e.g., a large snowfall gradient exists between the eastern and western sides of Law Dome, centred at∼112.5◦E, 66.5◦S), and may explain the wider
range of observed A and B parameters in the Wilkes Land West traverse than the East. Furthermore, in regions of persistent wind glaze and low accumulation (e.g., parts of the Wilkes Land West traverse route), annual dielectric layers may not exist in the snow/ upper firn. Thus, the relationship between incidence angle aniso-tropy and SMB likely varies regionally, particularly along the East Antarctic coast. In such regions, it comes as no surprise that theAparameter gives a better indication of SMB than the Bparameters, sinceAis a strong function of near-surface snow grain size (Ulaby et al., 1996), and in the absence of accumula-tion, grain size metamorphism/growth continues to occur at the
SMB=e-6.62-0.35A
SMB=e-9.10-32.7B
Lambert Glacier Basin traverse LGB00-35 Wilkes Land "South" traverse
"A" parameter (isotropic component of backscatter, dB)
"B" parameter (slope of backscatter vs incidence angle, dB/°)
"B1" parameter (linear component of backscatter
dependence on incidence angle, dB/°) a)
Figure 2: a) SMB vs “A” parameter for the linear parameterisa-tion (cubic is very similar, so not shown here). b) SMB vs “B” parameter for the linear parameterisation. c) SMB vs “B1
param-eter for the cubic paramparam-eterisation. The least-squares fit using a model of the formSM B=ea−bx
is shown with the dashed line, where x is the “A” parameter for panel a), “B” for b), and “B1”
for c), after Drinkwater et al. (2001) in Greenland.
surface, giving higher backscatter at sites of lower accumulation.
Table 1: RMS residual of individual least-squares fits for each traverse route.
Parameter fit Traverse n Residual RMS
A (linear and cubic) South 70 0.034
West 82 0.19
East 93 0.16
LGB 36 0.051
B (linear) South 70 0.034
West 82 0.24
East 93 0.2
LGB 36 0.056
B1 (cubic) South 70 0.039
West 82 0.22
East 93 0.19
LGB 36 0.052
4 CONCLUSIONS AND FUTURE WORK
This work forms an important first step in establishing an empiri-cal link between SMB and remotely-sensed scatterometer-derived parameters in Antarctica. While significant spread in SMB re-trieval is observed from challenging surface conditions, i.e, from the Wilkes Land West and East traverse routes, it is encourag-ing to see similarly accurate retrievals of SMB values from geo-graphically distant locations and from different altitudes/snowfall regimes.
We aim to extend this work by empirically linking SMB to scatter-ometer-derived parameter retrievals using more extensive ground validation, i.e., as in Lenaerts et al. (2012). Furthermore, addi-tional ground truthing will be provided by the Norway-US tra-verse ground penetrating radar data, which gives long-term SMB average from the deposition of the Tambora volcanic eruption emissions (∼1816) to 2007, high on the Antarctic plateau (M¨uller
et al., 2010).
It is clear that more accurate SMB retrievals will require the use of complementary remote sensing data, either in the form of dif-ferent frequency scatterometer data (altering the penetration depth, volume backscatter from snow grains, and surface backscatter from sastrugi/microrelief), fully polarimetric scatterometer data (allowing better characterisation of surface scattering), visible/ near IR surface grain size data, or inclusion of passive microwave emission data. The last option, a fusion of passive and active mi-crowave observations, is being addressed in current work.
ACKNOWLEDGEMENTS
This work was supported by the Australian Government’s Co-operative Research Centres Program through the Antarctic Cli-mate & Ecosystems Cooperative Research Centre (ACE CRC). ASCAT Level 1B data were provided by the EUMETSAT Data Centre version 3 (http://www.eumetsat.int). The authors wish to thank J. Jacka and B. Legr´esy for discussions about snow/firn structure/metamorphism and radar backscatter from snow/firn re-spectively. The authors also wish to thank M. “Duk” Craven for providing and assisting with the LGB traverse data, and G. Hy-land for helpful comments on the manuscript.
On the 23rd March 2012 at the age of 51 Neil Adams passed away suddenly. He leaves behind him a tremendous legacy to the Antarctic and meteorological community. Neil has been nation-ally and internationnation-ally recognised for his dedication to, and role in, advancing the science and wide-spread application of meteo-rology particularly in the fields of data presentation, high-latitude
meteorology and service provision. Neil contributed to several national and international polar-related committees/forums. His many authored and co-authored peer-reviewed papers are further testament to his inherent professionalism and expertise. Neil is sadly missed by his many colleagues in the Antarctic community.
Biography provided by P. Reid, Australian Bureau of Meteorol-ogy (Centre for Australian Weather and Climate Research).
References
Allison, I., Alley, R. B., Fricker, H. A., Thomas, R. H. and Warner, R. C., 2009. Ice sheet mass balance and sea level. Antarctic Science 21(5), pp. 413–426.
Arthern, R. J., Winebrenner, D. P. and Vaughan, D. G., 2006. Antarctic snow accumulation mapped using polarization of 4.3-cm wavelength microwave emission. Journal of Geophys-ical Research (Atmospheres) 111, pp. D06107.
Ashcraft, I. S. and Long, D. G., 2006. Relating microwave backscatter azimuth modulation to surface properties of the Greenland ice sheet. Journal of Glaciology 52, pp. 257–266.
Drinkwater, M. and Long, D., 1998. Seasat, ers-1/2 and nscat scatterometer observed changes on the large ice sheets. In: Geoscience and Remote Sensing Symposium Proceedings, 1998. IGARSS ’98. 1998 IEEE International, Vol. 4, pp. 2252 –2254 vol.4.
Drinkwater, M. R., Long, D. G. and Bingham, A. W., 2001. Greenland snow accumulation estimates from satellite radar scatterometer data. Journal of Geophysical Research 106, pp. 33935–33950.
Figa-Salda˜na, J., Wilson, J. J., Attema, E., Gelsthorpe, R., Drinkwater, M. R. and Stoffelen, A., 2002. The advanced scatterometer (ASCAT) on the meteorological operational (MetOp) platform: A follow on for European wind scatterome-ters. Canadian Journal of Remote Sensing 28(3), pp. 404–412.
Fraser, A. D., Young, N. W. and Adams, N., in prep. A compari-son of microwave backscatter anisotropy parameterisations of the antarctic ice sheet using ascat. To be submitted to IEEE Transactions on Geoscience and Remote Sensing.
Furukawa, T. and Young, N. W., 1997. Comparison of mi-crowave backscatter measurements with observed roughness of the snow surface in East Queen Maud Land, Antarctica. In: Proceedings of the 3rd ERS Symposium, Florence.
Hawley, R. L., Morris, E. M., Cullen, R., Nixdorf, U., Shepherd, A. P. and Wingham, D. J., 2006. ASIRAS airborne radar re-solves internal annual layers in the dry-snow zone of Green-land. Geophysical Research Letters 330, pp. 4502.
Higham, M. and Craven, M., 1997. Surface Mass Balance and Snow Surface Properties from the Lambert Glacier Basin Tra-verses 1990-94. Research report 9, Antarctic CRC, Private Bag 80, Hobart, Tasmania, 7001, Australia.
Higham, M., Craven, M., Ruddell, A. and Allison, I., 1997. Snow-accumulation distribution in the interior of the Lambert Glacier basin, Antarctica. Annals of Glaciology 25, pp. 412– 417.
Kobayashi, S., 1980. Studies on Interaction Between Wind and Dry Snow Surface.
Lambert, B. and Long, D. G., 2008. Monitoring changes in the Antarctic Ice Sheet form 1978 to 2007. In: Proceedings of the IEEE International Geoscience and Remote Sensing Sympo-sium (IGARSS).
Ledroit, M., R´emy, F. and Minster, J.-F., 1993. Observations of the Antarctic ice sheet with the Seasat scatterometer: relation to katabatic-wind intensity and direction. Journal of Glaciol-ogy 39, pp. 385–396.
Lenaerts, J. T. M., van den Broeke, M. R., van de Berg, W. J., van Meijgaard, E. and Kuipers Munneke, P., 2012. A new, high-resolution surface mass balance map of Antarctica (1979-2010) based on regional atmospheric climate modeling. Geo-physical Research Letters 39, pp. 4501.
Long, D. G. and Drinkwater, M. R., 1994. Greenland ice-sheet surface properties observed by the Seasat-A scatterometer at enhanced resolution. Journal of Glaciology 40, pp. 213–230.
Long, D. G. and Drinkwater, M. R., 2000. Azimuth variation in microwave scatterometer and radiometer data over Antarc-tica. IEEE Transactions on Geoscience and Remote Sensing 38, pp. 1857–1870.
Long, D. G., Ashcraft, I. S. and Luke, J. B., 2003. Radar scatterometer observations of sastrugi on the great ice sheets. In: W. L. Barnes (ed.), Society of Photo-Optical Instrumen-tation Engineers (SPIE) Conference Series, Society of Photo-Optical Instrumentation Engineers (SPIE) Conference Series, Vol. 5151, pp. 85–93.
Long, D. G., Hardin, P. J. and Shaw, R. A., 1992. Greenland observed at a high resolution by the Seasat Scatterometer. In: IEEE International Geoscience and Remote Sensing Sympo-sium Proceedings, Vol. 5, pp. 327–329.
Magand, O., Genthon, C., Fily, M., Krinner, G., Picard, G., Frez-zotti, M. and Ekaykin, A. A., 2007. An up-to-date quality-controlled surface mass balance data set for the 90◦-180◦E Antarctica sector and 1950-2005 period. Journal of Geophysi-cal Research (Atmospheres) 112, pp. 12106.
Markwardt, C. B., 2009. Non-linear Least-squares Fitting in IDL with MPFIT. In: D. A. Bohlender, D. Durand, & P. Dowler (ed.), Astronomical Data Analysis Software and Systems XVIII, Astronomical Society of the Pacific Confer-ence Series, Vol. 411, p. 251.
M¨uller, K., Sinisalo, A., Ansch¨utz, H., Hamran, S.-E., Hagen, J.-O., McConnell, J. R. and Pasteris, D. R., 2010. An 860 km surface mass-balance profile on the East Antarctic plateau derived by GPR. Annals of Glaciology 51, pp. 1–8.
Oza, S. R., Singh, R. K. K., Vyas, N. K. and Sarkar, A., 2011. Study of inter-annual variations in surface melting over Amery Ice Shelf, East Antarctica, using space-borne scatterometer data. Journal of Earth System Science 120, pp. 329–336.
Remy, F., Ledroit, M. and Minster, J. F., 1992. Katabatic wind intensity and direction over Antarctica derived from scatterom-eter data. Geophysical Research Letters 19, pp. 1021–1024.
Ulaby, F. T., Siquera, P., Nashashibi, A. and Sarabandi, K., 1996. Semi-empirical model for radar backscatter from snow at 35 and 95 GHz. IEEE Transactions on Geoscience and Remote Sensing 34, pp. 1059–1065.
Winebrenner, D. P., Arthern, R. J. and Shuman, C. A., 2001. Mapping Greenland accumulation rates using observations of thermal emission at 4.5-cm wavelength. Journal of Geophysi-cal Research 106, pp. 33919–33934.
Young, N. W. and Hyland, G., 1997. Applications of time se-ries of microwave backscatter over the Antarctic region. In: Proceedings of the 3rd ERS Scientific Symposium, Florence, Italy.