TEXTURE ANALYSIS BASED FUSION EXPERIMENTS USING HIGH-RESOLUTION
SAR AND OPTICAL IMAGERY
Shuhe Zhao*, Yunxiao Luo, Hongkui Zhou, Qiao Xue, An Wang
School of Geographic & Oceanographic Sciences, Nanjing University, Nanjing 210093, P.R. China, [email protected]
KEYWORDS: Data Fusion, Texture Analysis, Terrasar-X, Quickbird, Evaluation
ABSTRACT:
High resolution SAR images contain plenty of detailed textural features, and optical images have spectral features. For the different characteristics of the two images, Firstly, we extracted textural measures of TerraSAR-X image based on the Gray Level Co-occurrence Matrix (GLCM) method, and chose the appropriate window. Then data fusion between textural measures of TerraSAR-X image and QuickBird multi-spectral image was implemented based on PCA transform, and the fusion results were quantitatively evaluated, showing that the fusion image keep spectral information well and the spatial information be enhanced.
1. INTRODUCTION
Multi-spectral optical images have abundant spectral information and provide good discrimination ability, but acquisition of them is affected by atmospheric phenomena, such as cloud cover, smog, haze and winter darkness. SAR images can be operated under any weather conditions, but their discrimination ability is affected by the presence of speckle and single frequency nature [1]. So it is useful to fuse the two kinds of data to overcome the disadvantages and obtain more information. There are several work have been done on this. However, fusion of different sensor data such as those in optical and radar imagery is still a challenge [2].
In the interpretation of synthetic aperture radar (SAR) images, texture provides important information, in addition to image gray levels or the backscatter values alone [3]. And also texture may, in fact, be more useful than image tone in interpreting radar images [4]. It is very important to investigate textural information in SAR images, especially for high resolution SAR images, like TerraSAR-X. Gray Level Co-occurrence Matrix (GLCM) was put forward by Haralick et al. [5], which is the most popular used texture image generation and analysis scheme [6].
So in this paper, we will firstly analyze the textural information of TerraSAR-X image based on GLCM, deicide a proper moving window size and extract some textural measures from it. Then fuse the textural measures and QuickBird multi-spectral image by principal component analysis method.
2. STUDY AREA AND DATA 2.1 Study area
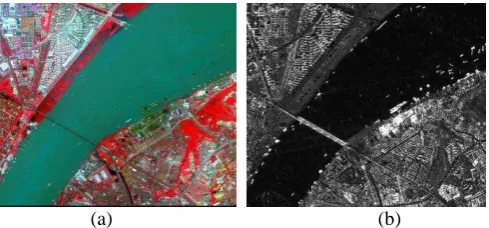
The capital of Jiangsu province in China, Nanjing, has been selected as the study site. The area chosen for this study covers a very small portion, and situates in the nearby area of Nanjing Yangtze River Bridge (32°08 19 N-32°6 4 N, 118°43 26 E-118°46 25 E) (Fig. 1). It covers an area of about 4.8km×4.1km, with a variety of land cover.
Figure 1. Images of study area, (a) is the Standard false-color composite image of QuickBird, and (b) is TerraSAR-X HH image.
2.2 Data
In this study, a QuickBird image of June 2007 and a TerraSAR-X image of 4 March 2008 have been used. The QuickBird data have four multispectral bands and one panchromatic band. In this study, green, red and near infrared bands have been used. TerraSAR-X is an X-band polarimetric SAR, and the data used in the study is Stripmode, at a high resolution of 3 m.
3. METHODOLOGY 3.1 Data preprocessing
Different from optical images, SAR images have a granular appearance due to the speckle formed as a result of the coherent radiation used for radar systems, which reduces the spatial resolution and fine structure of the image, and makes interpretation of SAR images more complex. So the reduction of the speckle is a very important step in further analysis. The analysis of the radar images must be based on the techniques that remove the speckle effects while considering the intrinsic texture of the image frame [7]. As the noise in SAR images is multiplicative noise, in this study, several classical adaptive filters [8] for speckle suppression such as Lee, Enhanced Lee, Frost, Enhanced Frost, and Gamma-map were compared. The method Lee with 5×5 was chosen, for the speckle noise was reduced with very low degradation of the textural information.
* Corresponding author.
(a) (b)
International Archives of the Photogrammetry, Remote Sensing and Spatial Information Sciences, Volume XXXIX-B7, 2012 XXII ISPRS Congress, 25 August – 01 September 2012, Melbourne, Australia
Image registration between multi-source remote sensing images is the premise and basis of data fusion, the accuracy of which will directly influence the quality of image fusion [9]. So in order to perform accurate data fusion, high geometric accuracy between the images is needed. In this paper, polynomial rectification and bilinear interpolation approach was used to registering the two images. The QuickBird image was used as the base image. Then, the TerraSAR-X image was geometrically corrected based on the QuickBird image, and the RMSE was less than one pixel.
3.2 Texture analysis
The texture features extracted by gray level co-occurrence matrix method are affected by the chosen window size [10]. So in the following we would discuss the window size effect in extracting texture features by gray level co-occurrence matrix, and get the appropriate window size.
There are several texture features obtained by GLCM [5], only seven of which were chosen in this study. Texture features were detected in four directions in 0°, 45°, 90° and 135°, then, used the mean of the four directions as the final texture features. This can eliminate the directional influence, and improve the extraction accuracy of texture features. To obtain the appropriate window size in extracting the texture features, window size of 3×3, 5×5, to 31×31, 41×41, 51×51, and 61×61 were tested to analyze the influences.
3.3 Data fusion based on PCA and accuracy evaluation
Image fusion is performed at three different processing levels according to the stage at which the fusion takes place: Pixel, Feature and Decision level [11]. In this paper, data fusion was implemented at a pixel level and the principal component analysis (PCA) was applied. PCA is a statistical that transforms a multivariate data set of inter-correlated variables into a set of new uncorrelated linear combinations of the original variables, thus generating a new set of orthogonal axes.
Four indexes were used to evaluate the quality of the fusion images, Shannon entropy and sharpness to test the details of spatial information and spectral distortion and correlation coefficient to test the preservation of spectral information.
Shannon entropy (as in (1)) was put forward by Shannon in 1948, which represents the average information abundance in the fusion image, larger Shannon entropy with larger information abundance.
2
where p(i) is probability which gray value is i.
Sharpness (as in (2)) is also known as average gradient, which is used to describe sharpness of images, larger average gradient with clearer images.
(2)
where△F
i(i,j) is the gradient in x direction in fusion image, and △Fj(i,j) is in y direction.
Spectral distortion (as in (3)) reflects the extent of distortion in multi-spectral images, larger multi-spectral distortion with more intensive distortion.
(3)
where A(i, j), F(i, j) represent the gray value of images before and after fusion respectively.
Correlation coefficient (as in (4)) represents the similarity of the two images, larger correlation coefficient with better fusion. Obviously, the best value is 1.
(4)
where A(i, j), F(i, j) represent the gray value of images before and after fusion respectively, MeanA and MeanF are the mean value of images before and after fusion.
4. RESULTS AND DISCUSSION 4.1 Texture analysis of TerraSAR-X image
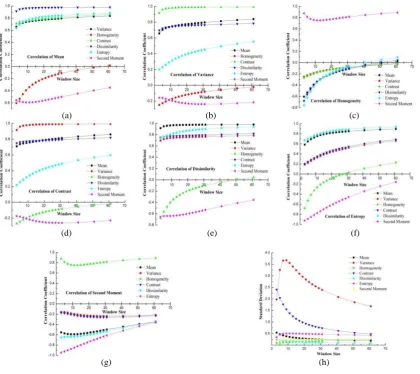
For the seven textural measures are all obtained by GLCM, they are inevitably related to each other. If the correlation between them is high, it will lead to data redundancy. Also, the different moving window sizes make the correlations between the textural measures change observably.
With the window size increasing, correlation of textural measures of Mean, Dissimilarity and Entropy with others show the same linear or exponential changing tendency respectively (Fig.2 (a) ~ (g)). The correlation coefficient reaches maximum at the window size of 61×61, and shows a saturated tendency. Meanwhile, Homogeneity and Second Moment experienced the same change from negative to positive correlation. Correlation of Variance and Contrast with other textural measures also showed the intensive tendency, but the correlations of the two textural measures with Homogeneity and Second Moment were influenced low with different window sizes, and the correlation coefficients were all small, respectively. Correlation of Homogeneity and Second Moment showed the same intensive tendency, the different is except the positive correlation between Homogeneity and Second Moment, and others all experienced from negative to positive. This has showed that the increasing moving window size makes the correlations between the textural measures strengthen, and lead to more data redundancy.
Standard Deviation reflects the degree of dispersion of an image, bigger with more information. And also we can see from Fig.2 (h) that Standard Deviation of the textural measures are increasing with the increasing moving window size, reaching maximum at the size of 11×11, then turn down.
4.2 Experiments
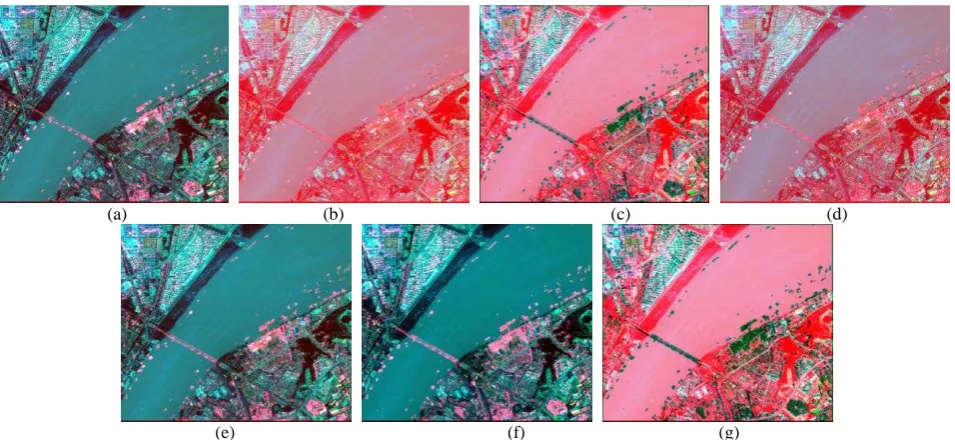
After analyzing above, window size of 11×11 was chosen to calculate the textural measures by GLCM. The method PCA was applied to perform fusion. The single textural measure was used to replace the first principal component of the QuickBird multi-spectral image. Then use inverse PCA to get the fusion image (Fig. 3).
International Archives of the Photogrammetry, Remote Sensing and Spatial Information Sciences, Volume XXXIX-B7, 2012 XXII ISPRS Congress, 25 August – 01 September 2012, Melbourne, Australia
Then the evaluation index, Shannon entropy, sharpness, spectral distortion and correlation coefficient were applied to evaluate the fusion results. From Table 1, we can see that the information abundance of fusion with single textural measure are all increased. That means it is reasonable to fuse texture with images. But the results are close to each other. That is because they are all obtained
by GLCM, and correlations between them, which has been analyzed above. The textural measure of Entropy based fusion has more spatial information, and less spectral distortion. Homogeneity based fusion has the least information, and Second moment based fusion has the largest Spectral distortions. So when we fuse textural measures with images, it is important to choose the textural measures.
Texture measures Sharpness Shannon entropy
Spectral distortions
correlation coefficient
Mean 7.3447 1.1949 25.0928 0.7536
Variance 6.2519 1.1270 24.5272 0.7387 Homogeneity 6.9448 0.9866 27.9070 0.7809 Contrast 6.2741 1.1281 24.4223 0.7399 Dissimilarity 7.5511 1.1983 24.6145 0.7624 Entropy 8.2487 1.2574 24.9710 0.7811 Second moment 8.2528 1.0632 33.5779 0.7151 Original QuickBird image 10.6940 0.9332 --- ---
Table 1. Evaluation of PCA fusion based on texture analysis
5. CONCLUSION
The results of the procedure proposed in this letter show that it is possible to extract some kind of texture information high satellite SAR images and fuse them with some methods. In this study, texture has been extracted by GLCM after analysis, and fusion performed simply by PCA at pixel level. The results are not so satisfactory. That
is because GLCM is based on gray value statistics, and SAR image after filtering is inevitably blurred. Some texture information would be removed. In the following work, other methods (like Wavelet based) to extract texture should be proposed to improve to obtain accuracy texture, and other fusion methods can also be used.
(g) (h)
(a) (b) (c)
(d) (e) (f)
International Archives of the Photogrammetry, Remote Sensing and Spatial Information Sciences, Volume XXXIX-B7, 2012 XXII ISPRS Congress, 25 August – 01 September 2012, Melbourne, Australia
Figure 2. (a) ~ (g) are correlations between texture measures in different windows. (The corresponding sequence is Mean, Variance, Homogeneity, Contrast, Dissimilarity, Entropy, and Second Moment.). (h) The standard deviation of the textural measures in different windows.
Figure 3. (a) ~ (g) are fusion results with different textural measures by PCA. (The corresponding textural measures sequence is Mean, Variance, Homogeneity, Contrast, Dissimilarity, Entropy, and Second Moment.).
6. REFERENCES
[1] Yi Yang, Chongzhao Han, Deqiang Han, “A Markov Random Field Model-based fusion approach to segmentation of SAR and optical
images”, IEEE International Geoscience and Remote Sensing
Symposium, IV, pp. 802–805, 2008.
[2] Gintautas Palubinskas, Peter Reinartz and Richard Bamler, “Image acquisition geometry analysis for the fusion of optical and radar remote
sensing data”, International Journal of Image and Data Fusion, Vol. 1,
No. 3, pp. 271–282, 2010.
[3] Anne H. Schistad Solberg and Anil K. Jain, “Texture Fusion and Feature
Selection Applied to SAR Imagery”, IEEE Transactions on Geoscience
and Remote Sensing, Vol. 35, No. 2, pp. 475–479, 1997
[4] Fawwaz T. Ulaby, F. Kouyate, B. Brisco, and T. H. Lee Williams,
“Textural Infornation in SAR Images”, IEEE Transactions on
Geoscience and Remote Sensing, Vol. GE-24, No. 2, 1986.
[5] Robert M. Haralick, K. Shanmugam, and ITS’HAK Dinstein, “Textural
Features for Image Classification”, IEEE Transactions on Systems, Man,
and Cybernetics, Vol. SMC-3, No. 6, pp. 610–621, 1973.
[6] Lee K., Jeon S.H., and Kwon B.D., “Urban feature characterization using high-resolution satellite imagery: texture analysis approach”, CD ROM Proceeding of MAPASIA 2004 Conference, Beijing, China. 2004. [7] D. Amarsaikhan, H.H. Blotevogel, J.L. van Genderen, M. Ganzorig, R.
Gantuya, and B. Nergui, “Fusing high-resolution SAR and optical
imagery for improved urban land cover study and classification”,
International Journal of Image and Data Fusion, Vol. 1, No. 1, pp. 83–97, 2010.
[8] J. B. K. Kiema, “Texture analysis and data fusion in the extraction of
topographic objects from satellite imagery”. International Journal of
Remote Sensing, vol. 23, no. 4, pp. 767–776, 2002.
[9] Pohl, C. and van Genderen, J.L., “Multisensor image fusion in remote
sensing: concepts, methods and applications”. International Journal of
Remote Sensing, Vol. 19, No. 5, pp. 823–854, 1998.
7. ACKNOWLEDGEMENT
This research was supported by 973 Program (2010CB951503), Natural Science Foundation of China (40501047), and the Priority Academic Program Development of Jiangsu Higher Education Institutions.
(a) (b) (c) (d)
(e) (f) (g)
International Archives of the Photogrammetry, Remote Sensing and Spatial Information Sciences, Volume XXXIX-B7, 2012 XXII ISPRS Congress, 25 August – 01 September 2012, Melbourne, Australia