SEMIGLOBAL MATCHING RESULTS ON THE ISPRS STEREO MATCHING
BENCHMARK
Pablo d’Angelo and Peter Reinartz
German Aerospace Center (DLR), Remote Sensing Technology Institute, D-82234 Wessling, Germany email:{Pablo.Angelo, Peter.Reinartz}@dlr.de
KEY WORDS:Cartosat-1, Worldview-1, DEM, Matching, Stereo, Accuracy
ABSTRACT:
Digital surface models can be efficiently generated with automatic image matching from optical stereo images. The Working Group 4 of Commission I on “Geometric and Radiometric Modelling of Optical Spaceborne Sensors” provides a matching benchmark dataset with several stereo data sets from high and very high resolution space borne stereo sensors at http://www.commission1.isprs.org/wg4/. The selected regions are in Catalonia, Spain, and include three test areas, covering city areas, rural areas and forests in flat and medium undulated terrain as well as steep mountainous terrain. In this paper, digital surface models (DSM) are derived from the Cartosat-1 and Worldview-1 datasets using Semiglobal Matching. The resulting DSM are evaluated against the first pulse returns of the LIDAR reference dataset provided by the Institut Cartogr`afic de Catalunya (ICC), using robust accuracy measures.
1 INTRODUCTION
The main topic of the benchmarking is the automatic generation of Digital Elevation Models (DEM) using optical stereo data from space, which includes, as one of the main processing steps, im-age matching algorithms. Since processing of optical stereo data is of high interest for many purposes, automatic techniques for image matching and DEM generation have been developed by many institutions to achieve optimum usage of the stereo data sets. A lot of different methods have been developed within the last decades (Heipke et al., 1996, Reinartz et al., 2006, Zhang and Gruen, 2006) and especially the last years have boosted sev-eral new algorithms and methods from computer vision with very interesting results (Hirschm¨uller, 2008)
On the sensor side, several new systems which are able to acquire stereo data from space have been launched in recent years. Es-pecially two kinds of systems are highlighted within this bench-marking exercise. First the along track stereo cameras from Carto-sat-1 and ALOS-PRISM: both exhibit a spatial resolution of ap-proximately 2.5 m (GSD) and are specially built for stereo ac-quisition. These camera systems use two (Cartosat-1) and three (ALOS-PRISM) CCD lines for along track stereo viewing in the same orbit. No special manoeuvres of the satellites are neces-sary and long stereo stripes can be acquired in a short time span. In contrast to these sensors the new generation of very high res-olution (VHR) sensors like Worldview-1 and -2 and GeoEye-1 deliver data with 0.5 m GSD for civil applications. Through their very agile manoeuvring they can also acquire stereo data within the same orbit just using the CCD line combination, by pointing at the same area from two or more orbit positions.
2 DSM GENERATION
Orientation of the satellite imagery and stereo matching are the key parts of DSM generation from optical stereo images. This pa-per uses the RPCs and RPC correction delivered with the bench-mark datasets, and concentrates on the stereo matching part.
2.1 Semiglobal Matching
Detailed reconstruction of small structures from very high reso-lution stereo images can be performed using dense stereo match-ing algorithms. Good results with a reasonable runtime have
been achieved with the Semiglobal matching (SGM) algorithm (Hirschm¨uller, 2008).
The main components of SGM are matching cost computation and cost aggregation. The matching cost computes a similarity value for potentially matching pixels in two images. Using the epipolar geometry, matching costs are computed for all poten-tially matching pixels in the image pair. Well known matching costs include computing the correlation coefficient for matching windows. This assumes fronto-parallel surfaces in the stereo im-ages. In this work we use the Census transform (Zabih and Wood-fill, 1994), which is also based on a small window, but behaves quite well in the presence of discontinuities. Census uses a bit string, where each bit is allocated to a pixel in a small neigh-bourhood. This bit is set to 1 if the pixel has a lower inten-sity than the centre pixel. This bit string robustly encodes the local image structure, as it is invariant to any monotonic gray value change, and is thus well suited for matching stereo images with radiometric differences. The similarity and thus the match-ing cost between two bit strmatch-ings is computed usmatch-ing the Hammmatch-ing distance. The hamming distance counts the number of differ-ing bits in two bitstrdiffer-ings. In our work, a9×7window is used and supports the matching costs in the range of 0 to 63, which are rescaled to0..1023in our implementation. In a thorough evaluation of many matching cost functions (Hirschm¨uller and Scharstein, 2009), Census turned out to be a very robust and reli-able cost function with good performance.
As the matching costs based on single pixel values or small win-dows are ambiguous, regularization is used to ensure a well be-haved reconstruction. For semi-global matching, the matching step is cast into an energy minimization problem. The following, discontinuity preserving regularization is used:
E(D) =X P
(C(p, Dp) +
X
q∈Np
P1[|Dp−Dq|= 1] (1)
+ X
q∈Np
P2[|Dp−Dq|>1].
the neighbourhoodNpof each position p. T is 1 if the
argu-ment is true, and 0 otherwise. The penaltyP1 is added for all
disparity changes equal to one pixel. At larger discontinuities (disparity change>1 pixel), a fixed costP2is added. This cost
function favours similar or slightly changing disparities between neighbourhood pixels, and thus stabilises not only the matching in image areas with weak contrast, but also allows large disparity jumps in areas with high contrast.
Minimising Eq. 1 for two dimensional neighbourhoodsNpis an
NP-complete problem, for which no efficient algorithms exist. In SGM, the minimisation is performed by aggregating the cost along 8 or 16 paths. The cost aggregation is described in detail in the original paper (Hirschm¨uller, 2008). The disparity mapDis computed by finding the minimum aggregated cost for each pixel
pin the first image. Subpixel accuracy is archived by fitting a lo-cal parabola to the aggregated costs around the minimum. Match-ing is performed from first to the second and second to the first image, and only consistent disparities are kept. Small, indepen-dent disparity segments are iindepen-dentified and removed as outliers. The disparity image is reprojected into a DSM with the desired projection and grid spacing. Holes are filled using inverse dis-tance weighted interpolation.
3 EVALUATION
The Worldview-1 and Cartosat-1 datasets from the ISPRS Match-ing Benchmark (Reinartz et al., 2010) are used in this paper. The test region in Catalonia, near Barcelona has been selected due to the availability of several stereo satellite datasets and a good ref-erence data set provided by the Institut Cartogr`afic de Catalunya (ICC).
In order to be able to investigate different surfaces and for easier data handling and comparison, three smaller areas (each of a 4 km x 4 km size) have been selected according to their properties (see Table 1 and Fig. 1)
Figure 1: Cartosat-1 image showing the three test areas.
Test area Lower left Area type 1. Terrassa 417400E
Table 1: Position and properties of the selected test areas. The size of each area is 4 km x 4 km. Coordinates are in UTM Zone 31 North.
3.1 Reference Data
The primary reference dataset used in this paper is a 3D point cloud acquired by airborne laser scanning with a density of ap-proximately 0.5 points per square meter. The laser point cloud data is georeferenced in UTM Zone 31 North, ETRS89 and con-tains orthometric heights with respect to EGM 2008. The ortho-metric heights were converted to ellipsoidal heights by simply adding the undulations from EGM 2008. Only the first pulse re-turns is used in this study, as the DSM produced by image match-ing corresponds to the visible surface. The LIDAR data for the Terrassa and Vacarisses test areas was acquired on 26th and 27th November 2007. The LaMola LIDAR data was acquired on 26th November 2007 and 4th May 2008.
3.2 Cartosat-1
The test areas are covered by a Cartosat-1 Stereo pair with a ground resolution of2.5mand a stereo angle of31◦
. Larger shadow areas are visible, as the data has been acquired on the 5th of March 2008. Fig. 1 shows the Cartosat AFT image of the three evaluated test areas.
3.3 Worldview-1
A Worldview-1 Stereo pair acquired on the 29th August 2008 is used. The stereo angle of the pair is34◦
. One image was acquired with an off nadir angle of4◦
and a ground resolution of 0.5 m, the other with an off nadir angle of33◦
and a ground resolution of 0.66 m.
3.4 Evaluation procedure
Stereo matching was performed using Semiglobal Matching, with parametersP1 = 300andP2 = 1000, using a9x7pixels
win-dow for the Census transform. After the matching points were projected into UTM Zone 31 North and sampled into a DSM with two times the GSD, i.e.5m for Cartosat-1,1m for Worldview-1. Holes were filled with inverse distance weighted interpolation.
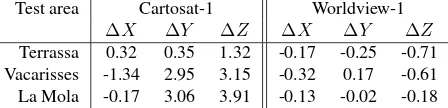
First, the X,Y,Z Shift of the unfilled DSMs with respect to the reference point cloud is estimated, to ensure that the evaluation is not biased by errors in the orientation of the satellite images. The results are reported in Table2.
Test area Cartosat-1 Worldview-1
∆X ∆Y ∆Z ∆X ∆Y ∆Z
Terrassa 0.32 0.35 1.32 -0.17 -0.25 -0.71 Vacarisses -1.34 2.95 3.15 -0.32 0.17 -0.61 La Mola -0.17 3.06 3.91 -0.13 -0.02 -0.18
Table 2: 3D shifts between the DEMs and the LIDAR points. Unit:m
Figure 2: Different subareas in the Terrassa area. Yellow: City; Blue: Industrial; Purple: Bridges; Orange: Residential; Green: Fields, Red: Changes .
orientation or the complex scene structure and the resolution dif-ference of the LIDAR point cloud and the Cartosat DSM. City areas with many vertical surfaces are not ideal for our 3D align-ment, which is based on height differences between the point cloud and the DSM. The shifts for Worldview-1 are very con-sistent, except for a smallerZdifference in the La Mola area.
After the DSMs have been shifted to fit the LIDAR data, the eu-clidean distancedbetween the LIDAR points and the filled DSM surface is computed. For this purpose, the DSM surface is ap-proximated by triangles. We compute a “signed” euclidean dis-tance: positive values for LIDAR points above the DSM surface, negative values for LIDAR points below the DSM surface.
As the DSMs generated by stereo matching and to a lesser extend the LIDAR points might contain outliers which violate the as-sumption of a normal distribution, we follow (H¨ohle and H¨ohle, 2009) and compute measures based on robust statistics, in addi-tion to the classical mean and standard deviaaddi-tion values. This includes the medianQ0.5(d)as a robust estimate for the mean
height difference, the normalized median deviation (NMAD)
NMAD= 1.4826medianj(|dj−mediani(di)|) (2)
as a robust estimate of the standard deviation, and 68% and 95% quantiles of the absolute error. We do not report RMSE, as the DSM alignment leads to a zero mean difference distribution, and RMSE is thus practically identical with the standard devation.
The difference statistics are computed for the whole image and for land cover types. Fig. 2 shows the manually labeled areas for per class evaluation. Areas marked as “Change” are not con-sidered. As the other test areas do not offer a large varity of land cover types, no landcover specific evaluation is performed there, except masking out the quarry and the waste dump in the Vacarisses area, and the upper right corner in the LaMola area, as it is not covered by the Cartosat-1 scene.
The results of the statistical evaluation are shown in Table 3 for Cartosat-1 and Table 4 for Worldview-1.
Test area Mean Med Std NMAD AQ68 AQ95 Terrassa 0.03 0.00 3.44 2.07 2.29 6.83 Vacarisses -0.16 0.07 4.05 2.80 2.97 7.45 La Mola -1.21 -0.03 8.18 3.69 3.90 12.64 Field 0.19 0.13 1.99 1.25 1.31 3.90 Bridge 1.22 0.28 4.86 2.12 2.27 12.18 Industrial -0.10 -0.10 3.11 2.33 2.49 6.19 Residential 0.49 -0.08 3.90 2.64 2.88 8.28 City -0.56 -0.64 5.63 3.88 4.16 10.36
Table 3: Statistical evaluation of the euclidean distance between LIDAR reference points and the Cartosat-1 DSMs. The statistics for different landcover types were computed on the Terrassa area with the masks shown in Fig.2.
Test area Mean Med Std NMAD AQ68 AQ95 Terrassa -0.07 -0.01 2.90 0.64 0.75 5.87 Vacarisses 0.20 0.03 3.72 1.08 1.41 7.80 La Mola -0.13 0.02 4.71 1.28 1.79 9.26 Field -0.04 -0.01 1.46 0.34 0.36 1.72 Bridge -0.25 0.11 3.10 0.51 0.60 5.55 Industrial -0.32 -0.08 2.57 0.63 0.73 5.53 Residential 0.37 0.09 3.34 0.88 1.13 7.66 City -1.22 -0.42 4.73 0.93 1.35 11.04
Table 4: Statistical evaluation of the euclidean distance between LIDAR reference points and Worldview-1 DSMs.
A small median and mean shifts are observed for all areas, ex-cept for the City and Bridge subsets. Bridges could not be re-constructed in the Cartosat-1 DSM, and are only partially recon-structed in the Worldview-1 DSM, resulting in positive difference values. For City areas, the DSMs heights are above the refer-ence. Inspection of the differences in the densely build up city area show that while the buildings have been reconstructed par-tially, no points on the roads could be matched due to the large stereo angle of the datasets. The building heights are thus in-terpolated into the roads areas, resulting in a negative mean and median distance.
The standard deviations for Worldview-1 are only slightly lower than for Cartosat-1. This is suprising, we would expect a a better performance of Worldview-1. The NMAD values, which are a robust measure for the variability of the error distribution, show that the Worldview-1 results are clearly better than the Cartosat-1 results. This is also supported by visual inspection, cf. Fig. 6. It shows the large difference in detail between the Worldview-1 and Cartosat-1 DSMs, which is not obvious from the statistical analysis, particularly from the mean and standard deviations in Tables 3 and 4. The histogram for the Worldview DSM of the Vacarisses area is shown in Fig. 3, and visualises the deviation from a normal distribution. Comparison of high resolution DSMs should thus not be based on RMSE, mean or standard deviation, but needs to be performed using robust accuracy measures such as Median, NMAD and quantiles (H¨ohle and H¨ohle, 2009).
20 15 10 5 0 5 10 15 20
Figure 3: Histogram of errors for Worldview-1 Vacarisses DSM, showing the deviation from the normal distribution. The red curve are the expected counts from a normal distribution with mean andσestimated from the error distribution with the stan-dard techniques. The mismatch happens due to the heavy tails.
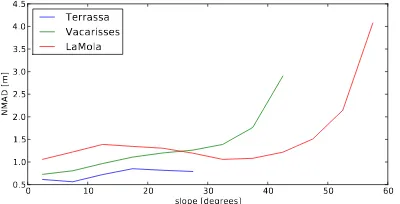
0 10 20 30 40 50 60
Figure 4: Dependency of DSM error on surface slope for Worldview-1 DSMs.
the Vacarisses area, no linear trend is visible for La Mola. For the Terrassa area, a dependency of the error on the surface slope is visible, too, but not as pronounced as in the other test areas. Most flat areas are covered by buildings, leading to higher errors in the 0 - 5 degree class than in the 5 - 10 degree areas.
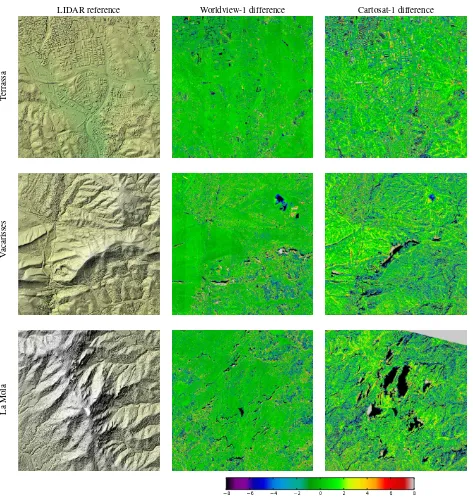
A shaded reference DSM and euclidean distance error maps av-eraged over a 5x5 m grid are shown in Fig. 5. Both Cartosat-1 and Worldview-1 perform best on the Terrassa area, except for the challenging City area. Larger errors are obtained for the hilly and forested Vacarisses and La Mola areas. The steep cliffs in the La Mola area are particularly challenging, due to the strong variability of the terrain, and the large shadows, especially in the Cartosat-1 scene acquired early in the year. A slight striping pat-tern in scanning direction is visible in the Worldview-1 differ-ences of the Terrassa and Vacarisses areas. The difference is in the range of 0.1 to 0.3m. The origin of this artifact is unclear, further investigations are needed.
4 CONCLUSIONS
DSMs generated from Worldview-1 and Cartosat-1 stereo scenes have been evaluated using a LIDAR reference surface, for full scenes and selected landcover classes. The results highlight that robust accuracy measures, such as median, and median absolute deviation should be used for the comparison of high resolution DSMs, as outliers are always present due to matching errors, temporal changes, or different acquisition characteristics of the reference dataset. In addition to the statistical evaluation, a vi-sual inspection is performed, as the statistical accuracy measures cannot convey all characteristics of the generated DSMs.
The generated DSM show problems in city areas, due to the large stereo angle. Experience of the authors show that matching of
complicated city structures is greatly improved when stereo data with smaller stereo angles, for example with15◦
is available. While IKONOS, GeoEye-1, Worldview-1 and Worldview-2 are capable of acquiring stereo scenes with even smaller stereo an-gles, no such dataset is currently available for the ISPRS match-ing benchmark site.
Further work will include the refinement of the evaluation pro-cess, and development of an evaluation system for standardised comparison of DSM generated with different matching algorithms. Currently, every group performs its own analysis, possibly using different quality measures and image subsets. Every user of the ISPRS matching benchmark datasets is asked to share the gener-ated DSMs for inclusion on the benchmark website.
ACKNOWLEDGEMENTS
Special thanks are given to the data providers for the provision of the stereo data sets, namely: Euromap for the Cartosat-1 data, Digital Globe for the Worldview-1 data and ICC Catalunya for the reference data.
REFERENCES
Heipke, C., Kornus, W. and Pfannenstein, A., 1996. The evalua-tion of MEOSS airborne 3line scanner imagery processing chain and results. Photogrammetric Engineering and Remote Sensing 62(3), pp. 293–299.
Hirschm¨uller, H., 2008. Stereo processing by semi-global match-ing and mutual information. IEEE Transactions on Pattern Anal-ysis and Machine Intelligence 30(2), pp. 328 – 341.
Hirschm¨uller, H. and Scharstein, D., 2009. Evaluation of stereo matching costs on image with radiometric differences. IEEE Transactions on Pattern Analysis and Machine Intelligence 31(9), pp. 1582–1599.
H¨ohle, J. and H¨ohle, M., 2009. Accuracy assessment of digital elevation models by means of robust statistical methods. ISPRS Journal of Photogrammetry and Remote Sensing 64(4), pp. 398 – 406.
Reinartz, P., d’Angelo, P., Krauß, T., Poli, D., Jacobsen, K. and Buyuksalih, G., 2010. Benchmarking and quality analysis of dem generated from high and very high resolution optical stereo satel-lite data. ISPRS.
Reinartz, P., M¨uller, R., Lehner, M. and Schroeder, M., 2006. Accuracy analysis for dsm and orthoimages derived from spot hrs stereo data using direct georeferencing. ISPRS Journal of Photogrammetry and Remote Sensing 60(3), pp. 160 – 169.
Zabih, R. and Woodfill, J., 1994. Non-parametric local trans-forms for computing visual correspondence. In: ECCV ’94: Pro-ceedings of the Third European Conference-Volume II on Com-puter Vision, Springer-Verlag, London, UK, pp. 151–158.
LIDAR reference Worldview-1 difference Cartosat-1 difference
T
errassa
V
acarisses
La
Mola
8 6 4 2 0 2 4 6 8