3D MODEL GENERATION USING OBLIQUE IMAGES ACQUIRED BY UAV
A. Lingua a*, F. Noardo a, A. Spanò b, S. Sanna a, F. Matrone b
a
- Department of Environment Land and Infrastructure Engineering (DIATI)- Politecnico di Torino Corso Duca degli Abruzzi 24, 10129 Torino (Italy) ([email protected], [email protected], [email protected])
b
Department of Architecture and Design (DAD)- Politecnico di Torino Viale Mattioli 39, 10125 Torino (Italy) ([email protected], [email protected])
Commission I, WG I/6; Commission IV, WG IV/2
KEY WORDS: UAV, oblique images, flight plan, SfM, cultural heritage, open source
ABSTRACT:
In recent years, many studies revealed the advantages of using airborne oblique images for obtaining improved 3D city models (including façades and building footprints). Here the acquisition and use of oblique images from a low cost and open source Unmanned Aerial Vehicle (UAV) for the 3D high-level-of-detail reconstruction of historical architectures is evaluated. The critical issues of such acquisitions (flight planning strategies, ground control points distribution, etc.) are described. Several problems should be considered in the flight planning: best approach to cover the whole object with the minimum time of flight; visibility of vertical structures; occlusions due to the context; acquisition of all the parts of the objects (the closest and the farthest) with similar resolution; suitable camera inclination, and so on. In this paper a solution is proposed in order to acquire oblique images with one only flight. The data processing was realized using Structure-from-Motion-based approach for point cloud generation using dense image-matching algorithms implemented in an open source software. The achieved results are analysed considering some check points and some reference LiDAR data. The system was tested for surveying a historical architectonical complex: the “Sacro Monte di Varallo Sesia” in north-west of Italy. This study demonstrates that the use of oblique images acquired from a low cost UAV system and processed through an open source software is an effective methodology to survey cultural heritage, characterized by limited accessibility, need for detail and rapidity of the acquisition phase, and often reduced budgets.
*
Corresponding author
This contribution has been peer-reviewed.
1. INTRODUCTION
Some innovative methods were recently developed for 3D mod-elling buildings and built environment in quick times. Images acquired with the oblique axis of the camera are used in photo-grammetric processing, in addition to the images acquired with nadir axis direction. The method was already experimented in the years 2008-2009 using airborne imagery (Höhle, 2008), however, the more recent integration of computer vision algo-rithms (Szeliski, 2010) in common software tools, critically in-crease the method potentialities. Moreover, in recent years, im-ages acquired by Unmanned Aerial Vehicles (UAVs) were used for achieving higher levels of detail in 3D models: a UAV can flight closer to the object and has a better accessibility to narrow spaces (Gerke, 2009). The use of oblique images for generating 3D models allows the reconstruction of the geometry and tex-ture including the vertical or inclined surfaces of the surveyed objects. Furthermore, this technique permit the measurement and survey of the higher parts of the objects, which are not easi-ly achievable by the common survey techniques, such as terres-trial laser scanning (TLS) or terresterres-trial photogrammetry. Another advantage of the method is the possibility to employ some low cost instruments, compared to the traditionally employed ones for performing aerial photogrammetry with oblique images (Feifei et al., 2012). In fact, a common compact camera can be used for acquiring the images.
Finally, the acquisition is performed in a little amount of time, which makes the technique suitable when it is necessary to repeat the survey many times, for example for monitoring reasons, or in emergency cases, when not so much time is available.
All these characteristics make the method suitable to document the built cultural heritage, also as integration of the affirmed high level of detail 3D documentation systems: the aerial photogrammetry (and UAV photogrammetry) with nadir images (e.g. Guarnieri et al., 2004; McCarthy, 2014; Chiabrando, Spanò, 2013, Rinaudo et al., 2012, Chiabrando et al., 2016) can be effectively integrated with the terrestrial laser scanning and terrestrial photogrammetry.
Some tests about 3D modelling of cultural heritage using UAV oblique images were already performed, in particular for singular isolated buildings or archaeological sites (e.g. Fiorillo et al., 2013; Aicardi et al., 2016; Chiabrando et al., 2017). In this study, the solution was tested for surveying a building complex having very intricate and detailed geometry: the “Sacro Monte of Varallo-Sesia”. Provided that for the documentation of cultural heritage, it is recommended to employ and develop replicable systems and methods, giving interoperable results easily exchangeable, we preferred, when possible, open source tools and software, testing their reliability and performance. In particular, in this paper an open source software is tested for processing the oblique images by means of photogrammetry and Structure-from-Motion (SfM) algorithms. The results were evaluated in terms of accuracy, completeness of the data and data density, using as ground truth a model generated by a very spread proprietary software, and a TLS point cloud for comparing the results on some façades.
1.1 The case study: the Sacro Monte of Varallo-Sesia
The case study here surveyed is the ‘Sacro Monte of Varallo -Sesia’. In northern Italy, the particular religious complexes named ‘Sacri Monti’ (Sacred Mountains) are nine, whose con-struction dates back from the 15th to the 17th century (The Sa-cred Mountain Documentation Center has created a database to map about 1800 European devotional complexes. http://www.sacrimonti.net/). The Italian nine complexes were
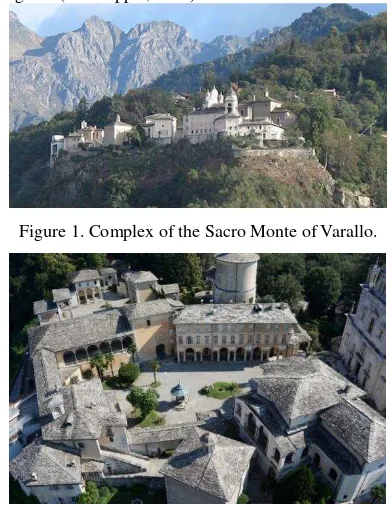
declared UNESCO World Heritage and included in the World Heritage List in 2003. They are characterized by the articulation in a variable number of chapels, representing the Via Crucis scenes by means of scenography representation with statues and frescoes, and architectural works. The Sacri Monti are placed in a piedmont environment, which constitute the landmarks of a devotional journey. The Sacro Monte of Varallo Sesia was the first to be built at the end of the 15th century as a “new Jerus a-lem”, that is, a pilgrimage destination reconstructing an itinerary similar to the one in Jerusalem (Figure 1). It consists of a total of 45 chapels, in some cases gathered to create an urban area (Figure 2) (Piazza del Tempio and Piazza dei Tribunali), there are about 800 statues with true hair and beards and 4000 fres-coed figures (De Filippis, 2009).
Figure 1. Complex of the Sacro Monte of Varallo.
Figure 2. The two main squares: Piazza dei Tribunali (higher part of the image) and Piazza del Tempio in the foreground.
This work was carried out with the aim of updating the high scale map (1:1000) already existing, derived by a classical plotting consequent to airborne photogrammetric method, and implementing the documentation of this UNESCO site with reduced financial and time resources. have different height positions on an extended area
Although, during the past centuries, the thick woods surrounding the chapels has been partially replaced by an anthropic environment with the appearance of Renaissance gardens, the criticality of a high vegetation presence remains throughout all the architectural complex. It generates some disadvantages for the data acquisition phases with both LiDAR and UAV.
some western walls (Figure 3). Such data could not be acquired otherwise, due to the orographic characteristics of the terrain, which is overhanging to the valley.
Figure 3. Oblique image taken with UAV. Western walls not detectable with LiDAR.
Moreover, the survey phases have been also complicated by the historical character of these buildings, with many architectural details. Faithful reproduction of buildings of Christianity, such as the basilica of Nativity in Bethlehem, are replicated in a par-ticularly rich and concentrated composition scheme, offering a scenario similar to a theatrical setting for the representation of sacred scenes. Therefore, longer time for data acquisition and a larger number of laser scans were required.
The data acquisition of the Sacro Monte di Varallo was carried out in July 2016. As usual, different geomatics techniques were employed in an integrated way to reach the required quality of the results. All the acquisitions were georeferenced using reference vertexes measured with GNSS technique, and ground control points (GCPs) acquired by means of topographic methods or GNSS RTK survey. Dense metric data were then measured through a TLS survey, including both internal and external spaces. The UAV photogrammetric survey integrate the upper parts of the objects. The two point clouds (from photogrammetric processing and from laser scanner data), were then combined to reach a complete and homogeneous point cloud, employing some well-known technique (e.g. Bastonero et al., 2014).
Since laser scanner data processing is related to the use of proprietary software and the processing is today largely known, here we focus on the generation of the photogrammetric point cloud from UAV oblique images, employing an open source software: Visual SFM (Wu, 2011).
2. A NON CONVENTIONAL ACQUISITION SCHEMA: OBLIQUE IMAGES FROM UAV
For effectively employing oblique images allowing the observation of vertical structures, some further problems than for acquiring nadir images have to be considered. For example, the occlusion related to the context must be taken into account; the most suitable camera inclination should be chosen; the various Ground Sample Distance (GSD) in the same image and the overlapping considering the different perspective of the objects in consecutive images have to be evaluated. For finding a solution that can better overcome these problems, different configurations of the used camera were evaluated by the scientific community during the years: the Maltese Cross configuration that uses one nadir camera and oblique (45°) sensors pointing the cardinal directions; Fan configuration that increases the swath width along the track to cover more area (Petrie, 2009). These are particular configurations of expensive airborne cameras, installed on traditional aerial platforms. However, since the traditional pictometric cameras used for the first oblique aerial acquisitions are obviously too heavy for UAVs, it was equipped with a common high-performance
digital camera more compact and lighter than the generally used devices. In particular, a SONY ILCE 5100 camera was used, whose parameters are summarized in Table 1. It is a COTS (Commercial Off-the-Shelf), mirrorless and high-performance camera for obtaining of high-quality images with a limited weight, as the ones usually employed for UAV surveys.
Technical specifications of SONY ILCE 5100
N. pixel 24,7 megapixel
Sensor type Sensor CMOS Exmor APS-C
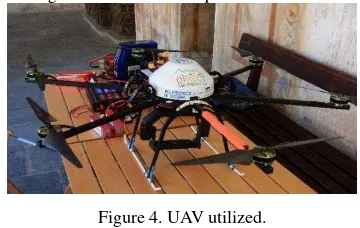
Sensor size 23,5 x 15,6 mm PX01 (Figure 4). It is an exarotor developed by the Politecnico di Torino, DIATI geomatics group. It has a carbon fiber, aluminum and plastic frame with six arms (aluminum profiles with a square cross section of 1 cm thick with a core of 1 mm thick). At the end of each of the arms, a brushless electric motor is installed.
The camera was mounted on a movable stand, equipped with gimbal joints along 3 axis that enable to position the lens orthogonal to the ground for the acquisition of nadir images or to vary the angle for an inclined acquisition.
Figure 4. UAV utilized.
In relation to the specific case study, different approaches were considered before choosing the one here described.
To cover the whole area and give more stability to the photogrammetric block, two flights acquiring perpendicular strips (of nadir images) were performed, using the common overlapping criteria for SfM processing: 80% overlapping between consecutive images and 60% between nearby strips. In these cases, the flight height respect the terrain was 50 m, so that the GSD on the ground was 0.9 cm.
Moreover, a further flight was realized with oblique camera axis in order to collect dense data about the details on the upper parts of the façades, and to test the method for possible expeditious surveys of similar areas. A second flight with oblique camera, in the perpendicular direction, should be a good practice in order to strengthen the block and increase the overlapping of the images for all the acquired details. In this case, however, we employed only one such flight, to test an even more expeditious method.
The flight plan in this case must be cared, since multiple values of the images overlapping and GSDs have to be taken in account. The angle of the camera axis must be determined considering the height of the objects, the height of the flight, the kind of eventual obstructions, the kind and position of details to be acquired on the objects. Moreover, for high objects some attention must be paid to survey the nearest and most remote
This contribution has been peer-reviewed.
parts with similar GSD (solutions could be to change the focal length of the camera in similar flights, to perform different flights, or integrating the model by means of points measured through other techniques).
One preliminary condition in digital photogrammetry is to project the GSD. This is more difficult with oblique images, because they are multiple in the different areas of the image (Grenzdörffer et al., 2008). Some more calculations for defining the GSDs of the oblique images and, consequently, the suitable inclination of the camera, can be useful.
It is important to consider the distance to the photographed objects in the various parts of the image, in order to evaluate their photogram scale and, consequently, the GSDs (Figure 5).
Figure 5. Geometry of an oblique image acquired from a UAV.
For computing the GSD in the minimum and maximum distance of the camera to the object (here called respectively dA and dB),
the following relations (1) (2) (3) and (4) can be used.
�=cosℎ
= ℎ
cos( − )
= ℎ
cos( + )
where h = flight height
= the inclination angle of the camera
y =the viewing angle of the lens in the
direction y of the image, that is, the one in which the image is inclined and therefore, the objects are distorted.
The GSDs of the photogram in each part can be then calculated through the relation:
��� =
∗ �
��where c = focal length, d = considered distance spix =the pixel size.
In this way, it is possible to calculate the GSDs on the ground. It would be more complicated to compute the GSD on the vertical surfaces or higher objects. They are anyway closer to the camera, so that their resolution will be higher.
The results of the calculations in our survey with oblique images are summarized in Table 2.
A M B
d 54.6 m 70.7 m 124.38 m
GSD on the ground 1,06 cm 1.38 cm 2.42 cm
Table 2. GSDs in the various parts of the oblique photograms acquired as in Figure 5.
Another challenging issue of oblique images is the assessment of their overlapping. For estimating this, some empirical measurement was made on the projection of one image on the preceding one (Figure 6). Even if they seem to have a large common part, the overlapping is approximately 70%, which is less than the usual 80% for consecutive images. Moreover, some other issues have to be considered: the change in scale of the photographed features (which is easily solved using SIFT or similar algorithms); the obstruction to some parts of the objects, which can be visible in one image but appear or disappear in the following one.
I
II
Figure 6. Example of consecutive oblique images with underlined an approximated overlapping area (in red in I).
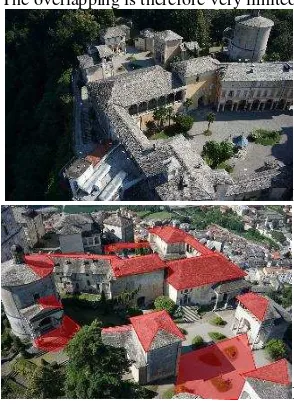
The near strips in this experimented flight plan have a different direction, because the camera is always oriented towards the flying direction. Therefore, the imaged objects are different, except for the roofs and some other details visible from above (Figure 7). The overlapping is therefore very limited.
I
II
Figure 7. Example of the same area acquired in near strips, with opposite flying directions; the overlapping areas are underlined
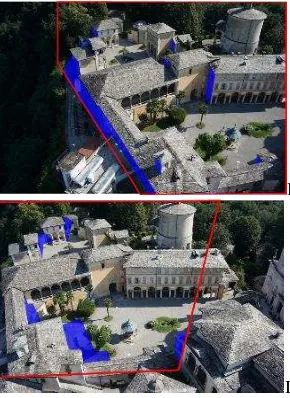
It is therefore necessary to consider the strip after (in the same direction of the first one) in order to assess a transversal over-lapping. In this case, the approximate overlapping is almost 60% (Figure 8), so it is very similar to the usually employed overlapping. However, due to the perspective, some parts of the objects are not visible in both the photograms, and this reduces the existing overlapping in a variable measure, depending on the kind of imaged objects (Figure 9).
I
II
Figure 8. Example of images of two nearest strips in the same flying direction, with underlined an approximated overlapping
area (in red in II).
I
II
Figure 9. Example of images of two nearest strips in the same flying direction (the same in Figure 8), with underlined an approximated overlapping area (with red borderline) and the
respective shadows areas (in blue).
For this reason, the nadir images were processed together with the oblique ones, to strengthen the photogrammetric block. The software was anyway able to extract a quite complete 3D point cloud.
To summarize, the planned trajectories, in order to obtain suitable photogrammetric strips, were disposed as following (Figure 10):
- Flight (I) – strips following one main direction of the built area, with nadir axis of the camera;
- Flight (II) – strips following the perpendicular direction of the flight (a), with nadir axis of the
camera;
-
Flight (III) – in the more complex built zone, strips in a similar direction of the flight (a), with axis of the camera having an inclination of ≈45° towards the flying direction.I II
III
Figure 10. Flight plan with Mission planner. Nadir flights (I and II), and the oblique one (III).
The UAV flight was planned through the MissionPlanner tool, created by Michael Oborne, an open source software that allows the planning of the flight by locating on a georeferenced base map some waypoints that determine the path to be followed. With the camera configuration setting, Mission Planner automatically displays on-screen mission technical specifications and the total flight time including the starting and landing intervals of the aircraft.
3. AN OPEN SOURCE SOFTWARE FOR PROCESSING OBLIQUE IMAGES
The acquired images were processed with an open source software, which allows a further reduction of the costs of the operations and, especially, improves the interoperability and replicability of the processing and results.
A great advantage of open source systems is the possibility to set some customized parameters, when necessary, to improve the processing performance and results.
In this case the open source software VisualSfM, developed by Chanchang Wu in collaboration with the University of Washinton and Google (Wu, 2013), was used for the images alignment by means of the SfM technique. The dense matching plug-in integrated in its interface, PMVS/CMVS, made by Ya-sutaka Furukawa, (Furukawa, Ponce, 2010) was employed to generate the dense cloud.
The use of SfM is based on computer vision systems and algorithms. It defines the unknown interior and exterior camera parameters by automatically matching characteristic features in overlapping images and, consequently, builds the 3D model of the imaged object.
Since 1999, the algorithm called Scale-Invariant Features Transform (SIFT) (Lowe, D., 2004), has allowed automatic detection of feature points in images (features).
Over the years, the SfM has been integrated with dense image
This contribution has been peer-reviewed.
matching algorithms that compute the correspondence between a high number of image pixels. This system, activated on open-source software (e.g. Blunder, PMVS, VisualSFM, IGN MicMac) and proprietary software (e.g. Agisoft Photoscan, Photomodeler Scanner, ContextCapture, and many others) allows the reconstruction of a dense point cloud of objects starting from multi-view images. The SfM technique (Szeliski, 2010) connected with the algorithms for dense image matching is characterized by four work phases:
• Identification of keypoint features in images, through the use of algorithms (e.g. SIFT);
For data processing, however, it is complemented by the PMVS / CMVS plug-in, which allows for the reconstruction of a dense point cloud and its georeferencing through control points. Although the processing is almost completely automatic, it is necessary to control some variables and parameters in order to obtain a correct result. This is even more necessary when using open source software, for which it is often required a wider the matching phases, scaling and georeferencing the clouds), two kinds of data were used: some expressly marked GCPs measured through topographic technique (total station measurement) or GNSS RTK, and some denser data derived by a TLS survey.
Moreover, a TLS survey was performed to acquire the lower parts of the buildings, and some internal spaces.
The used instrument for the LiDAR survey was the FARO CAM2 laser scanner. It is a well-known phase-shift laser scanner: it has a distance accuracy up to ± 2 mm, a range from 0.6 m up to 130 m and an integrated RGB camera that permits the colouring of the cloud. It has the advantage to be low-cost, compared to similar instruments, and to have small dimensions, which is essential for portability reasons.
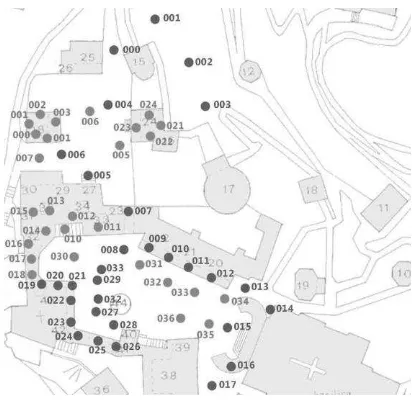
A high number of scans was acquired (Figure 11), so that a very dense point cloud of the lower part of the building complex (only excluding the roofs) is available as a reliable reference for the SfM point cloud. The average accuracy reached in the registration of the scans, using as reference the measured targets employed as GCPs, is 0.46 cm.
Figure 11. Distribution of the acquired scans.
3.2 The SfM-photogrammetric processing
The images of all the flights, totally 377, were processed together in VisualSfM.
In the present work, the data processing analyzes and evaluates the potentialities and criticalities of VisualSFM software, which allowed the alignment of oblique and nadir images together, for the 3D modeling of the Sacro Monte of Varallo Sesia.
VisualSFM can be used through a simplified graphical interface also in Windows operating system. This makes it more user-friendly than other similar tools, e.g. MicMac (Pierrot Deseilligny, Clery, 2011). The interface consists of a single toolbar that allows quick insertion of images and processing through the various integrated algorithms and plug-ins.
The software automatically extracts information about the camera and indicates it to a report window near to the main screen. The “Compute Missing Matches” command identifies matches between images, while the “Compute 3D reconstruction” command defines the images positions and shows a sparse point cloud in a local coordinate system representing the matched features. This phase follows an incremental processing: two first images are matched, and then the others are added. As default setting, the software chooses two images with a high number of features matched. However, if necessary, it is possible to change them manually in order to initialize better the processing and avoid possible errors deriving from a wrong initial reference. This is a great advantage of this open source system. In our case, it was not necessary to change parameters, also because of the very high overlapping of the processed images. For this first phase, the data processing lasted about 4.5 hours, which is a quite short time, compared to similar processing in other software tools. After that, with the “Run Dense Reconstruction” command, available after installation of the PMVS/CMVS plug-in, it was possible to build the dense cloud (Figure 12). This automatic processing took about 6 hours. The final point cloud, composed by more than 19,500,000 points appeared in the main window of the software, and was automatically saved to the installation folder, in .ply format (an open format).
Figure 12. The dense cloud.
4. RESULTS AND DISCUSSION
For analyzing the results, two comparisons were realized. Firstly, the entire final cloud was compared with a similar one processed with a similar well-known proprietary commercial software, Agisoft Photoscan, which reaches very high performances and accuracies, as a number of studies proves. A second analysis was made on two façades. In this case, the portion of the cloud produced by VisualSfM was compared to the one acquired by the laser scanner survey, which is used as a reliable reference. In both cases, the open source software CloudCompare was employed to analyse the clouds.
4.1 The quality of the total produced cloud
The two clouds were compared respect to the following parameres: processing times, density, roughness and homogeneity. A completeness analysis was performed by dividing the clouds into sub-regions with approximately homogeneous density for pointing out the differences in the points distribution and eventually relating them with the images characteristics. In this way, it is possible to understand the behavior of the VisualSfM reconstruction and increase our consciousness for next acquisitions.
A first note on the two software behavior regards the processing times, which are very lower for VisualSfM (4.5 h for the images alignment and sparse cloud generation and 6 h for the dense cloud reconstruction) than for Agisoft Photoscan (respectively, 20 and 24 h). This makes VisualSfM extremely more suitable to obtain expeditious results, for example during emergencies. A first visual analysis make evident how VisualSfM had major problems in areas with more irregular geometries, such as the rich vegetation present in this site. This make the cloud more noisy, especially in that areas, or a lower number of points is there generated (Figure 13).
I II
Figure 13. Point clouds with PhotoScan (I) and VisualSFM. (II)
Analyzing the density, however, it is possible to notice that a high number of points was generated for reproducing the buildings geometry, which is the most important thing in this
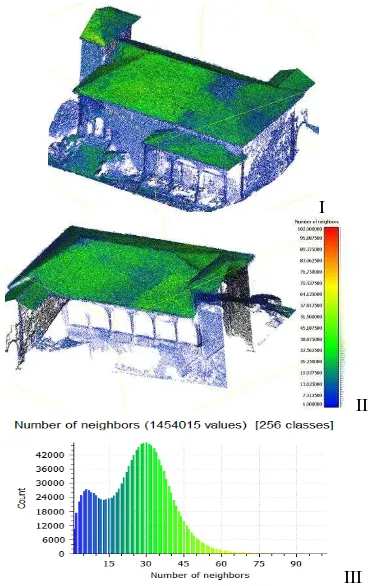
study. Figure 14 shows the density maps of the two point clouds, where it is evident the inhomogeneity in the points distribution. Notwithstanding, in Figure 15 it is represented the density on a single building, including its façades. As one can notice, it is sufficient to represent the required level of detail: the number of points in surface neighborhoods having a radius of 8 cm is approximately 7 on the façades and 30 on the roofs.
I .II
Figure 14. Density analysis of the Photoscan (I) and the VisualSfM (II) cloud.
I
II
III
Figure 15. Density analysis on the SfM cloud of a single building: density map on the two sides of the building (I and II)
and histogram of the points density (III).
This contribution has been peer-reviewed.
A similar study was done for assessing the roughness of the point cloud (Figure 16), that is, the point deviation of the points from the average surface profile of the detected object. In the VisualSFM cloud it is clear how the more noisy areas (with high roughness) correspond to the areas with low densities of points, in which the imaged geometry is more irregular.
I II
Figure 16. Roughness analysis of the Photoscan (I) and the VisualSfM (II) point clouds.
4.2 A specific analysis on a façade
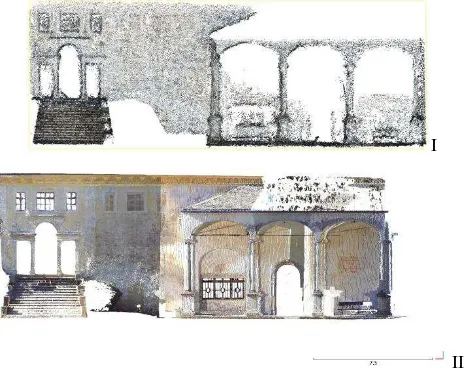
A detailed analysis about the accuracy of the VisualSfM point cloud was then performed comparing the points of some façades with the TLS data. Here is presented an example of such comparison. The two point clouds were segmented for isolating the façades from the other elements of the scene. Moreover, all the objects that could cause noise (e.g. vegetation, too thin elements) were eliminated. A particular case is here presented, because in the example a porch is included. It is a 3D element that could make the accuracy results a little worse; but it is here tested for describing the performances of the methodology also for surveying such kind of more complex data. In Figure 17 the two segments of the point clouds used for the comparison are shown.
I
II
Figure 17. The compared point clouds segments: from VisualSfM (I) and from TLS survey (II).
In this case the density and roughness are not compared, since a high number of scans was performed near this area, and consequently the number of points and their density is very higher. This is however not important for assessing the reliablity of the proposed methodology in this paper: using oblique images from UAV for obtaining an expeditious survey of a historical building complex geometry, with high level of detail. The accuracy of the façade is assessed by computing the
differences between the two clouds using the specific tool in CloudCompare software. The average distance between the clouds is 0.04 m, with a STD of 0.09 m. That means that the acquired data are suitable to obtain metric information having a 1:200 representation scale. In Figure 18 the discrepancies between the clouds are shown.
Figure 18 – Map of the discrepancies between the VisualSfM point cloud segment of a façade and the TLS point cloud.
5. CONCLUSIONS
The paper describes the specific equipment and methodology useful to exploit the great advantages given by the use of oblique images acquisitions from UAV for obtaining complete 3D models of a very complex architectural environment. A suit-able flight plan was projected and tested for acquiring data in as little time as possible, with successful results. The SfM tech-nique permits to achieve a very accurate and dense point cloud. In particular, the used open source software, VisualSfM, realiz-es very rapidly the featurrealiz-es matching and exterior orientation of the images, also respect to other proprietary software. Moreo-ver, the possibility to customize how to initialize the processing could be a great advantage in case of some particular photo-grammetric blocks. In the tested case, the density of the final point cloud is quite inhomogeneous, possibly due to the major overlaps on the roofs (where the points are denser) and to the noise that dispersed some points. Moreover, may be that there is some set computation limits to be changed. Another problem found with the used tool is the limited performance in georefer-encing a wide set of images: only part of them could be export-ed in the correct reference system, given by the measurexport-ed GCPs. In further tests, it could be useful trying to improve the compu-tation possibilities of the tools.
However, the technique permits the collection of a very com-plex and complete information in short time, which is a great advantage for mapping and documentation purposes for cultural heritage sites. Furthermore, the method is absolutely non-invasive, since it can collect data completely from remote areas and without touching the site at all. It also permits to reach little accessible parts of the buildings (such as the higher parts, which are difficult to be recorded by means of other techniques, e.g. TLS). The field of monitoring and documentation of complex and wide cultural heritage sites will have great advantage from the described methodology. Finally, the use of an effective open source software for aligning and orienting the images is the step that will permit the automatic generation of textured 3D models of the sites in an entirely open environment and exchange for-mats (e.g. CityGML). This will be fundamental to complete the open 3D city models including the more complex sites.
6. REFERENCES
Inter-national Archives of the photogrammetry, remote sensing and spatial information sciences, 41, pp. 835-842.
Bastonero, P., Donadio, E., Chiabrando, F., Spanò, A., 2014. Fusion of 3D models derived from TLS and image-based tech-niques for CH enhanced documentation. In: ISPRS Annals of the photogrammetry, remote sensing and spatial information sci-ences. 2, pp.73-80.
Chiabrando, F., Lingua, A., Maschio, P., Teppati Losè, L., 2017. The Influence of Flight Planning and Camera Orientation in UAVs Photogrammetry. A Test in the Area of Rocca San Silvestro (LI), Tuscany. International Archives of the photo-grammetry, remote sensing and spatial information sciences, 42, pp. 163-170.
Chiabrando, F., Di Pietra, V., Lingua, A. M., Maschio, P. F., Noardo, F., Sammartano, G., Spanò, A., 2016. TLS Models Generation Assisted by UAV Survey. International Archives of the photogrammetry, remote sensing and spatial information sciences, 41, pp. 413-420.
Chiabrando, F., Spanò, A., 2013. Points clouds generation using TLS and dense-matching techniques. A test on approachable accuracies of different tools. In: ISPRS annals of the photo-grammetry, remote sensing and spatial information sciences, 5, pp. 67-72.
De Filippis, E., 2009. Guida del Sacro Monte di Varallo, Tipolitografia di Borgosesia, Borgosesia.
Feifei, X., Zongjian, L., Dezhu, G., Hua, L., 2012. Study on construction of 3D building based on UAV images. In: The International Archives of the Photogrammetry, Remote Sensing and Spatial Information Sciences, pp. 469-473.
Fiorillo, F., Fernández-Palacios, B. J., Remondino, F., Barba, S., 2013. 3D Surveying and modelling of the Archaeological Area of Paestum, Italy. Virtual Archaeology Review, 4(8), pp. 55-60.
Furukawa, Y., Ponce, J., 2010. Accurate, dense, and robust mul-tiview stereopsis. IEEE transactions on pattern analysis and machine intelligence, 32(8), pp. 1362-1376.
Gerke, M., 2009. Dense matching in high resolution oblique airborne images. In: International Archives of the Photogram-metry, Remote Sensing and Spatial Information Sciences, 38, W4.
Grenzdörffer, G. J., Guretzki, M., Friedlander, I., 2008. Photo-grammetric image acquisition and image analysis of oblique imagery. The Photogrammetric Record, 23(124), pp. 372-386.
Guarnieri, A., Vettore, A., El-Hakim, S., Gonzo, L. 2004. Digi-tal photogrammetry and laser scanning in cultural heritage sur-vey. In: The International Archives of the Photogrammetry, Re-mote Sensing and Spatial Information Sciences, 35, B5.
Höhle, J., 2008. Photogrammetric measurements in oblique aerial images. Photogrammetrie, Fernerkundung, Geoinformation, (1), pp. 7-14.
Kumpee Teeravech, P. S., 2013. An introduction to 3D reconstruction using VisualSFM and PMVS2/CMVS.
Lowe, D., 2004. Distinctive Image Features from Scale-Invariant Keypoints, Int. Journal of Computer Vision, Vol. 60, pp. 91-110.
McCarthy, J., 2014. Multi-image photogrammetry as a practical tool for cultural heritage survey and community engagement. Journal of Archaeological Science, 43, 175-185.
Petrie, G., 2009. Systematic oblique aerial photography using multi frame cameras. Photogrammetric Engineering & Remote Sensing, 75(2), pp. 102-108.
Pierrot Deseilligny, M., Clery, I., 2011. Apero, AN Open Source Bundle Adjusment Software for Automatic Calibration and Orientation of Set of Images. In: International Archives of the Photogrammetry, Remote Sensing and Spatial Information Sciences, 3816, pp. 269-276.
Rinaudo, F., Chiabrando, F., Lingua, A. M., Spanò, A. T., 2012. Archaeological site monitoring: UAV photogrammetry can be an answer. International Archives of the Photogrammetry, Re-mote Sensing and Spatial Information Sciences, 39(B5), pp. 583-588.
Szeliski, R., 2010. Computer vision: algorithms and applications. Springer Science & Business Media.
Wu, C., 2013. Towards linear-time incremental structure from motion. In 3DTV-Conference, 2013 International Conference on, pp. 127-134. IEEE.
Wu, C., 2011. VisualSFM: A visual structure from motion system. http://ccwu.me/vsfm (accessed 24 May 2017)
Wu, C., Agarwal, S., Curless, B., Seitz, S. M., 2011. Multicore bundle adjustment. In Computer Vision and Pattern Recogni-tion (CVPR), 2011 IEEE Conference on, pp. 3057-3064. IEEE.
Wu, C., 2007. SiftGPU: A GPU implementation of scale invari-ant feature transform (SIFT).
This contribution has been peer-reviewed.