MULTI-SCALE SEGMENTATION OF HIGH RESOLUTION REMOTE
SENSING IMAGES BY INTEGRATING MULTIPLE FEATURES
Yanan Di a, Gangwu Jiangb, Libo Yana, Huijie Liua, Shulei Zhenga
a
R & D Engineer, Beijing SatImage Information Technology Co.,Ltd, China
b
Zhengzhou Institute of Surveying and Mapping,Zhengzhou, China
Chinese library classification number: P237
KEY WORDS: high resolution remote sensing images, multi-scale segmentation, canny edge detector, texture
feature, Mumford Shah - standard, Kruskal algorithm
ABSTRACT:
Most of multi-scale segmentation algorithms are not aiming at high resolution remote sensing images and have
difficulty to communicate and use layers’ information. In view of them, we proposes a method of multi-scale
segmentation of high resolution remote sensing images by integrating multiple features. First, Canny operator is
used to extract edge information, and then band weighted distance function is built to obtain the edge weight.
According to the criterion, the initial segmentation objects of color images can be gained by Kruskal minimum
spanning tree algorithm. Finally segmentation images are got by the adaptive rule of Mumford –Shah region
merging combination with spectral and texture information. The proposed method is evaluated precisely using
analog images and ZY-3 satellite images through quantitative and qualitative analysis. The experimental results
show that the multi-scale segmentation of high resolution remote sensing images by integrating multiple features
outperformed the software eCognition fractal network evolution algorithm (highest-resolution network evolution
that FNEA) on the accuracy and slightly inferior to FNEA on the efficiency.
1. INTRODUCTION
Image segmentation is the premise of object-oriented high resolution remote sensing image analysis. Accurate segmentation determines the success or failure of subsequent remote sensing image processing. Image segmentation is that the images dividing into several connected regions do not overlap each other according to certain rules. The algorithms are going based on the two basic characteristics of general brightness values, namely discontinuity and similarity. The first kind of method is based on the brightness of the discontinuous changes, such as the edge of the image, etc. Other is dividing images into the similar area according to the standards set, the threshold processing, for examples, threshold processing,
regional growth, region separation and aggregation(Rafael C G,2002). With the enlargement of the application domain, image segmentation gradually becomes the key technology in the field of remote sensing image processing, pattern recognition and computer vision.
2. RELATED WORKS
Since the advantage of remote sensing image
object-oriented information extraction is more and
more obvious, many scholars has been done a lot of
research on the issues of multiple features fusion,
multi-scale and multi-temporal high resolution
remote sensing image segmentation. Especially the
spectrum graph theory is widely used in data
segmentation(Zhang Tao,2009;Cui Weihong, 2010).
The idea of adopting graph theory technology to
image segmentation was first put forward in 1971 by
Zahn(1971). He used the Minimum spanning tree of
graph theory (Minimum spanning tree) for the study
of clustering and image segmentation. Although the
initial processing method is simplest, but it is widely
used in computer vision. Since then, international
developed a variety of image segmentation methods
based on graph theory(Shi J, Malik J, 2000; Boykov
Y, Jolly M P,2001; Grady L, 2006; Grady L, Eric L,
Schwartz, 2006.). On the basis of Zahn's research,
Felzenszwalb(2004) combined with minimum
spanning tree algorithm and region merging method,
and put forward a fast minimum spanning tree
method based on adaptive threshold (FH)(Ye wei,
Wang Yuanjun, 2009). The method achieved
segmentation by measuring and comparing the
similarity and the regional differences to determine
whether to merge the two regions, but it did not take
the influence of other features into account. Then
YeWei(2009) put forward new optimization method
which combined the minimum spanning tree
algorithm with Mumford Shah theory, and got the
good segmentation effect, but the segmentation rate
was slower. The multi-scale and multi-level
segmentation method(CUI W H, ZHANG Y,2011)
was proposed based on minimum spanning tree, and
successfully used in high resolution remote sensing
image segmentation. However region shape feature
was unused in the process of region merging.
Literature(Wu Zhao cong,2013) proposed a
comprehensive utilization of spectrum, texture and
shape information segmentation method. It could
effectively improve the quality of segmentation for
the relatively rich areas of the texture information
comparing with software eCognition fractal network
evolution algorithm (highest-resolution network
evolution that FNEA) methods, but the method was
not combined with the feature of edge information
and context and so on. To further enhance the
multi-scale remote sensing image segmentation
automated and adaptive level, considering the above
methods, a method of multi-scale segmentation of
high resolution remote sensing images by integrating
multiple features is presented.
3. METHODS
Although FH method can quickly segment the
different nature of the regions, but it only considers
the spectrum information of pixels in a particular
area, and gets a coarse segmentation result. Based on
the characteristics of high resolution remote sensing
images, multi-scale segmentation by integrating
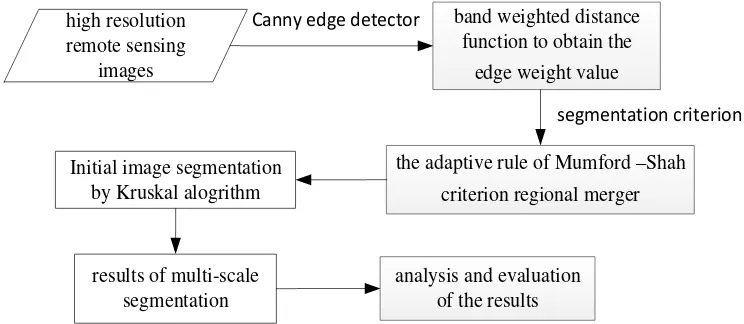
multiple features is put forward. The technical
process is shown in Figure 1:
band weighted distance
the adaptive rule of Mumford
–
Shah
criterion regional merger
Figure 1. The technical process of multi-scale segmentation by integrating multiple features
3.1 edge extraction by Canny operator
The edges of the objects are the basic characteristics
of image. The edge determination and extraction is
very important for the entire image scene recognition
segmentation. The Canny operator using one-order
partial derivatives of finite difference to calculate the
amplitude and direction of the gradient is used
widely. It is mainly modeling for brightness changes
on the step-edge, which is the local extreme points of
Gaussian smoothing filter(John Canny,1986).The
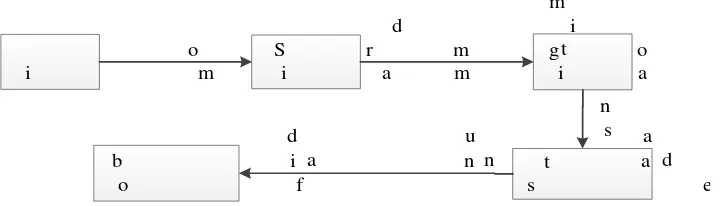
flow of Canny operator extracting edges is shown in
Figure 2.
Figure 2. Canny operator edge extraction flow
According to the Canny operator definition and scale
space theory, the edge detection gains in scale
space. It means that the Canny operator can obtain
multi-scale edges by different .
3.2 Band weighted distance function to
obtain the edge weight value
The image is taken as an undirected graph G=(V,E)
and image pixel as the vertex figure i
v V .Each of
the adjacent edge ( ,v vi j)E contains a
corresponding weight w(vi,vj), which is not a
negative and is the pixel difference in the two
vertices used to describe no similarity between two
adjacent vertices. Considering the high resolution
multispectral image features, if the band combination
and the weights of different wave band are chosen
appropriately, it can effectively distinguish the
specific goal, so band weighted Euclidean distance is
suited to construct the edge weights. The concrete
calculating formula is generated as in equation(1):
2
Where w(u,v) is connecting adjacent vertices (pixels)
u and the edge v weights, l is the band number, wi is
In the process of object-oriented segmentation,
the edge of the band combination has better
consistency and larger differences between regions
each other. The standard deviation of each band is
selected to calculate band weights. Each band weight
calculation formula is equation (2):
wii/ li 1i (2)
Where wi = weight of the band
l = number of the band
i
= standard deviation of a bandWe add the edge information and conduct image
smoothing when structuring the edge weight graph.
That means to establish scale space image and
choose the corresponding edge detection scale to
build the graph model. Edge weights are calculated
as in equation (3):
where w(u,v)= result of edge detection .
3.3 Segmentation algorithm based on
minimum spanning tree
It is on the basis of image graph model that
Segmentation algorithm based on minimum
spanning tree adopts the bottom-up (merger) strategy
to generate multiple minimum spanning tree
according to certain principles. The clustering
(l) An edge is linked together by using
adjacency between two pixels usually called four
neighborhood or eight neighborhood. Edge weights
are calculated by the dissimilarity measure of four
vertices corresponding eigenvector. The graph
model are built by combining these elements.
(2) With the Kruskal algorithm, the edges are
sorted in Non-decreasing order of weights, and
construct the minimum spanning tree from the edge
with minimum weight.
(3) If the current edge weights meet the
segmentation criteria , it is added to spanning tree,
otherwise not.
(4) Repeating step (3) until the current edge
weight value is greater than the set value.
Segmentation is growing process of the edge of
the tree from the bottom up as each spanning tree
corresponding to the image in the area. The growth
of the edge merge and stop criterion is the key to
minimum spanning tree segmentation method, we
count the spectrum, texture, shape and other
characteristics and define region adjacency graph by
region edge weight function which is designed to
look region as vertex. Region edge weight function
as the measurement of feature difference is also the
cost function of region merging. Therefore we take
the feature fusion that is the best regional feature
differences into a weight function to make the
minimum edge weight in the same type adjacent
region.
Mumford and Shah have put forward Mumford-Shah
model to represent the segmentation, and transform
the optimal segmentation into minimize Mumford
Shah - energy function (namely the minimum fitting
error). Koepfler has simplified the Mumford Shah
model as in equation (4):
2
criterion as in equation (5):
2 iteration merge to get different segmentation results.
Redding has put forward the improved
full-schedule, the merging criteria for equation (6).
2 differentgain the multi-scale segmentation results
based on the most applicable principles.
Considering the complexity of terrain and the
richness of texture information in the high resolution
remote sensing images, we put forward the
improvement scheme which add texture
heterogeneity in Mumford-Shah measure simplified
model, and conduct adaptive weighted heterogeneity
of spectrum and texture information. Multi-scale
rotation invariant LBP histogram H represent texture.
We calculate weighted coefficient through regional
distribution of standard deviation, then the region
merging criteria can be rewritten as in equation (7).
2 2
represents that the distance2 calculates
weight coefficient wcolorand wtextureare determined
by the self-adaption as in equation (8).
max( 1, 2), 1 max( 1, 2)
Segmentation quality evaluation is used to adopting
qualitative analysis of segmentation results, but the
artificial method accuracy is affected relatively
largely by subjective factors. Therefore the
quantitatively and objectively evaluation of
segmentation results is very important. In this paper,
the efficiency and accuracy is dealt with
time-consuming and Rand index.
Rand Index indicates the uniformity of the clustering
results and the original data set of sample distribution.
Presently using for segmentation accuracy
evaluation is completely possible. For a given set of
points X
x x1 2, ,...,xn
, ( )
( ), ( ),..., ( )
reference data, and U is the clustering result, m are
the number of points in U( )s and U appeared in the Obviously, RanIndex values are between [0,1].
When both the conditions are entirely consistent with
each other, RanIndexis 1.
4. THE EXOERIMENTAL RESULTS
AND ANALYSIS
In order to verify the validity of the method in this
paper, the experiments adopt analog images and high
resolution remote sensing images of radiation
correction and geometry correction. A better
segmentation results can get by the following
parameters under the same scale parameter through a
number of experiments: edge double threshold can
be [28,70], andcolor0.9,compact0.5.
4.1 Analog image Multi-scale segmentation results and analysis
Analog image data are image samples extracted by
the combination of remote sensing images. The
image size is 512 × 512 pixels, where different colors
represent different ground objects, and the four
regions have different textures, shown in Figure 3. A
lot of experiments have been proceeded to set the
same parameters for software eCognition and
algorithm depending on the different scales, the
results shown in Figure 4. The accuracy of the results
obtained by statistics for the quantitative evaluation
is shown in Table 1.
(a) Analog image (b) Reference image
(a) Software eCognition (b) this method (c) Software eCognition (d) this method
50
Scale Scale100
(e) Software eCognition (f) this method
150 Scale
Figure 4. Segmentation results of the analog image
Scale 50 100 150
consuming time(/s) Software eCognition 1.279 1.186 1.170
this method 1.467 1.591 1.685
Rand Index Software eCognition 0.411 0.497 0.396
this method 0.966 0.977 0.995
Table 1. The quantitative assessment of the segmentation results of analog image
Segmentation results can be seen from Figure 4,
there are obvious error segmentations at each scale in
the software eCognition. In a smaller scale,
over-segmentation phenomenon exists, and the
texture and edge information is not sensitive, such as
the lower part of the same object, but this method
does not have the problem substantially because of
the addition texture information; with the scale
increasing, there is under-segmentation phenomenon
where the upper left corner is not split out, however
this method has carried around a good segmentation
in a result of the edge constraint. Table 1 from a
quantitative analysis can be drawn: although this
method is not as efficient as segmentation software
eCognition, but Rand Index is significantly higher
than software eCognition, thus segmentation results
are greatly improved.
4.2 ZY-3 satellite image multi-scale
segmentation results and analysis
Analog image segmentation is not sufficiently
proving the efficiency of this method, so
confirmatory experiments use a resolution of 4m real
ZY-3 satellite image and the reference image (Figure
5). The image size is 986 × 596 pixels, where the
figure has houses, roads, bare land and other ground
objects. Multiple sets of experiments are conducted
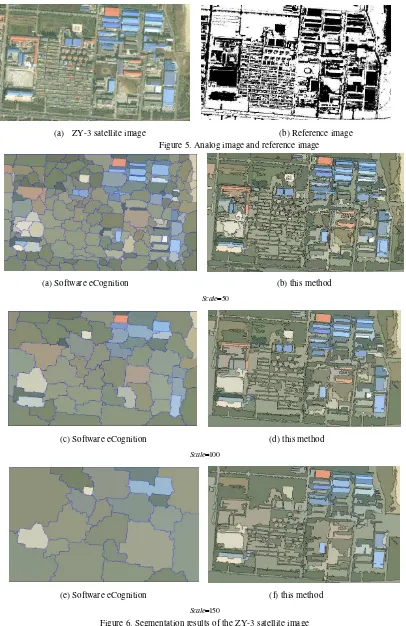
to obtain the results shown in Figure 6, the results of
(a) ZY-3 satellite image (b) Reference image Figure 5. Analog image and reference image
(a) Software eCognition (b) this method
50 Scale
(c) Software eCognition (d) this method
100 Scale
(e) Software eCognition (f) this method
150 Scale
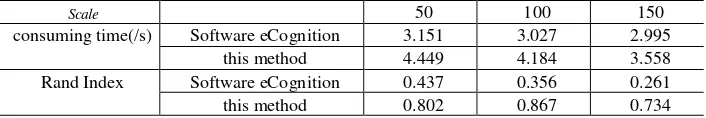
Scale 50 100 150 consuming time(/s) Software eCognition 3.151 3.027 2.995
this method 4.449 4.184 3.558
Rand Index Software eCognition 0.437 0.356 0.261
this method 0.802 0.867 0.734
Table 2.The quantitative assessment of the segmentation results of ZY-3 satellite image
Segmentation results can be obtained from Figure 6,
when dealing with relatively crushing ground objects,
error segmentation from software eCognition is very
obvious, especially roads and other objects needing
edge information, and other fields with a textured
ground objects. From Table 2, Quantitative analysis
can be drawn: Rand Index of this method is much
higher than the software eCognition, and
segmentation effect is clearly better. Because of
obvious over-segmentation and under- segmentation
in the software eCognition, this method is well
integrated various features to limit its segmentation
errors. Especially through the strategy of adaptive
Mumford-Shah model region merging by integrating
texture features, it is reduced in the multi-scale
segmentation errors and the dependence of the scale
parameters. With the image size increasing, the
segmentation efficiency of this method is a little
lower than software eCognition, but these problems
can be optimized, either through hardware GPU
acceleration or improving processing speed of the
algorithm.
5. CONCLUSIONS
Based on the use of the layers information of
high-resolution images, we propose a method of
multi-scale segmentation of high resolution remote
sensing images by integrating multiple features. The
method extracts edge information by canny operator,
and constructs from the function to obtain a weighted
band edge weight value, according to certain
segmentation criteria, then obtains an image of the
original objects using Kruskal minimum spanning
tree algorithm. Last simplified Mumford -Shah
model is used to merge regions by spectral
information and texture information to get the
segmentation results. The method is not only
adopting the edge, texture and other information of
high resolution images to improve the accuracy of
multi-scale segmentation, but also having on
adaptive Mumford-Shah criteria region merging to
avoid the uncertainty of artificial setting parameters.
After a lot of experiments, the proposed algorithm
has better segmentation effect than FNEA algorithm
of software eCognition. The method combined with
a variety of features for image segmentation, but is
not yet implemented fully automatic segmentation
feature fusion. We will focus on unsupervised
segmentation method of high resolution remote
sensing images by integrating multiple features, in
order to obtain the high segmentation accuracy, fast
speed of operation and automatic segmentation.
REFERENCES
Rafael C G, Richard E W, 2002. Digital Image
Processing[M]. Second Edition. New Jersey:
Prentice Hall.
Zhang Tao, Hong Wenxue, 2009. Texture image
analysis based on graph theory[J]. photon
technology, 35(6):825-831.
Cui Weihong, 2010. Research on Graph Theory
Based Object oriented High Resolution Image
Segmentation[D]. Dissertation for the Ph.D of
wuhan University, P.R.China.
Zahn,C.T, 1971. Graph-Theoretical Methods for
Detecting and Describing Gestalt Clusters[J]. IEEE
Transactions on Computers., 20(1):P.68-86.
Shi J, Malik J, 2000. Normalized cuts and image
segmentation[J]. IEEE Transactions on Pattern
Analysis and Machine Intelligence. 2(8): 888-905.
Boykov Y, Jolly M P,2001. Interactive graph cuts
for optimal boundary and region segmentation of
objects in n-d images[C]. IEEE International
Conference on Computer Vision. 105-112.
Grady L, 2006. Random walks for image
segmentation[J]. IEEE Transactions on Pattern
Analysis and Machine Intelligence, 28(11):
1768-1783.
Grady L, Eric L, Schwartz, 2006. Isoperimetric
segmentation[J]. IEEE Transactions on Pattern
Analysis and Machine Intelligence. 28(3): 469-475.
FELZENSZWALBPF, HUTTENLOCHERDP,2004.
Efficient Graph-based Image Segmentation [J].
International Journal of Computer Vision.
59(2):167-181.
Ye wei, Wang Yuanjun, 2009. Minimum Spanning
Tree Image Segmentation Method Based on
Mumford-Shah Model[J]. Journal of
Computer-Aided Design & Computer Graphics,
21(8):1127-1134.
CUI W H, ZHANG Y, 2011.An Effective
Graph–based Hierarchy Image Segmentation[J].
Intelligent Automation & Soft Computing,
17(7):969-981.
Wu Zhao cong, HU Zhongwen, ZhANG qian, et al.
2013. On combining spectrum、texture and shape
features for Remote sensing image segmentation[J].
Journal of surveying and mapping, 42(1):44-50.
John Canny, 1986. A Computational Approach to
Edge Detection [J]. IEEE Trans. Pattern Analysis
and Machine Intelligence (S0162-8828),