HIGH RESOLUTION SURVEY OF PHAISTOS PALACE (CRETE) BY TLS
AND TERRESTRIAL PHOTOGRAMMETRY
M. Fabris a, *, V. Achilli a, G. Artese b, D. Bragagnolo a, A. Menin a
a DCEAE-LRG, Department of Civil Environmental and Architectural Engineering, University of Padua, 35131 Padua, Italy - (massimo.fabris, vladimiro.achilli, denis.bragagnolo, andrea.menin)@unipd.it
b Department of Environmental Planning, University of Calabria, 87036 Arcavacata di Rende, Italy - [email protected]
Commission V/2: Cultural Heritage, Data acquisition and Processing
KEY WORDS: Archaeology, photogrammetry, TLS, high resolution, comparison
ABSTRACT:
Three-dimensional methodologies as Terrestrial Laser Scanning (TLS) and digital photogrammetry, are used to extract digital models of surfaces. In this paper, the two different approaches, integrated with classical topographic methodologies, were applied in the 3D survey of a portion of Phaistos Palace in Crete island. The archaeological site represents one of the most important document of the Minoan civilization. Leica HDS2500 Time of Flight laser scanner, Canon EOS 1 DS Mark II digital metric camera and Leica TC2003 total station were used. The aim is to evaluate if data with very different methodologies can be accurately co-registered, integrated and what are the limits of applicability. Results show the co-registration of data (average differences in the order of some centimetres) and a better capacity of laser scanning surfaces to describe the corrugated portions of the walls of Phaistos Palace.
* Corresponding author. This is useful to know for communication with the appropriate person in cases with more than one author. 1. INTRODUCTION
Laser scanner devices represent one of the most widely investigated instruments in different fields of architectural and archaeological surveying applications. In order to allow photo-realistic navigation and presentation of cultural heritage objects, 3D models with good geometric accuracy, large amount of details, different LOD (Level Of Detail) and high resolution textures are required. Moreover, the integration with classical topographic techniques allow to create a local reference network useful to measure control points. Thus, 3D data can be co-registered in the same reference system and, if necessary, close lacunas of data generated by shadow zones. The precision of digital photogrammetry, for normal acquisitions and extraction of 3D models, mainly depends on the relation between base-distance of acquisitions, on some factors influencing the image quality (brightness, smoke or fog, slope or vegetation, etc…), on ground resolution (pixel dimension), grid size, acquisition step and interpolation method (Fabris et al., 2009).
In this paper, the two different approaches, were applied in the 3D survey of a portion of Phaistos Palace in Crete island (figure 1). The archaeological site represents one of the most important document of the Minoan civilization and Italian archaeologists working in this area for more than one hundred years. In this case, Leica HDS2500 laser scanner, Canon EOS 1 DS Mark II digital metric camera (that provides images at 16.7 Megapixel resolution) and Leica TC2003 total station were used: the aim is to evaluate if data with very different methodologies can be accurately co-registered, integrated and what are the limits of applicability. The laser scanner HDS2500 allows to measure single points using the Time Of Flight (TOF) technique, providing an accuracy of 4 mm for the distance measurement and of 6 mm for the positioning definition (measurement ranges from 1.5 m to 50 m); the accuracy for angles definition is 60 micro-rad. The laser scanner captures data in 40° x 40° field of
view (FOV). This FOV limits the amount of space that can be acquired in a single scan, but the scan head can be turned to coverage a broader spatial area; furthermore the entire laser scanner can be placed in different positions to acquire similar or different scans from different points of view. This approach at various locations allows scanning from multiple angles to produce a 3D view of the target object (Fabris et al., 2007).
2. THE 3D SURVEYS
The survey, using the three different methodologies, involved two areas located in the margin North-East (A) and West (B) of the planimetric distribution of the site (figure 1).
2.1 The North-East area (A)
In this area, that is very important because here were found the famous disk of Phaistos, still undeciphered, were acquired some scans: the laser scanner was located at about 10 m distance to the surfaces in 4 different stationing points: thus, 13 point clouds were acquired with a mean step of 0.5 cm in order to decrease shadow zones, mainly in the areas of undercut. Before the scans, 6 high reflectivity laser scanning targets, characterized by a white circle on blue background (7.5 x 7.5 cm size), were placed on the surface. The instrument recognizes semi-automatically the targets in the point cloud and carries out a detailed scan defining with high precision the centre of the signals by means of the average of the coordinates of the acquired points. Subsequently, the targets were surveyed with TC2003 total station: thus, for each signal, 3D coordinates of the centre, measured in a reference network, were assigned. The network was surveyed in the GGRS87 (Greek Geodetic Reference System 1987) national Greek reference system using 3 GPS Leica System 1200: were acquired data of well located vertexes with sampling rate of 15 s and time measuring of about 60 min.
Figure 1. Location of the Phaistos archaeological site and the two portions surveyed of the Palace
For this reason, after the GPS data processing by Leica Geo OfficeTM software, each target was positioned in the GGRS87 network.
The same portions of the walls were acquired with the terrestrial photogrammetric technique: using the digital metric camera (28 mm focal length) over a calibrated bar, positioned at about 5-10 m distance to the surfaces, were obtained 4 triplets of images in 4 different stationing points, in order to decrease shadow zones. In fact, in this case were captured 3 images for each acquisition (left, centre and right positions) with the ZscanTM system (images overlap of about 70%).
The GCPs, necessary for the external orientation of the images, were the same laser scanning targets.
2.2 The West area (B)
The survey of the B area was carried on in continuity with the A ones.
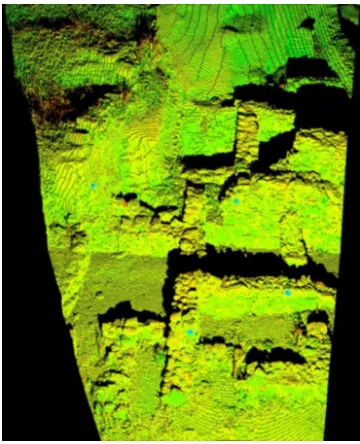
Points clouds were acquired with the laser scanner located at about 5-10 m distance to the surfaces: the data, with a mean step of 0.5 cm, provides coloured points based on the amount of laser beam return (figure 2).
Before the scans, 8 high reflectivity laser scanning targets were placed on the surface; the targets were surveyed with TC2003 total station in the same Greek national reference system GGRS87.
Terrestrial photogrammetric technique allowed to acquired the same portions of the walls with stereoscopic images: using the digital metric camera (28 mm focal length) were captured 5 stereo pairs with tripod located at about 5-10 m distance to the surfaces, providing data with overlap of about 70%.
Figure 2. 3D points cloud of the B side portion of the Palace
3. DATA PROCESSING
3.1 TLS processing
Laser scanning data were processed using, initially, CycloneTM software that allows co-register different scans using 3 different procedures: cloud registration, target registration and survey registration. The first one needs a large overlapping percentage (at least 40%) between 2 adjacent different scans in order to roto-translate the points clouds in the same reference frame using homologous points for a first alignment, and ICP (Iterative Closest Points) algorithm for a better co-registration. The second one uses the targets as reference points in order to execute the alignment and, again, a large overlapping percentage between scans must be taken in account (at least 30%). In this measured with a total station in order to obtain the coordinates in the same reference system. So, no relevant overlapping percentage between adjacent scans is needed; nevertheless, minimum overlapping is required in order to guarantee the model continuity (5-10%). In this approach, the measurement time increased, but also the final accuracy upscale.
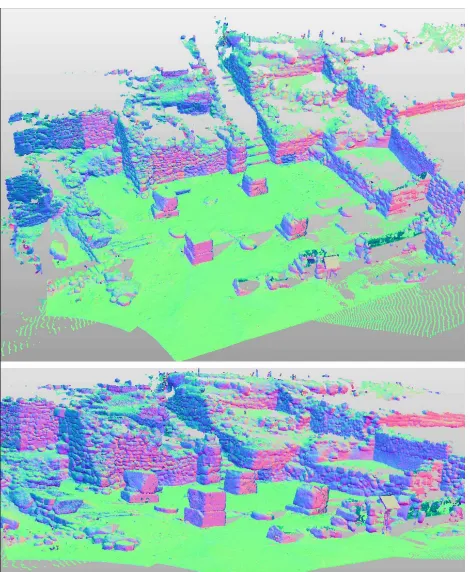
This Survey Registration method was used to align the point clouds of the A and B portions of the Palace: the scans were aligned and co-registered in the GGRS87 reference system. The procedure provides a max co-registration error of 4 mm and 2 mm for the A and B areas respectively (figure 3).
3D final models obtained were managed with ReconstructorTM software to extract profiles, sections and plans at different elevations.
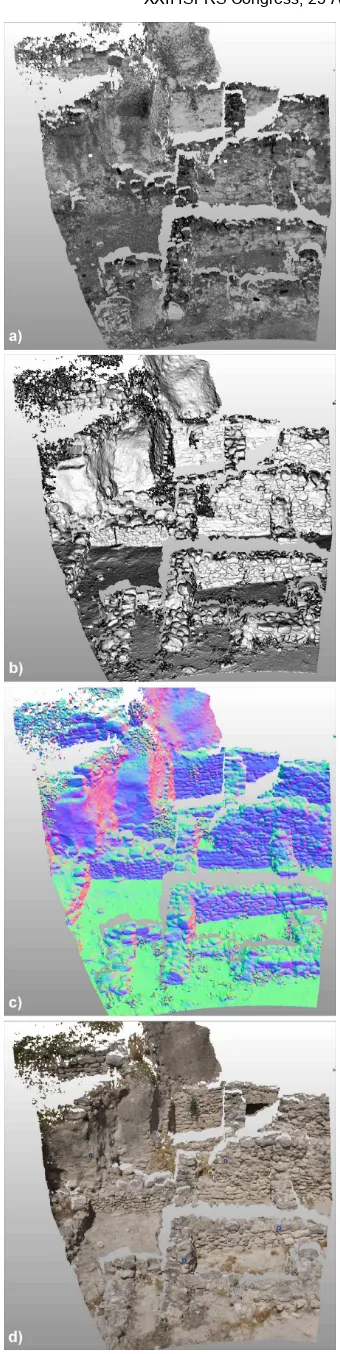
Moreover, a texture mapping was performed using the images acquired for the photogrammetric surveys (figure 4, figure 6d): the texture was carried out both on the points cloud final model and on the mesh surfaces. In order to make easier the digital analysis of the archaeological site, exposure maps were produced both for the A and B zones (figure 5, figure 6c).
3.2 ZscanTM processing
The 4 triplets of images acquired in the A portion were processing using ZscanTM software: for each triplet, it provides a points cloud in the common area of the 3 images.
The data obtained can be managed as a generic scan, similar to the laser scanning ones. Subsequently, the points clouds, characterized by large overlap, were aligned and co-registered in the GGRS87 system using ZMapTM software, providing the triangulated final 3D model of the A portion of the Phaistos Palace (figure 7): initially, the reference system of each scan was closer to the adjacent using homologous points; for a better adjustment was used the ICP algorithm obtaining a mean co-registration error in the order of 1 cm.
Figure 3. 3D representation of the final TLS model of the A portion
Figure 4. Texture mapping of the A portion
Figure 5. Exposure maps of the A portion
3.3 Stereopair processing
The orientation of images pair was performed with the Topcon Image Master PhotoTM software. Each pair generate a photogrammetric model that, measuring homologous points, can be connect to the subsequent. The processing of the A images involved the data acquired laterally (left and right position) on the calibrated bar. The external orientation was performed by means the GCP laser scanning targets well visible on the images. On the generated photogrammetric models were traced 3D polylines that are the contour where the software applied the image correlation algorithms to extract 3D surfaces: in some cases, automatic correlation failed (in shadow or undercut zones) generating points with large errors: thus, a correction of the automatic results are needed by means drawing of manual breaklines that become a constrain for the subsequent automatic processing. Finally the points obtained, with grid space of 5 cm, were triangulated generating the results of figure 8.
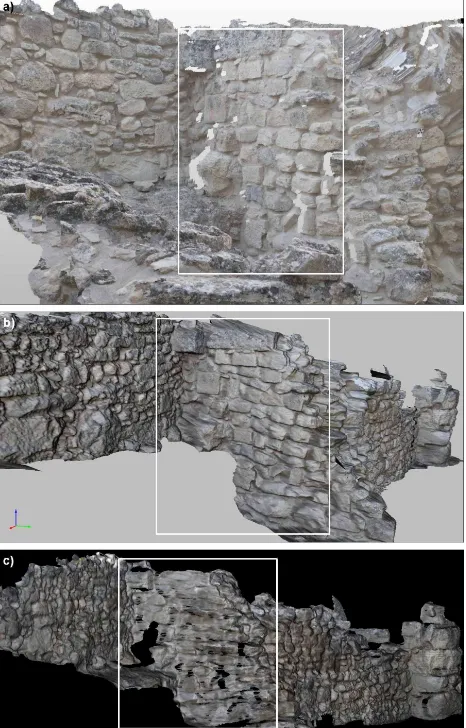
Figure 6. TLS 3D representation of the B area: a) points cloud map; b) shaded relief map; c) exposure map; d) texure map
Figure 7. Different view of the final triangulated 3D model of the A portion Phaistos Palace using ZscanTM and ZMapTM
software (5 cm grid space)
Figure 8. a) Triangulated 3D final model of the A portion Phaistos Palace using Topcon Image Master PhotoTM software
(5 cm grid space); b) Detail of the resolution on the wall
The same procedure was applied for the generation of the 3D model of the B portion Palace with terrestrial photogrammetry (figure 9).
4. 3D MODELS
The direct comparison between the generated models of the A area, show high accurate description and more details for the data extract by means of TLS. Photogrammetric models are characterized by smoothing surfaces that make it rough for the detailed description of the real wall structures morphology. However, the data generated with classical approach (stereopair, Topcon Image Master PhotoTM software) provides better results in comparison to the triplets image processing with ZscanTM software: this statement can be applied both for the frontal wall (acquired about in ideal conditions, with camera axes perpendicular to the surface, figure 10) and for the lateral wall (acquired with camera axes inclined to the surface, figure 11).
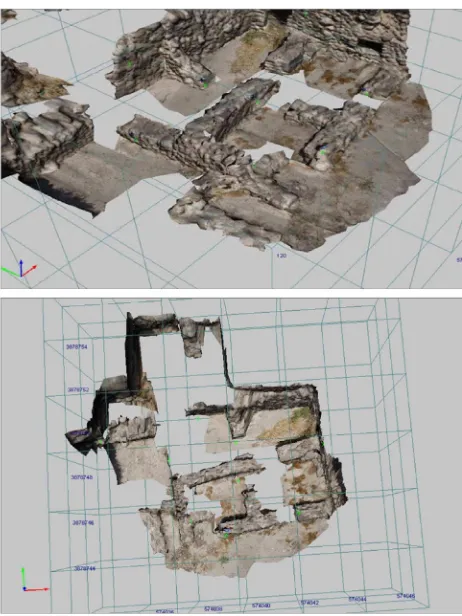
Figure 9. Representation (3D and plan) of the final triangulated 3D model of the A portion of the Phaistos Palace using Topcon
Image Master Photo software (5 cm grid space)
5. MODELS COMPARISONS
To evaluate the precisions and co-registration of the different data, a direct comparison between the 3D models was performed both for the A and the B areas of figure 1. TLS model was assumed as reference due to the high precision and resolution of the data. The different models are co-registered in the same reference system GGRS87 using control points. Results of the comparisons are shown in table 1. Average and Standard deviation of differences show high values mainly in the comparison between TLS (Terrestrial Laser Scanning, CycloneTM software) and ZSM (triplets of images, ZscanTM, ZmapTM software), while, in the other cases, the differences are probably due to the more smoothing that characterized the surfaces of the photogrammetric models. However, in order to improve the co-registration of the data, a procedure based on measure homologous points between the different models were applied. In fact, table 1 show average of differences that, with a better alignment, can be reduced. For this reason the ZscanTM and Image Master PhotoTM photogrammetric models of the A area, were co-registered on the TLS ones.
After the refined of the alignment, a new comparison was performed (table 2). In this case, while the first comparison (TLS - IMP) was significantly improvement (differences was reduced about of 67% and 39% for average and standard deviation respectively), the second ones (TLS - ZSM) provides few improvement (differences was reduced about of 29% and 19% for average and standard deviation respectively) and a co-registration error seems still not eliminated.
Figure 10. 3D surface model of the frontal wall (A area); a) TLS (HDS2500 laser scanner, CycloneTM and ReconstructorTM software); b) Topcon Image Master PhotoTM
software; c) ZscanTM, ZmapTM software
Area Comparison Average (cm) St. Dev. (cm)
A TLS - IMP 0.55 2.48
A TLS -ZSM 2.59 9.56
B TLS - IMP 1.38 2.77
Table 1. Direct comparison between the 3D models generated with different methodologies and software. TLS: Terrestrial Laser Scanning (CycloneTM and ReconstructorTM software); IMP: Image Master PhotoTM software; ZSM: ZscanTM and
ZMapTM software
Area Comparison Average (cm) St. Dev. (cm)
A TLS - IMP 0.18 1.52
A TLS -ZSM 1.84 7.73
Table 2. Comparison between the 3D models generated with different methodologies and software after the application a procedure for a refined co-registration. TLS: Terrestrial Laser
Scanning (CycloneTM and ReconstructorTM software); IMP: Image Master PhotoTM software; ZSM: ZscanTM and ZMapTM
software
Figure 11. 3D surface model of the lateral wall (A area); a) TLS (HDS2500 laser scanner, CycloneTM and ReconstructorTM software); b) Topcon Image Master PhotoTM
software; c) ZscanTM, ZmapTM software
6. CONCLUSIONS
The application of the 3D survey methodologies allowed generate high resolution three-dimensional models of the 2 portions (A, B, figure 1) of the Phaistos Palace archaeological site. Data were acquired by means of TLS and terrestrial digital photogrammetry methodologies integrated with classical topographic techniques for the survey of reference network (measured in the GGRS87 Greek national system) and control points.
The 3D models extracted are characterized by high resolution data (0.5 cm and 5 cm for TLS and terrestrial photogrammetry respectively) but different precisions and co-registration: in fact, photogrammetric ones (obtained with images triples, ZscanTM and ZmapTM software, or images pairs, Topcon Image Master PhotoTM software) show smooth surfaces, while the TLS better describe the real corrugated morphology of the walls. Moreover, the comparison with the TLS data provides better results of the Image Master PhotoTM models that can be improved adjusting the co-registration between the datasets.
7. REFERENCES
Fabris, M., Achilli, V., Artese, G., Boatto, G., Bragagnolo, D., Concheri, G., Meneghello, R., Menin, A., Trecroci, A., 2009. High resolution data from laser scanning and digital photogrammetry terrestrial methodologies. Test site: an architectural surface. In: The International Archives of the
Photogrammetry, Remote Sensing and Spatial Information Sciences, Paris, France, Vol. XXVIII, Part 3/W8, pp. 43-48.
Fabris, M., Achilli, V., Bragagnolo, D., Menin, A., Salemi, G., 2007. Filling lacunas in terrestrial laser scanning data: the “Cavallo ligneo” of the “Palazzo della Ragione” (Padua, Italy). In: Proceedings of the XXI International Symposium CIPA
2007, Athens, Greece, pp. 301-306.
Fabris, M., Achilli, V., Bragagnolo, D., Menin, A., Salemi, G., 2007. Laser scanning methodology for the structural modelling. In: Proceedings of the XXI International Symposium CIPA
2007, Athens, Greece, pp. 307-310.