CHANGES IN THE LAND COVER AND LAND USE OF THE ITACAIÚNAS RIVER
WATERSHED, ARC OF DEFORESTATION, CARAJÁS, SOUTHEASTERN AMAZON
P. W. M. Souza-Filho a,b,*, W. R. Nascimento Jr.b, B. R. Versiani de Mendonça c, R. O. Silva Jr. a, J. T. F. Guimarães a,b, R. Dall’Agnol a,b, J. O. Siqueira b
a
Vale Institute of Technology (ITV), Belém, Pará, Brazil - (pedro.martins.souza, renato.silva.junior, tasso.guimaraes, Roberto.dallagnol. jose.oswaldo.siqueira)@itv.org
b
Intelligence Planning and Environment, Vale S.A., Nova Lima, Minas Gerais, Brazil – [email protected] c
Geoscience Institute, Universidade Federal do Pará, Belém, Pará, Brazil - [email protected]
Commission VI, WG VI/4
KEY WORDS: Landsat, change detection, object based image analysis, GEOBIA, multitemporal image analysis.
ABSTRACT:
Human actions are changing the Amazon’s landscape by clearing tropical forest and replacing it mainly by pasturelands. The focus of this work is to assess the changes in the Itacaiúnas River watershed; an area located in the southeastern Amazon region, near Carajás, one of the largest mining provinces of the World. We used a Landsat imagery dataset to map and detect land covers (forest and montane savanna) and land use (pasturelands, mining and urban) changes from 1984 to 2013. We employed standard image processing techniques in conjunction with visual interpretation and geographic object-based classification. Land covers and land use (LCLU) “from-to” change detection approach was carried out to recognize the trajectories of LCLU classes based on object change detection analysis. We observed that ~47% (~1.9 million ha) of forest kept unchanged; almost 41% (~1.7 million ha) of changes was associated to conversion from forest to pasture, while 8% (~333,000 ha) remained unchanged pasture. The conversion of forest and montane savannah to mining area represents only 0.24% (~9,000 ha). We can conclude that synergy of visual interpretation to discriminate fine level objects with low contrast associated to urban, mining and savanna classes; and automatic classification of coarse level objects related to forest and pastureland classes is most successfully than use these methods individually. In essence, this approach combines the advantages of the human quality interpretation and quantitative computing capacity.
* Corresponding author
1. INTRODUCTION
In a global and regional context, land covers and land use (LCLU) changes studies constitute a broad field in terms of the diversity of remote sensing methods available to map and monitor the different types of human-driven changes in the environments. However, long term and continuous mapping of distinct land cover classes in a tropical and subtropical watershed is uncommon (Shi et al., 2011). Nevertheless, supervised pixel-based classification algorithm has been widely used for land cover mapping and change detection, while geographic object-based image analysis (GEOBIA) literature is increasing rapidly (Blaschke, 2010). During the last few decades, the “per-pixel” classification approach has progressively been criticized due to be centered only in the digital number (i.e. brightness value) in each pixel of the digital image (Blaschke et al., 2014) and because it does not explore sufficiently the spatial concept of neighborhood, proximity or homogeneity (Burnett and Blaschke, 2003). However, image-objects are composed of pixel groups with similar data values, which retains an intrinsic size, shape, and geographic relationship with the real-world landscape (Hay et al., 2001). Object-based approach has some advantages over the pixel-based classification, such as remove “salt-and pepper” effects and a large set of features (e.g. objects generated from spectral, spatial and textural properties of a group of pixels) can be originated as additional information to improve image classification accuracy (Liu and Xia, 2010).
In the previous studies with GEOBIA, a vast majority has been developed using high spatial resolution imagery (Blaschke,
2010).. Few studies about LCLU changes were developed using moderate spatial resolution and long-term imageries carried out from GEOBIA (Desclée et al., 2006; Duveiller et al., 2008; Lyons et al., 2012).
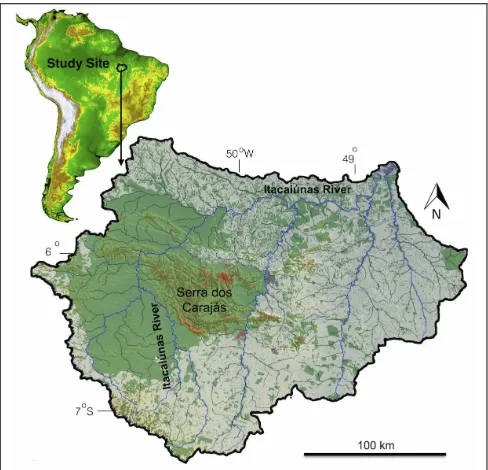
In this study, we employed a standard image processing techniques in conjunction with manual interpretation and geographic object-based classification. The aims of this paper is to present a combined object-based classification and manual interpretation methodology for a quantitative assessment of LCLU changes and recognize the spatio-temporal trajectories of LCLU classes in the Itacaiúnas River watershed in the Amazon Region from 1984 to 2013 (Figure 1).
2. DATASET AND METHODS
2.1 Remote sensing dataset and field data collection
During the process of visual image analysis and fieldwork data collection, we recognized patterns and patches in the landscape observed in the color composition images. Hence, it was possible to identify three land covers (forest, montane savanna and water bodies) and three land-use types (pasturelands, mining and urban areas).
Figure 1. Location map of the study site illustrated in the 2013 land cover and land use map generated from interpretation of the Landsat-8 OLI images. Green = forest, orange = montane savanna, belge = pastureland, red = mining area, grey = urban area, blue line = main rivers, thin black line = secondary rives, bold line = watershed boundary.
2.2 Digital image processing
The 2013 Landsat-8 OLI images were converted to the Top of Atmosphere (TOA) reflectance (USGS, 2012). The 2004, 1994 and 1984 Landsat-5 TM images were converted to ground reflectance in percentage through ATCOR algorithm of the PCI Geomatica 2013 software. For each mosaic Landsat date, we derived the Normalized Difference Vegetation Index - NDVI (Tarpley et al., 1984) and band ratio 6/4 of Landsat-8 OLI and 5/3 of Landsat-5 TM (Gad and Kusky, 2006). Later, we generated mosaics of Landsat images from each year (1984 Landsat-5 TM, 1994 Landsat-5 TM, 2004 Landsat-5 TM, and 2013 Landsat-8 OLI) to quantify human-driven changes in the landscape. The mosaics presented 30 m in pixel size to UTM 22S zone projection and datum WGS84. Clipping subset of mosaic was carried out from shape file containing the boundary of Itacaiúnas River watershed.
2.3 Geographic object-based image analysis - GEOBIA
The multi-resolution classification of LCLU classes was based on combined manual interpretation and automatic classification synergy from GEOBIA. As mining, urban and montane savanna classes were represented for a small amount of segments, we use a manually editing thematic vector objects technique. The eCognition software provides this possibility, allowing defines the thematic region of interest before automatic image classification. In essence, this technique combined the advantages of semi-automated fine level object generation and
classification with the visual human interpretation (Benz et al., 2004; Lang et al., 2009). Afterwards, a rule set was established to automatically classify objects associated with forest, bare soil, pasturelands, and water bodies.
The segmentation process included three user-defined parameters: i) the spectral parameter wsp = 0.5 trading spectral homogeneity versus object shape, is included in order to obtain spectrally homogenous objects; ii) the compactness parameter
wcp = 0.5 trading compactness versus smoothness, adjusts the objects shape between compact objects and smooth boundaries, and iii) the scale parameter hsc = 50, to obtain image segmentation with a minimum object size (equal to the Minimum Mapping Unit - MMU) of 2.5 ha. An overview of the steps of manual editing and object-based image analysis is given in Figure 2.
Figure 2. Empiric GEOBIA workflow that illustrates the principles of the segmentation: i) remote sensing data set analysis, ii) multi-date segmentation, iii) manual image object editing, iv) classification process based on segmentation, v) image classification per class, and vi) merging and quantifying classification, which incorporates GIScience concepts.
During the automated classification process, we adopted the membership functions to describe specific properties of the objects. The selection of objects was assisted by analysis of separability of the comparable classes. Each class was classified separately in the domain of image object level, using the class filter “unclassified”, according the following order: i) mining, urban and montane savanna classes (manual editing); ii) black water bodies; iii) whitewater bodies; iv) bare soil; v) pasture/croplands; vi) forest. Posteriorly, black-white water bodies and bare soil-pasture/croplands were grouped in two classes - water bodies and pasturelands - through merge region algorithm.
2.4 Object-based change detection analysis
2.5 Classification accuracy assessment of LCLU classes
We initially assessed the quality of image segmentation from a visual evaluation of classified images. Later, we used 1,060 GCPs collected during the fieldwork to run the classification accuracy assessment of 2013 Landsat-8 OLI image. As we have no older thematic map available, we used selected objects generated from image segmentation to produce thematic class map based on stratified random sampling. Accuracy assessment of 2013 Landsat-8 OLI image classification were undertaken using confusion matrices, Kappa index (Congalton and Green, 2009) and Tau statistics (Ma and Redmond, 1995).
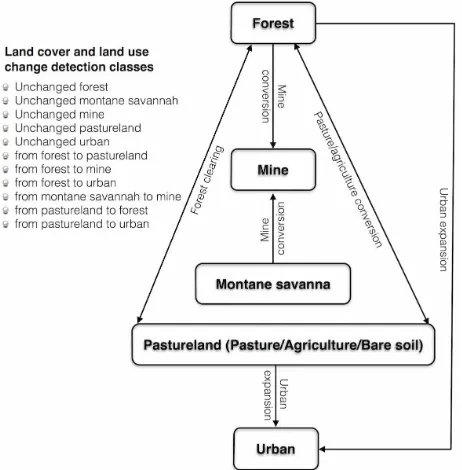
Figure 3. Conceptual model of trajectories of land cover and land use changes over time in the Itacaiúnas River watershed.
3. RESULTS
3.1 Accuracy assessment
The results indicated that overall accuracy, kappa and Tau index for mapping forest, montane savanna, pastureland, mining, urban and water bodies classification were higher than 0.89, using 2013 Landsat-8 OLI imagery as reference data (Table 1). Producer’s accuracy indicates which segments were correctly identified according reference data (GCPs). All classes have producer’s accuracy higher than 90%, with emphasis in pastureland (98.63%), montane savanna (97.92%) and urban areas (95.06%). The higher omission’s errors occurred between forest and pastureland. This confusion can be explained due to sensing imagery time (August 2013) and GCPs collection (April 2014). Five GCPs of pastureland were commissioned as urban areas due to similarities in spectral responses.
3.2 Land cover and land use “from-to” change detection
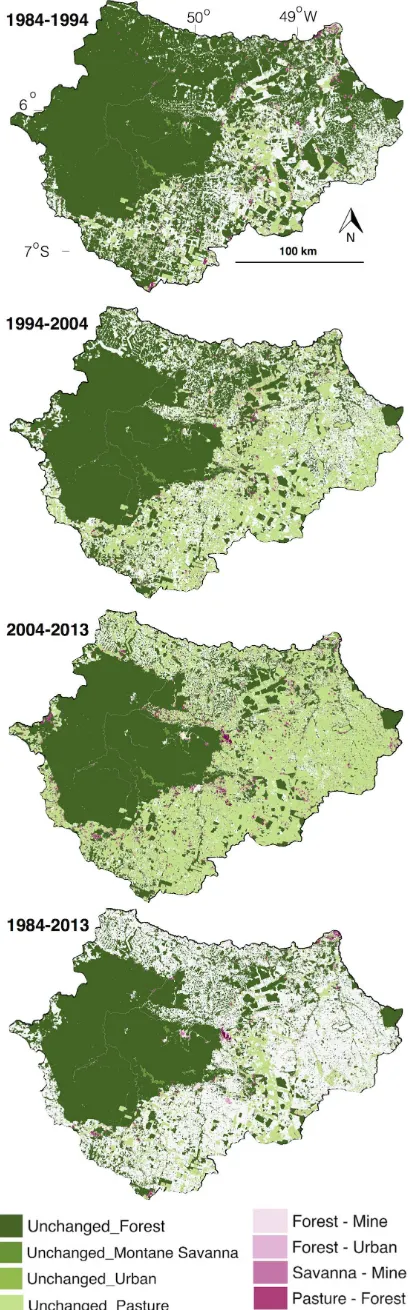
Figure 4 illustrates the LCLU unchanged and “from-to” change detection classes based on a bi-temporal mosaic image analysis. The change detection between 1984 and 1994 indicated that unchanged forest was the largest class with almost 2.8 millions ha (68% of the study area). The conversion from forest class in 1984 to pasture class in 1994 reached an area of 800,000 ha, while unchanged pasture encompassed ~300,000 ha (Table 2A). Between 1994 and 2004, the unchanged forest class represented around 2 millions ha, while unchanged pasture attained ~1 million ha. The conversion from forest to pasture in this period kept the same intensity of ~800,000 ha. The change detection between 2004 and 2013 is marked by an accentuated decrease in the LCLU changes, with unchanged forest and unchanged pasture occupying an area of approximately 1.8 and 1.7 million ha, respectively, which demonstrates that no change occurred in around ~85% of the study site. The conversion from forest to pasture was reduced to ~300,000 ha, while forest recovery from pasture reached the maximum intensity (~140,000 ha). Between 1984-2013, we could observe that ~47% (~1.9 million ha) of forest kept unchanged; almost 41% (~1.7 million ha) of changes was associated to conversion from forest to pasture, while 8% (~333,000 ha) remained unchanged pasture. The conversion of forest and montane savanna to mining area represents only 0.24% (~9,000 ha). The area and percentage of unchanged and “from-to” change detection between one class to another can be observed in the Table 2A.
Table 1. Confusion matrix of the GEOBIA 2013 Landsat-8 OLI classification. The matrix shows the number of verification points, omission's and commission's errors, user’s and producer’s accuracy, Kappa index per class, overall accuracy, general Kappa index and Tau index. F = forest, MS = montane savanna, P = pastureland, M = mining, U = urban, W = water.
Figure 4. Qunatification of land cover and land use changes between 1984-1994, 1994-2004, 2004-2013 and 1984-2013, from “from-to” object detection approach.
A)
LCLUC 1984-1994 1994-2004 2004-2013 1984-2013 Area % Area % Area % Area % F - M 2.63 0.06 2.49 0.06 3.64 0.09 8.73 0.21
F - P 792 19.17 796 19.25 301 7.27 1,680 40.62 F - U 0.72 0.02 0.42 0.01 0.90 0.02 5.79 0.14
P - F 65.21 1.58 72.26 1.75 139 3.36 41.99 1.02 P - U 1.23 0.03 0.00 0 7.51 0.18 6.72 0.16
MS - M 0.39 0.01 0.56 0.01 0.49 0.01 1.43 0.03 UF 2,818 68.16 2,046 49.5 1,807 43.7 1,925 46.55
UM 1.36 0.03 3.40 0.08 5.49 0.13 1.12 0.03 UMS 10.23 0.25 9.93 0.24 9.42 0.23 9.12 0.22
UP 307 7.43 1,040 25.15 1,710 41.36 333 8.05 UU 1.13 0.03 2.74 0.07 5.10 0.12 1.18 0.03
Un 134 3.23 161 3.88 146 3.52 122 2.94
B)
TF 1984-1994 1994-2004 2004-2013 1984-2013
Area % Area % Area % Area % TF 3,614 100 2,845 100 2,112 100 3,619 100 UF 2,818 77.98 2,046 71.93 1,807 85.55 1,925 53.19 F - M 2.63 0.07 2.49 0.09 3.64 0.17 8.73 0.24
F - P 792 21.93 796 27.97 301 14.23 1,680 46.41
F - U 0.72 0.02 0.42 0.01 0.90 0.04 5.79 0.16
C)
TMS 1984-1994 1994-2004 2004-2013 1984-2013 Area % Area % Area % Area % TMS 10.61 100 10.49 100 9.91 100 10.54 100
UMS 10.23 96.34 9.93 94.66 9.42 95.09 9.12 86.47 MS - M 0.39 3.66 0.56 5.34 0.49 4.91 1.43 13.53
Table 2. A summary of land cover and land use change trajectories from object based approach. A) Quantification of LCLUC between 1994, 1994-2004, 2004-2013 and 1984-2013; B) Total forest and C) Total montane savanna unchanged and “from-to” change detection over years. Area in 1,000 hectares. F = forest, MS = montane savanna, P = pastureland, M = mining, U = urban, UF – unchanged forest, UM – unchanged mine, UMS – unchanged montane savanna, UP = unchanged pastureland, UU = unchanged urban, Un = unclassified, TF – total forest, TMS = total montane savanna.
4. DISCUSSION
The methodological approach used in the study case allowed to combine the advantages of visual human interpretation of a segmented image to recognize and define specific classes (e.g., mining and urban areas), as well as automated fine level object classification (e.g., forest, bare-soil, pasture-agriculture and water bodies).
segments from image objects reduces the processing time of image analysis and therefore limits the cost of the remote sensing and GIS processes, mainly when related to regional scale. According Lang et al. (2009), this approach shows how superior aggregation capabilities of the human brain can be combined with the fine spatial segmentation and classification. Furthermore, the combination of the object analysis level, the nearest neighbor classifier, and expert knowledge provides the highest classification accuracy in comparing to per-pixel classification approach (Platt and Rapoza, 2008). A similar result was found for mapping tropical savanna in Australia using object-based classification (Whiteside et al., 2011).
Hence, this paper proves strong evidence in favor of this assertive. High values of overall accuracy, Kappa and Tau index were got in the accuracy assessment analysis, indicating a close correspondence between the object-based image classification output and the fieldwork observations. Moreover, the obtained results suggest that GEOBIA can be used to extract LCLU changes information from moderate spatial-resolution satellite imagery, such as Landsat images time series, in climatological (moist tropical and tropical seasonal climate) and ecological (tropical rainforest and savannah) transition zone in the Brazilian Amazon.
The deforestation process observed in 1980’s and 1990’s decades is associated with the opening of road in the southeastern Amazon Region (Laurence et al., 2009; Barber et al., 2014). Another point is that the deforestation occurred preferentially in larger properties with >500 ha dominated by large and very large landholders, whose properties are more concentrated in older areas that have better infrastructure, such as roads, and thus are connected to markets (Godar et al., 2014).
5. CONCLUSION
The synergy of visual interpretation to discriminate fine level objects with low contrast associated to urban, mining and montane savannah classes and automatic classification of coarse level objects related to forest and pastureland classes is most successfully than use these methods individually. In essence, this approach combines the advantages of the human quality interpretation and quantitative computing capacity. We can conclude that there is a strong negative relation between deforestation processes and formation of new landscape dominated by pastureland in the Itacaiúnas River watershed.
ACKNOWLEDGEMENTS permission of IBAMA (SISBIO 35594-2). P.W.M. Souza-Filho, R. Dall’Agnol and J.O. Siqueira would like to thanks to CNPq for research scholarship.
REFERENCES
Barber, C.P., Cochrane, M.A., Souza Jr, C.M., Laurance, W.F., 2014. Roads, deforestation, and the mitigating effect of
protected areas in the Amazon. Biological Conservation 177, 203-209.
Benz, U.C., Hofmann, P., Willhauck, G., Lingenfelder, I., Heynen, M., 2004. Multi-resolution, object-oriented fuzzy analysis of remote sensing data for GIS-ready information. ISPRS Journal of Photogrammetry and Remote Sensing, 58, pp. 239-258.
Blaschke, T., 2010. Object based image analysis for remote sensing. ISPRS Journal of Photogrammetry and Remote Sensing, 65, pp. 2-16.
Blaschke, T., Hay, G.J., Kelly, M., Lang, S., Hofmann, P., Addink, E., Queiroz Feitosa, R., van der Meer, F., van der Werff, H., van Coillie, F., Tiede, D., 2014. Geographic Object-Based Image Analysis – Towards a new paradigm. ISPRS Journal of Photogrammetry and Remote Sensing, 87, pp. 180-191.
Burnett, C., Blaschke, T., 2003. A multi-scale segmentation/ object relationship modelling methodology for landscape analysis. Ecological Modelling 168, 233-249.
Castilla, G., Hay, G.J., 2008. Geographic Object-Based Image Analysis (GEOBIA): A new name for a new discipline, in: Blaschke, T., Lang, S., Hay, G.J. (Eds.), Object-Based Image Analysis: Spatial Concepts for Knowledge-Driven Remote Sensing Application. Springer-Verlag, Berlin.
Congalton, R.G., Green, K., 2009. Assessing the accuracy of remotely sensed data : principles and practices, 2nd Ed. CRC Press - Taylor & Francis Group, Boca Raton, Florida.
Desclée, B., Bogaert, P., Defourny, P., 2006. Forest change detection by statistical object-based method. Remote Sensing of Environment, 102, pp. 1-11.
Duveiller, G., Defourny, P., Desclée, B., Mayaux, P., 2008. Deforestation in Central Africa: Estimates at regional, national and landscape levels by advanced processing of systematically-distributed Landsat extracts. Remote Sensing of Environment, 112, pp. 1969-1981.
Gad, S., Kusky, T., 2006. Lithological mapping in the Eastern Desert of Egypt, the Barramiya area, using Landsat thematic mapper (TM). Journal of African Earth Sciences, 44, pp. 196-202.
Godar, J., Gardner, T.A., Tizado, E.J., Pacheco, P., 2014. Actor-specific contributions to the deforestation slowdown in the Brazilian Amazon. Proceedings of the National Academy of Sciences 111, 15591-15596.
Hay, G.J., Marceau, D.J., Dubé, P., Bouchard, A., 2001. A multiscale framework for landscape analysis: Object-specific analysis and upscaling. Landscape Ecology 16, 471-490.
Irons, J.R., Leveland, T.R., 2013. Eighth Landsat Satellite Becomes Operational. Photogrammetric Engineering and Remote Sensing, 79, pp. 398-401.
quantitative assessment of parcels and biotopes. Geocarto International, 24, pp.99-114.
Laurance, W.F., Goosem, M., Laurance, S.G.W., 2009. Impacts of roads and linear clearings on tropical forests. Trends in Ecology & Evolution 24, 659-669.
Liu, D., Xia, F. 2010. Assessing object-based classification: advantages and limitations. Remote Sensing Letter, 1, pp. 187-194.
Lu, D., Li, G., Moran, E., Hetrick, S., 2013. Spatiotemporal analysis of land-use and land-cover change in the Brazilian Amazon. International Journal of Remote Sensing, 34, pp. 5953-5978.
Lyons, M.B., Phinn, S.R., Roelfsema, C.M., 2012. Long term land cover and seagrass mapping using Landsat and object-based image analysis from 1972 to 2010 in the coastal environment of South East Queensland, Australia. ISPRS Journal of Photogrammetry and Remote Sensing, 71, pp. 34-46.
Ma, Z., Redmond, R.L., 1995. Tau coefficients for accuracy assessment of classification of remote sensing data. Photogrammetric Engineering and Remote Sensing, 61, pp. 435-439.
Platt, R.V., Rapoza, L., 2008. An Evaluation of an Object-Oriented Paradigm for Land Use/Land Cover Classification. The Professional Geographer, p. 60, 87-100.
Shi, Z.-H., Li, L., Yin, W., Ai, L., Fang, N.-F., Song, Y.-T., 2011. Use of multi-temporal Landsat images for analyzing forest transition in relation to socioeconomic factors and the environment. International Journal of Applied Earth Observation and Geoinformation 13, 468-476.
Tarpley, J.D., Schneider, S.R., Money, R.L., 1984. Global Vegetation Indices from the NOAA-7 Meteorological Satellite. Journal of Climate and Applied Meteorology, 23, pp. 491-494.
USGS, 2012. Landsat Data Continuity Mission (LDCM) Level 1 (L1) Data Format Control Book (DFCB). U.S. Geological Survey, Department of the Interior, Sioux Falls, South Dakota.
Whiteside, T.G., Boggs, G.S., Maier, S.W., 2011. Comparing object-based and pixel-based classifications for mapping savannas. International Journal of Applied Earth Observation and Geoinformation, 13, pp. 884-893.