HETEROGENEOUS ACCESS AND PROCESSING OF EO-DATA ON A CLOUD BASED
INFRASTRUCTURE DELIVERING OPERATIONAL PRODUCTS
F. Niggemann a, F. Appel a, H. Bach a, J. de la Mar b, B. Schirpke b, K. Dütting b, G. Rücker e, D. Leimbach e
a Vista Geowissenschaftliche Fernerkundung GmbH, Gabelsbergerstr. 51, 80333 München, Germany – [email protected], [email protected], [email protected] de
b T-Systems International GmbH, Dachauer Straße 651, 80995 München, Germany – [email protected], [email protected], [email protected]
e ZEBRIS GbR, Lipowskystr. 26 81373 Munich, Germany – [email protected]
KEY WORDS: Cloud Computing, land-surface monitoring, Sentinel-1, Landsat-8, automated data access and processing, Big Data
ABSTRACT:
To address the challenges of effective data handling faced by Small and Medium Sized Enterprises (SMEs) a cloud-based infrastructure for accessing and processing of Earth Observation(EO)-data has been developed within the project APPS4GMES(www.apps4gmes.de). To gain homogenous multi mission data access an Input Data Portal (IDP) been implemented on this infrastructure. The IDP consists of an Open Geospatial Consortium (OGC) conformant catalogue, a consolidation module for format conversion and an OGC-conformant ordering framework. Metadata of various EO-sources and with different standards is harvested and transferred to an OGC conformant Earth Observation Product standard and inserted into the catalogue by a Metadata Harvester. The IDP can be accessed for search and ordering of the harvested datasets by the services implemented on the cloud infrastructure. Different land-surface services have been realised by the project partners, using the implemented IDP and cloud infrastructure. Results of these are customer ready products, as well as pre-products (e.g. atmospheric corrected EO data), serving as a basis for other services. Within the IDP an automated access to ESA’s Sentinel-1 Scientific Data Hub has been implemented. Searching and downloading of the SAR data can be performed in an automated way. With the implementation of the Sentinel-1 Toolbox and own software, for processing of the datasets for further use, for example for Vista’s snow monitoring, delivering input for the flood forecast services, can also be performed in an automated way. For performance tests of the cloud environment a sophisticated model based atmospheric correction and pre-classification service has been implemented. Tests conducted an automated synchronised processing of one entire Landsat 8 (LS-8) coverage for Germany and performance comparisons to standard desktop systems. Results of these tests, showing a performance improvement by the factor of six, proved the high flexibility and computing power of the cloud environment. To make full use of the cloud capabilities a possibility for automated upscaling of the hardware resources has been implemented. Together with the IDP infrastructure fast and automated processing of various satellite sources to deliver market ready products can be realised, thus increasing customer needs and numbers can be satisfied without loss of accuracy and quality.
1. INTRODUCTION
The amount of data brought to us each day by earth observation sensors has been steadily increasing and will continue to do so over the years. Especially the capabilities of Copernicus, the European Satellite Observations Programme, is stimulating the need of new methods for effective data handling and automated processing. The free and open data policy, promoted by the Copernicus program, is giving the opportunity for fast and easy access to the available datasets. Processing chains that are able to access the raw EO data and automatically start handling the data sources for provisioning of derived products are more and more in need to deal with these huge available amounts of information.
Especially for SME`s and small research units, having only limited budgets for high performance hardware resources, Cloud Computing is providing a promising solution in this respect. It offers the flexible storage and computing power combined with high bandwidths to download and process available data sources and increase the allocated resources when needed. Processes can be brought close to the data, and only the information required will be transferred to the user, without time consuming transfer of huge data amounts.
Because hardware alone is not sufficient, within the project APPS4GMES a cloud based Input Data Portal (IDP) has been
developed by the partners aiming at automated and heterogeneous data access to various sources of EO Data. Therefore the Cloud Computing infrastructure, known as Infrastructure-as-a-Service (IaaS), has been extended by Platform-as-a-Service (PaaS) functions to create an Information-as-a-Service (Fig 1).
Figure 1. APPS4GMES architecture, showing the embedding of the services (red) with the shared project modules (blue) within the cloud architecture (Appel 2013)
Water quantity
Water quality
Agriculture Environment REDD Fire monitoring
REDD
Metadata DB Cached Raster Data
Input Data Portal
[OGC WCS, OGC EO Metadata Profile, OGC Ordering Service Framework for EO Products, GeoRSS] APPS4GMES Portal
[OGC WMS/WCS/WFS] APPS4GMES Service Chain
Manager
A
P
P
S
4
G
ME
S
C
lo
u
d
T
o
o
lk
it
APPS4GMES Billing Manager
Copernicusand Third Party Missons = Heterogeneous Data Sources
Satellite data providers
Architecture
Client / Partner
This infrastructure is extended by each partner with modules (red boxes in Figure 1) providing products within his domain, covering the fields of water quantity, water quality, agriculture, environment, REDD and Fire monitoring. Thus Information-as-a-Service can be offered to various customers within a secure and scalable cloud environment. The modular architecture allows the implementation of further products accessing the common modules (blue boxes in Figure 1). The produced results can either be accessed by customers or reused by business partners to ingest them in their own processing chains. For these purposes an API, allowing automated search & download of data, and a web interface has been realised. The web interface is planned to be further developed to provide a graphical web portal and web-shop with all needed functionality for browsing and ordering the available datasets and products. This paper is focusing in a first step on the cloud performance based on processing chains implemented for the services atmospheric correction, pre-classification and plant parameter retrieval realised by Vista and serving as ready to use customer products, as well as a basis for other partner products. Input for these services are optical sensors, in this case Landsat-8 and RapidEye. Additionally, an automated download and processing capability of Sentinel-1 SAR data has been developed and tested on a cloud based VM by Vista. In a last step the upscaling of these processing chains is described.
2. ARCHITECTURE
The IDP, realised by the partners T-Systems and ZEBRIS, is accessing EO Data from various sources. A metadata harvester is tasked to search distributed catalogues or metadata collections, and a consolidation module with reformating and further processing capabilities for selected products have been realised. The catalogue is constantly updated by the metadata harvester and search requests can be performed against the contents. The harvester reformats metadata to the OGC conformant EOP standard. The consolidation module converts datasets according to different ordering options in order to provide a more uniform access for all other modules. At the moment Copernicus contributing missions, such as MODIS, RapidEye and Landsat are accessible. The integration of further Sentinel sensors is under development and close to completion. While the access to Sentinel-1 data access through the IDP was under development, access via ESA’s Scientific Data hub has been implemented by Vista on its own virtual machine (VM). Other EO data sources with available APIs can be added with only small effort. Raster Data is made available by the consolidation module as GeoTIFF together with metadata in the OGC Earth Observation Metadata profile of Observations & Measurements (EOP). All Data once ordered is stored in the above mentioned format for a defined time.
The infrastructure of the IDP is built with the service-oriented architecture (SOA) solution WSO2 as middleware and other open source tools to guarantee an environment free of licensing costs. It was important for the consortium to choose only open source products with high maturity and high degree of innovation that are supported by a large and strong community to guarantee sustainable development of the infrastructure. The whole architecture of the IDP is based on the vCloud infrastructure provided by the partner T-Systems. Other VMs can easily be created and connected to the IDP by the partners. Each implemented service thus has fast access to the stored data and metadata through high bandwidths within the environment. In order to be able to scale up all processes without rising licensing costs all VMs are based on a Linux operating system, open source tools and in-house developed software for EO-processing.
The implementation and configuration of the VMs is adaptable to the current needs in terms of number of CPU’s, memory or volumes of hard disk. This scalability of resource allocation is providing the partners with the flexibility and advantages of cloud computing over standard desktop or server based systems.
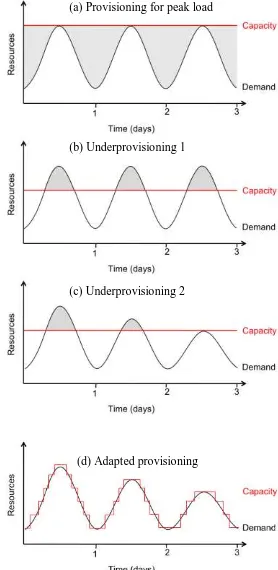
Figure 2. Schema of possible provisioning of hardware resources (modified after Armbrust 2009).
As visualised in Figure 2, fixed hardware capacity is leading either to unused resources during off-peak times (a) or demand exceeding the capacity (b) & (c). The flexibility to allocate resources only when needed and adapt the capacity in a flexible way to the current demand (d) is only given by cloud computing solutions. Each step in the red capacity curve might be representing one VM that is additionally deployed due to rising demands. As easy and fast as these VMs can be deployed they can also be deleted, after transferring the data results they were meant to produce.
Having this possibility of scalable resources at hand, quickly rising customer numbers, which might for example be driven by the publication of a low cost mobile are no longer a market barrier for SMEs (Koubarakis 2014).
3. VISTA’S OPERATIONS
To test the computation power and possible performance gain of the cloud environment compared to a standard desktop system, the processing of one Landsat-8 coverage for the whole of Germany was chosen. Processing in this case means atmospheric correction, pre-classification and calculation of plant physiological parameters, needed for other products. These processing steps are realised in the Vista Imaging Analysis (VIA).
The chosen coverage consists of 40 scenes, in total ~40GB of raw, compressed satellite data. The huge amount of data has to be loaded and extracted, resulting in roughly double the amount of data to be processed. During processing about 7GB per scene
(a) Provisioning for peak load
(b) Underprovisioning 1
(c) Underprovisioning 2
thus 280GB of disk space for the LS-8 coverage is needed. Dealing with these huge amounts of data is revealing that in a first step a significant performance factor is not only the processing- but also data transfer speed.
In a second step sophisticated algorithms are needed to deliver the desired products. The VIA is performing the needed atmospheric correction with bottom-of-atmosphere measurements using the MODTRAN interrogation technique (MIT) (Verhoef & Bach 2007). Required atmospheric parameters are obtained by three MODTRAN runs, over the whole spectrum for the assumed atmospheric and geometrical conditions, and with spectrally flat surface albedos of 0.0, 0.5 and 1.0. The output consists of 11 spectral variables by means of which one can describe in a unified way the surface– atmosphere interaction over the solar-reflective, thereby including BRDF effects and adjacency effects (Verhoef & Bach 2007). These results are used to generate the bottom-of- atmosphere reflectance values for each pixel.
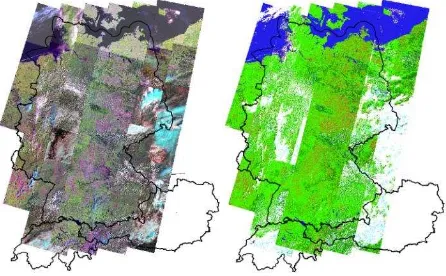
Figure 3. Atmospheric corrected LS-8 scene and land use classification
A model-supervised pre-classification with the classes soil, snow, water, cloud, cloud-shadow, coniferous forest and vegetation is calculated in a next step, based on the atmospherically corrected image (Figure 3).
As an example for plant parameter retrieval, the Green Leaf Area Index (GLA) is calculated, using an inverse modelling technique based on the spectral simulation model SLC (Soil-Leaf-Canopy), an extended version of the SAIL model family (Migdall 2009, Verhoef & Bach 2007). The input parameters of SLC are structural and physiological information on the vegetation, soil optical properties and the observation geometry. A non-Lambertian soil BRDF sub-model for the soil reflectance and its variation with moisture is incorporated (Verhoef & Bach 2007). SLC can be parameterized according to the spectral and geometrical configuration of any optical sensor. The model is inverted to retrieve vegetation parameters for the pixels classified as vegetation (Migdall 2009).
Running the VIA algorithms described above with the huge amount of data, results in a high demand for computing power needed for processing in a reasonable time and at no loss of accuracy.
A further use case implemented on the provided cloud environment has been realised by the automated accessing and processing of Sentinel-1 data. These datasets, provided as Level 1b data, enclosing C-Band observations in different modes, are serving as weather independent data source for land surface dynamics monitoring. With spatial resolutions better 20m (Interferometric Wide Swath Mode) and better 50m (Enhanced Wide Swath Mode) , and a repeat cycle of 12 days (same orbit), Sentinel-1 is an major step towards operational and continuous services. To make use of these datasets an automated access to ESAs Scientific Data Hub and batched pre-processing with the provided Sentinel-1 Toolbox have been implemented on a VM. Within Vista’s service portfolio, the flood forecast services as
well as the agricultural services (e.g. crop monitoring) will benefit.
To exploit all the advantages offered by the cloud computing solution, upscaling of the above described processing chains is an important factor. With the help of the project partner ZEBRIS, the upscaling of cloud resources, creating new VMs for processing purposes has been implemented. These VMs are generated from templates when needed, running the desired processes, transferring the results of their calculations and are subsequently deleted.
The results will compare the performance of a standard desktop system to the cloud solution. Different processing steps have been evaluated to generate comparable benchmarks. In a second step we demonstrate the operational downloading and processing of Sentinel-1 data on a cloud environment. Finally the possibilities of process automation and upscaling to make full use of the cloud environment are presented.
4. RESULTS
4.1 Landsat TM Processing Benchmarks
4.1.1 Downloading: Taking a look at performance of
automated satellite processing starts with the download performance of these huge amounts of data. As already said,
The fastest available glass fibre internet connection at Vista’s facilities in Munich is at the moment offering a mean download speed of 80Mbit/s. Compared to independent tests on the cloud environment, with a mean download rate of 215 Mbit/s, the cloud solution is more than 2.5 times faster. Assuming that there is no other parallel traffic and no limited delivery rate by the opposing server -which is at the moment not the case for USGS- the considered data amount of 40GB needs 25 minutes downloading time on the cloud compared to 65 minutes using the desktop solution. The data transfer is of course even much faster if the raw data is already available within the Input Data Portal.
4.1.2 Processing: To identify which configuration of VMs
would be needed to achieve the best results in processing time compared to a standard desktop system, several tests have been performed. Benchmark for these tests was a Windows 8 Desktop System with 4 CPUs (3.7GHz) and 8 GB Ram.
Simultaneous
Read[MB/s] Write[MB/s]
Desktop 155 165
Cloud VM 777 212
Table 2. Read & Write performance (mean value of 10 independent measurements)
The higher performance of the cloud disk solution allows much faster access to the data sources and much faster writing of processed temporary and permanent results.
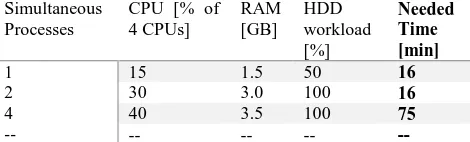
Simultaneous Processes
CPU [% of 8 CPUs]
RAM [GB]
Needed Time
[min]
1 15 0.6 17
2 30 1.2 17
4 50 3.0 19
8 100 3.2 33
Table 3. Maximum workload of hardware usage for cloud solution per VM
Read & write performance not being the limiting factor anymore allows exploitation of the other resources -CPU and memory- the cloud environment offers at a scalable amount. Results of several test runs (see Table 3) showed the optimal configuration of one VM with 8 CPU and 4GB RAM. This configuration allows the processing of 8 LS-8 scenes simultaneously, making full use of the available resources and taking only a bit more than half an hour. Compared to the optimal configuration on the desktop system, taking 16 minutes for two scenes, this means a performance gain of factor 2.
4.1.3 Upscaling: An important benefit of cloud solutions is
not only the flexible adaption of hardware resources but also the possibility of upscaling. An almost infinite number of VMs can be produced. In the use case discussed in this paper the optimal configuration was tested with 5 parallel running VMs each processing 8 LS-8 scenes simultaneously, resulting in 40 processed scenes.
Figure 4. Landsat mosaic and derived pre-classification for Germany in a time window of 5 weeks in summer 2014
This configuration delivers atmospheric corrected scenes, pre-classification and Green Leaf Area Index for 40 scenes or the complete coverage of Germany in only 33 minutes. Taking the processing of two scenes at the same time on the desktop solution, the results would be ready in 5:20 hours.
4.2 Sentinel-1 pre-processing
The Sentinel-1 mission is planned as a two satellite constellation with the goal of providing C-Band SAR Data. One of the sensors, Sentinel-1A, is in orbit since April 2014 delivering first images in different resolutions and swath widths since autumn 2014 initially through ESA’s Scientific Data Hub. This portal can be accessed for browsing and free downloading and is designed as rolling-archive system.
The access, for Vista’s purposes, to the Data Hub in an automated way has been implemented on a cloud based VM. This includes automatic archive search (using spatial and temporal filters), data transfer to the VM and application of the Sentinel-1 toolbox software for spatial sub-setting, re-projection and terrain correction as pre-processing. The provided datasets are converted to GeoTIFF format and automatically transferred to an FTP server, where they can be accessed for final processing/product generation.
Figure 5. Sentinel-1 observation of Germany for several satellite passes during 2nd to 9th of January 2015
These preparatory actions are the first steps to implement entire processing chains, adding value to the data and to deliver final, end-user-ready, products. Specific algorithms for the retrieval of the spatial information of snow cover and the soil moisture have been successfully applied on local systems and will be included in the VM processes in the cloud.
The final processing chains are representing the paradigm of “bringing the process closer to the data” transferring only the needed end products of the processing chain, having only a fraction of the size the initial Level-1 data has.
In the future a more direct access to the data will be implemented, e.g. via Collaborative Ground Segments, to improve data access bandwidth, speed and archive data retrieval.
4.3 Process Automation & Automated Upscaling
defining the needed search criteria for the Metadata Catalogue, is transferred to the newly generated VM via Secure Shell (ssh). Taking these parameters as input, a search request is performed against the Metadata Catalogue via a SOAP request, returning the results of the query. In a next step all search results are ordered. After placing the order for the search results to the Ordering Module, the Data is downloaded from the sensor specific sources to the Input Data Portal. All Datasets are transferred to GeoTIFF accompanied by an EOP XML Metadata file by the consolidation module and compressed to one Archive for each order. During these steps the status of the order is constantly updated by the processing VM. After the status is set to success all data is transferred from the IDP to the processing VM. The Input Data Portal, hosting Metadata Harvester/Catalogue and Consolidation Module, has been realised by the project partner ZEBRIS and T-Systems.
Figure 6. Workflow of automated upscaling for processing of datasets
Having the data available on the processing VM, the archive is automatically decompressed and a folder structure for each contained scene is generated. For each scene the steps for atmospheric correction, pre-classification including masking of clouds and cloud shadows and plant parameter retrieval, more in detail described in chapter 3, are performed.
Figure 7: Processing steps performed on the generated VM
All requested datasets are transformed from Vista’s proprietary binary format to GeoTIFF and a new metadata file in the OGCs EOP standard is generated for the resulting images. The results can be transferred either to the main VM for quality control or directly to the ordering party/Output Data Portal. Having all needed results at hand the processing VM is undeployed and deleted from the vCloud environment deallocating the HDD space, CPUs and Memory.
5. OUTLOOK
This paper is showing developed capabilities to automatically search, download and process various sources of EO data on a cloud environment. Most of the Level-1 datasets can be accessed through the developed IDP. Sentinel-1 access has been temporarily implemented outside the ordering structure of the IDP, but still within the cloud environment on Vistas own VM. It is planned to integrate this sensor as well as other upcoming Sentinels in the IDP ordering infrastructure. Possibilities of processing optical and SAR data have been demonstrated on the cloud environment. Performance gain through the developed upscaling capabilities is guaranteed. A last step for being able to offer these capabilities and resulting products to customers and partners is the implementation of web services for the integration of the developed service chains. An Output Data Portal and web shop functions will be realised for access of produced Level 2 and 3 data.
ACKNOWLEDGEMENTS
The project APPS4GMES is funded by the Bavarian Ministry of Economic Affairs, Infrastructure, Transport and Technology.
Part of the presented work funded by “SSEP Info-as-a-Service Stimulus”, ESA ESRIN/Contract No. 4000112634/14/I-LG
REFERENCES
Appel, F., Bach, H., Heege, T., de la Mar, J., Siegert, F., Rücker, G., 2013. Proc. of the ESA Living Planet Symposium “APPS4GMES – Development of operational products and Services for GMES –A Bavarian initative“, Edinburgh, UK.
Armbrust, M. et al., 2009. “Above the Clouds: A Berkeley view of cloud computing” Tech. Rep. UCB/EECS 2009-28, EECS Department, U.C. Berkeley, USA.
Koubarakis, M., 2014. The Image Information Mining Conference: The Sentinels Era (ESA-EUSC-JRC 2014), “Linked Open Earth Observation Data: The LEO Project” Bucharest, Romania.
Ruecker, G., de la Mar, J., Appel, F., Bach, H., Siegert, F. und Kleih, Ch. 2013. ESA-ESRIN, BIG DATA FROM SPACE “APPS4GMES – development of operational services for GMES using cloud computing technology”, Frascati (Rome), Italy.
Migdall, S., Bach, H., Bobert, J., Wehrhan, M., Mauser, W. 2009. “Inversion of a canopy reflectance model using hyperspectral imagery for monitoring wheat growth and estimating yield”. In: Precision Agriculture, DOI 10.1007/s11119-009-9104-6, 2009.
Niggemann, F., Appel, F., Bach, H., de la Mar, J., Schirpke, B., 2014. Proc. of the ESA BIG DATA FROM SPACE conference „The use of cloud computing resources for processing of Big Data from space for operational land surface monitoring in Germany”, Frascati (Rome), Italy.