IMPROVING SEMI-GLOBAL MATCHING: COST AGGREGATION AND CONFIDENCE
MEASURE
Pablo d’Angelo
German Aerospace Center (DLR), Remote Sensing Technology Institute D-82234 Wessling, Germany email: [email protected]
Commission I, WG I/4
KEY WORDS:Dense Matching, Digital Elevation Model, Stereo, Benchmark, Accuracy
ABSTRACT:
Digital elevation models are one of the basic products that can be generated from remotely sensed imagery. The Semi Global Matching (SGM) algorithm is a robust and practical algorithm for dense image matching. The connection between SGM and Belief Propagation was recently developed, and based on that improvements such as correction of over-counting the data term, and a new confidence measure have been proposed. Later the MGM algorithm has been proposed, it aims at improving the regularization step of SGM, but has only been evaluated on the Middlebury stereo benchmark so far. This paper evaluates these proposed improvements on the ISPRS satellite stereo benchmark, using a Pleiades Triplet and a Cartosat-1 Stereo pair. The over-counting correction slightly improves matching density, at the expense of adding a few outliers. The MGM cost aggregation shows leads to a slight increase of accuracy.
1. INTRODUCTION
Creation of digital elevation models by automatic image match-ing of airborne or spaceborne optical data is one of the basic procedures in photogrammetry. While mature and well perform-ing stereo algorithms exist, there is still room for improvements. In the last years, the Semi-Global Matching (SGM) algorithm (Hirschm¨uller, 2008) has been successfully applied to a variety of stereo problems.
It has proven to be very robust and provides a good compromise between computational speed and matching quality. However, there is still a need for improvements, for example, a pixel-wise reliability score would be very helpful for further processing such as DSM fusion and editing.
Additionally, the regularization performed by the SGM algorithm is not as strong as in other, computationally more demanding global optimization algorithms, such as total variation based al-gorithms.
2. RECENT SGM IMPROVEMENTS
The cost aggregation algorithm is the core of the SGM method, has been used as a basic component by many stereo algorithms, but itself hasn’t been investigated much. However, recently (Drory et al., 2014) analyzed SGM from a theoretical standpoint and derives it as a special case of Belief Propagation. (Facciolo et al., 2015) proposes improvements to the aggregation algorithm. However, their contributions were evaluated on Middlebury close range data (Scharstein et al., 2014), with often has different prop-erties than close range data.
2.1 Basic SGM algorithm
The main components of SGM are matching cost computation and cost aggregation.
The matching costC(p,q)computes a similarity value for po-tentially matching pixels in two images. Using the epipolar ge-ometry, matching costs are computed for all potentially matching
pixels in the image pair. For all examples in this paper the Census transform (Zabih and Woodfill, 1994) is used. The window size as set to7by9pixels. In a thorough evaluation of many match-ing cost functions (Hirschm¨uller and Scharstein, 2009), Census turned out to be a very robust and reliable cost function with good performance.
As the matching costs based on single pixel values or small win-dows are ambiguous, regularization is used to ensure a well be-haved reconstruction. For semi-global matching, the matching step is cast into an energy minimization problem. The following, discontinuity preserving energy should be minimized:
E(D) =X
p
(C(p, Dp) + X
p,q∈Np
V(Dp, Dq) (1)
with
V(d, d′) =
0 ifd=d′ P1 if|d−d′|= 1 P2 otherwise
(2)
The functionCdefines the matching cost between the image pix-els for each pixel location pin the first image and the corre-sponding pixel in the other image, as defined by the disparity map D. The pairwise termV(p,q)penalize disparity changes in the neighborhoodNpof each positionp. The penaltyP1is added for
all disparity changes equal to one pixel. At larger discontinuities (disparity change>1 pixel), a fixed costP2is added. This cost
function favors similar or slightly changing disparities between neighborhood pixels, and thus stabilizes not only the matching in image areas with weak contrast, but also allows large disparity jumps in areas with high contrast.
Minimizing Eq. 1 for two dimensional neighborhoodsNpis an
Lr(p, d) =C(p, d)
+mind′(Lr(p−r, d′) +V(d, d′))
−min(Lr(p−r))
(3)
SummingLfor allNdirdirections provides the aggregated cost
S:
S(p, d) =X
r
Lr(p, d). (4)
Usually, 8 directions, vertical, horizontal and diagonals are used, but 16 directions gives better results and reduce streaking arti-facts.
The disparity mapDis computed by finding the minimum aggre-gated costS for each pixelpin the first image. Subpixel accu-racy is archived by fitting a local parabola to the aggregated costs around the minimum. Further sub-pixel accuracy can be obtained by sampling the disparity space with 0.5 pixel steps.
Matching is performed from first to the second and second to the first image, and only consistent disparities passing the left-right check are kept. Small, independent disparity segments are iden-tified and removed as outliers. The disparity image is reprojected into a DSM with the desired projection and grid spacing. Support data such as confidence layers are also reprojected. Finally any remaining no-data areas are filled using inverse distance weighted interpolation.
2.2 Over-counting correction
The connection between SGM and Belief Propagation (BP) has been established by (Drory et al., 2014). They show that SGM can be interpreted as the first pass of min-sum BP. Compared to belief propagation, SGM counts the data termC Ndirtimes, thus
it should be subtracted when computingS:
S(p, d) =X
r
Lr(p, d)−(Ndir−1)∗C(p, d). (5)
2.3 More global matching
The regularization performed by the SGM algorithm is not as strong as in other, computationally more demanding global op-timization algorithms. In contrast to global methods, where all pixels influence each other, SGM performs scanline optimization (cost aggregation) in different aggregation directions, thus each pixel in influenced only by pixels located on 8 horizontal, vertical or diagonal lines. The more global matching (MGM) proposed by (Facciolo et al., 2015) provides a simple extension to improve the regularization by additionally considering the already aggregated previous scanline:
Thus the update is then influenced by the upper left quadrant of p, not just the pixels on pathr.
2.4 Matching confidence
Per pixel confidence or even accuracy values would be beneficial for further processing such as data fusion and object extraction. For example the most important information for most DSM fu-sion algorithms are per pixel weight maps.
When multiple independent stereo pairs are available, for exam-ple when computing wide area DSMs (Uttenthaler et al., 2013, Fujisada et al., 2012), values such as number of matches per pixel and their height standard deviation can be computed and used as accuracy values. In the photogrammetric community, the de-pendency of surface slope on the height error has been used for medium resolution DEMs, but it is unclear if this can be applied to VHR satellite data and detailed DSMs that include discontinu-ities such as building edges and other small scale features.
Many quality metrics based on data computed during the im-age matching have been proposed in the past (Hu and Mordo-hai, 2012). These include correlation coefficient, curvature of the sub-pixel parabola, and others.
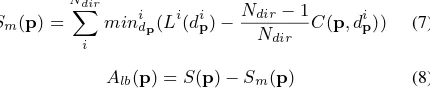
For SGM, (Drory et al., 2014) proposed a new uncertainty value which is based on an estimation of the lower bound of the energy values. The lower boundSmfor the aggregated cost at each each
pixelpcan be computed as sum of directional minima.
Sm(p) =
Alb]is the difference between estimated lower bound and
aggre-gated cost, and used as confidence measure. Two other confi-dence measurements evaluated in this work are the local surface slope,Aslpand the distance between the first and second minima
of the aggregated costAmmn.
3. EVALUATION 3.1 Dataset description
The data of the ISPRS Commission I WG 4 satellite stereo bench-mark dataset (Reinartz et al., 2010) is used to evaluates the relia-bility measure and the modified cost aggregation.
The test region in Catalonia, near Barcelona has been selected due to the availability of several stereo satellite datasets and a good reference data set provided by the Institut Cartogr`afic de Catalunya (ICC).
The evaluation is performed on three test sites, show in Table 1 and Fig. 1.
Test area Lower left corner
Area type
1. Terrassa (Tr) 417400E 4597300N
City, industrial, residential, hills
2. Vacarisses (Va) 409100E 4601700N
Wooded hills, quarry, waste dump
3. La Mola (Mo) 416400E 4608600N
Steep mountainous terrain, forests
Table 1: Position and properties of the selected test areas. The size of each area is 4 km x 4 km. Coordinates are in UTM Zone 31 North.
Figure 1: Cartosat-1 image showing the three test areas.
3.1.1 Reference Data The primary reference dataset used in this paper is a 3D point cloud acquired by airborne laser scan-ning with a density of approximately 0.5 points per square meter, cf. Fig. 2. Only the first pulse returns is used in this study, as the DSM produced by image matching corresponds to the visible surface. The LIDAR data for the Terrassa and Vacarisses test ar-eas was acquired on 26th and 27th November 2007. The LaMola LIDAR data was acquired on 26th November 2007 and 4th May 2008.
3.1.2 Cartosat-1 The test areas are covered by a Cartosat-1 Stereo pair with a ground resolution of2.5mand a stereo angle of31◦. Larger shadow areas are visible, as the data has been acquired on the 5th of March 2008. Fig. 1 shows the Cartosat AFT image of the three evaluated test areas.
3.1.3 Pleiades data A Pleiades 1A triplet acquired on 8. Jan-uary 2013 and provided by Airbus Defense & Space was used as an example for a VHR triplet dataset. The along track viewing an-gles of the triplet are:−15.5◦,−7.5◦and16◦. Thus three stereo pairs with convergence angles of8◦,23.5◦and31.5◦are pos-sible. This allows reconstruction of fine details in densely build up areas. Due to the winter acquisition, especially the mountain-ous La Mola area contains deep shadows without usable image content.
3.2 Evaluation procedure
The datasets were bundle adjusted using tie points and ground control provided by the ICC. The generated DSM are thus well registered to the reference data, with a systematic differences in the decimeter range.
All datasets involved in this evaluation where performed using the same basic SGM parameter settings. The used cost function was Census with a 9x7 window, SGM penalties were set toP1 = 400andP2 = 800. Images were matched in both directions, and a left and right check is performed. Then the disparity maps are reprojected into a DSM in UTM Zone 31 North, with a grid
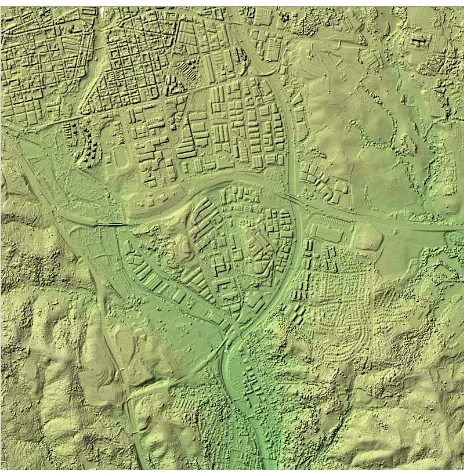
Figure 2: Shaded reference LIDAR DSM of the Terrassa area.
spacing of 1 meter for the Pleiades data, and 5 m for the Cartosat-1 data. For the Pleiades triplet, the 3 possible stereo pairs were matched independently. The pairwise DSMs were averaged to obtain the final DSM. As almost all further processing steps such as orthorectification require a DSM without holes, any remaining no-data values are filled using multi-level B-spline interpolation.
The distance between the LIDAR points and the generated DSM are computed and evaluated statistically. RMSE and normalized median absolute deviation (NMAD) for all results (H¨ohle and H¨ohle, 2009). As there is a large time difference between the ac-quisitions, especially between the Pleiades and the LIDAR data, changed areas, such as new constructed or demolished building, quarries and waste dumps have been manually masked out and were not evaluated. However, there are still some small system-atic changes between the LIDAR data due to differences in vege-tation.
To evaluate the influence of the over-counting correction and MGM cost aggregation independently, two evaluations were performed.
The over-counting correction was evaluated using the classical SGM algorithm with 16 aggregation directions. Tables 2 and 3 shows that the over-count correction results in a higher complete-ness of about 1 to 2%. However, slightly worse RMSE, NMAD and bad pixel values are obtained. Other tests with close range imagery showed that the over counting correction lead to a de-crease of outliers. It is unclear why the performance on the satel-lite datasets is different.
The effect of the MGM extension was evaluated on the same dataset, but with 8 aggregation directions only, as our current MGM implementation cannot aggregate along 16 directions. Ta-bles 4 and 5 show the evaluation results.
Test area fix OC
Complete-Table 2: Results for SGM with 16 directions with and without over-counting (OC) correction evaluation on the Cartosat-1 stereo pair. The BAD column gives the percentage of pixels with errors >10m.
Test area fix OC Complete-ness
Table 3: Over-counting evaluation on Pleiades Triplet. The La Mola region was not included, as the very dark shadows without image details in the mountainous regions lead to large no-data regions. The BAD column gives the percentage of pixels with errors>5m.
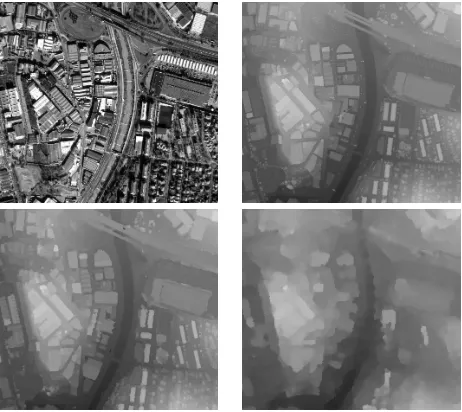
a few small height segments in the shadow area, leading to much better interpolation of the larger no-data area. In this case, it also outperforms SGM16, cf. Tab. 3, which in most other cases per-forms similar to MGM8. Visual inspection of the DSMs shows that MGM provides slightly denser results, at the cost of also increasing the size of outlier segments. For this evaluation, dis-parity segments smaller than 10 pixels were removed as outliers. When stronger outlier rejection is used, the number of outlier will be slightly reduced, at the expense of loosing small details, such as the high residential buildings in the Terrassa data. Figure 3 shows the results on a part of the Terrassa area.
3.3 Confidence measures
Confidence or accuracy measures are evaluated by comparison of measure with the LIDAR data. The accuracy of a DSM point depends on various factors, such as image noise, texture, shadow and local surface slope. A direct modeling of the error is thus not possible. Instead, most approaches try to use variables such as local slope or metrics computed by the image matching algorithm as indicators for the confidence.
The height differences between the LIDAR DSM and the MGM8 DSM are evaluated. Often, statistical accuracy measures, such as RMSE, are calculated for several slope classes, and used as indicator for the DSM accuracy. For example, Figures 4, 5, 6
Test area Method Complete-ness
Table 4: SGM8 vs MGM8 evaluation on Cartosat-1 stereo pair. The BAD column gives the percentage of pixels with errors>10 m.
Test area Method Complete-ness
RMSE NMAD BAD
Tr MGM8 95.99 2.31 0.68 3.92%
Tr SGM8 96.27 2.35 0.68 4.09%
Va MGM8 92.40 3.01 1.31 7.70%
Va SGM8 92.16 3.56 1.36 8.67%
Table 5: SGM8 vs MGM8 evaluation on Pleiades Triplet. The BAD column gives the percentage of pixels with errors>5m.
Figure 3: Detail of MGM8 results on the Terrassa area. Top row: Pleiades ortho image, LIDAR reference. Bottom Row: Pleiades DSM, Cartosat-1 DSM.
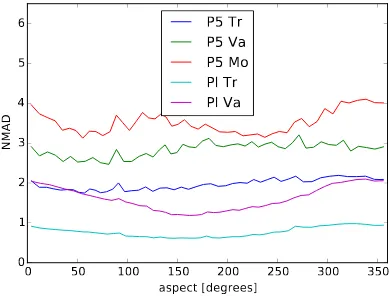
and 7 show the NMAD vs slope, aspect, AmmnandAlb. The
behavior of the Cartosat-1 and Pleiades DSM show similar trends. Due to the large shadow areas, the Vacarisses and La Mola areas show higher errors for northern aspects.
The height error values are often not normally distributed, and cannot be completely described by a single number. Instead, joint histograms of the height error and confidence value show the full distribution of the errors. For example, Figures 4, 6 and 7 show similar trends, but the underlying distributions in Fig. 8 look very different.
Figure 8 visualizes that the height error vs confidence variable distribution of the Pleiades Terrassa triplet. It can be seen that the distribution is centered and quite symmetric. A narrow distribu-tion at low slopes is expected, which should progressively widens as the slope gets higher. However, there is a tendency that higher slopes show less variation in height error than low slopes. When using the aggregated cost distanceAmmn, it is visible that the
small distances cause a larger variation, thus it is a better error in-dicator than the slope. The confidenceAlbis proposed in (Drory
et al., 2014). ForAlb= 0all aggregation paths agree on a single
disparity, indicating a confident solution. However, for largeAlb
values above 1000, the height error decreases again. Albis thus
does not provide a strong indication for height errors, hereAmmn
performs better.
4. CONCLUSION
This paper investigates the performance of several recently pro-posed improvements for Semi-Global Matching in the context of The International Archives of the Photogrammetry, Remote Sensing and Spatial Information Sciences, Volume XLI-B1, 2016
0 10 20 30 40 50 60 70 80
Figure 4: Dependence of height error on slope for Cartosat-1 (P5) and Pleiades (Pl) DSMs.
0 50 100 150 200 250 300 350
Figure 5: Dependence of height error on aspect.
DSM generation from satellite data. First the over-counting cor-rection and the confidence measure proposed by (Drory et al., 2014), and the More Global Matching modification by (Facciolo et al., 2015). Using the LIDAR ground truth data, it was found that the over-counting correction results in minimally denser re-sults but also minimal loss in accuracy. The MGM aggregation using 8 directions leads to slightly improved results over 8 direc-tional SGM aggregation. Further investigation, for example with other land-cover types should be performed to check if MGM could increase the performance more significantly in areas with little texture. The uncertainty measure proposed by (Drory et al., 2014) did not perform better than existing methods, such as the energy difference between first and second minima.
Future work could include an extension of the MGM algorithm for aggregation from multiple directions at the same time, as well as a more principled evaluation of confidence functions (Hu and Mordohai, 2012).
5. ACKNOWLEDGMENTS
The authors would like to thank the data providers for their gen-erous support, namely: GAF AG for the Cartosat-1 data, Airbus Defense and Space for the Pleiades triplet and ICC Catalunya for the reference data.
7000 6000 5000 4000 3000 2000 1000 0
acost_min2-acost_min
Figure 6: Dependence of height error on difference of first and second aggregated cost minimaAmmn.
0 500 1000 1500 2000 2500 3000
acost_min-acost_bound
Figure 7: Dependence of height error based on estimated lower bound of energyAlb.
(a) Slope (b)Ammn (c)Alb
Figure 8: Height error vs. confidence variable joint histograms for the Pleiades Terrassa triplet. Color is proportional to the log-arithm of density of each joint histogram bin.
REFERENCES
Drory, A., Haubold, C., Avidan, S. and Hamprecht, F. A., 2014. Semi-global matching: A principled derivation in terms of mes-sage passing. In: 36th German Conference on Pattern Recogni-tion.
Facciolo, G., de Franchis, C. and Meinhardt, E., 2015. Mgm: A significantly more global matching for stereovision. In: Proceed-ings of the British Machine Vision Conference (BMVC), BMVA Press, pp. 90.1–90.12.
Fujisada, H., Urai, M. and Iwasaki, A., 2012. Technical method-ology for aster global dem. IEEE Transactions on Geoscience and Remote Sensing 50(10), pp. 3725–3736.
match-ing and mutual information. IEEE Transactions on Pattern Anal-ysis and Machine Intelligence 30(2), pp. 328 – 341.
Hirschm¨uller, H. and Scharstein, D., 2009. Evaluation of stereo matching costs on image with radiometric differences. IEEE Transactions on Pattern Analysis and Machine Intelligence 31(9), pp. 1582–1599.
H¨ohle, J. and H¨ohle, M., 2009. Accuracy assessment of digital elevation models by means of robust statistical methods. ISPRS Journal of Photogrammetry and Remote Sensing 64(4), pp. 398 – 406.
Hu, X. and Mordohai, P., 2012. A quantitative evaluation of con-fidence measures for stereo vision. IEEE Transactions on Pattern Analysis and Machine Intelligence 34(11), pp. 2121–2133.
Reinartz, P., d’Angelo, P., Krauß, T., Poli, D., Jacobsen, K. and Buyuksalih, G., 2010. Benchmarking and quality analysis of dem generated from high and very high resolution optical stereo satel-lite data. ISPRS.
Scharstein, D., Hirschm¨uller, H., Kitajima, Y., Krathwohl, G., Nesic, N., Wang, X. and Westling, P., 2014. High-resolution stereo datasets with subpixel-accurate ground truth. In: 36th Ger-man Conference on Pattern Recognition.
Uttenthaler, A., Barner, F., Hass, T., Makiola, J., d’Angelo, P., Reinartz, P., Carl, S. and Steiner, K., 2013. Euro-maps 3d–a transnational, high-resolution digital surface model for europe. In: ESA Special Publication, Vol. 722, p. 271.
Zabih, R. and Woodfill, J., 1994. Non-parametric local trans-forms for computing visual correspondence. In: ECCV ’94: Pro-ceedings of the Third European Conference-Volume II on Com-puter Vision, Springer-Verlag, London, UK, pp. 151–158.