DENSE 3D POINT CLOUD GENERATION FROM UAV IMAGES FROM IMAGE
MATCHING AND GLOBAL OPTIMAZATION
S. Rhee a, T. Kim b*
a 3DLabs Co. Ltd., 100 Inharo, Namgu, Incheon, Korea – [email protected]
b Dept. of Geoinformatic Engineering, Inha University, 100 Inharo, Namgu, Incheon, Korea –[email protected]
Commission I, ICWG I/Vb
KEY WORDS: Image matching, 3D Point Cloud, UAV, global optimization -
ABSTRACT:
3D spatial information from unmanned aerial vehicles (UAV) images is usually provided in the form of 3D point clouds. For various UAV applications, it is important to generate dense 3D point clouds automatically from over the entire extent of UAV images. In this paper, we aim to apply image matching for generation of local point clouds over a pair or group of images and global optimization to combine local point clouds over the whole region of interest. We tried to apply two types of image matching, an object space-based matching technique and an image space-based matching technique, and to compare the performance of the two techniques. The object space-based matching used here sets a list of candidate height values for a fixed horizontal position in the object space. For each height, its corresponding image point is calculated and similarity is measured by grey-level correlation. The image space-based matching used here is a modified relaxation matching. We devised a global optimization scheme for finding optimal pairs (or groups) to apply image matching, defining local match region in image- or object- space, and merging local point clouds into a global one. For optimal pair selection, tiepoints among images were extracted and stereo coverage network was defined by forming a maximum spanning tree using the tiepoints. From experiments, we confirmed that through image matching and global optimization, 3D point clouds were generated successfully. However, results also revealed some limitations. In case of image-based matching results, we observed some blanks in 3D point clouds. In case of object space-based matching results, we observed more blunders than image-based matching ones and noisy local height variations. We suspect these might be due to inaccurate orientation parameters. The work in this paper is still ongoing. We will further test our approach with more precise orientation parameters
1. INTRODUCTION
Initially, operational objective of Unmanned Aerial Vehicles (UAVs) was image accusation, such as monitoring. Currently, the platform and sensor performance has been improved and the objective includes the extraction of additional information from UAV image. For various UAV applications, it is important to generate dense 3D point cloud automatically from over the entire extent of UAV images. There were many point cloud extraction techniques using satellite and aerial images. Most of these showed high performance for calculating 3D geospatial information based on geometric information with accurate sensor model. (Haala and Rothermel 2012; Jeong and Kim, 2014 ). In general, UAV images do not have good quality as compared to aerial images. Major causes for this include difficulty of calibration, small FOV, image blur and lower texture. Direct georeferencing with GPS/INS information mounted on the UAV cannot achieve the level of accuracy comparable to that for aerial or satellite images. Inaccurate sensor model will inevitably derive 3D information with low quality. In an export to overcome this problem, feature point base matching technique has been used for UAV image. This matching technique does not consider the geometric information calculated from exterior orientation. Feature point based matching is processed only using characteristics of image, such as pixel position and brightness
* Corresponding author
value. And georeferencing is applied after image matching through so called incremental bundle adjustment proposed in the Structure-From-Motion (SFM) approach (Snavely , 2011). In this study, we implemented incremental bundle adjustment process independently, aiming to achieve photogrammetrically more rigorous global bundle adjustment. The major difference between SFM and ours is that SFM uses DLT as sensor’s geometric model and we used photogrammetric collinear models. We applied global block adjustment to initially estimated EO parameters. And we tried to extract point cloud with adjusted EO parameters.
We assumed that adjusted EO value reproduce the geometry of each image well. On that basis, we applied the traditional photogrammetry-based image matching techniques. We tried to apply two types of matching: an object space-based matching technique and an image space-based matching technique. We compared the performance of the two techniques. We aimed to apply matching to all the pixels within the target region. Any post-processing and interpolation was not carried out for comparison of the matching performance.
2. DATASET AND INITIAL PROCESSING
For experiments, we used 58 number of images taken by a Smart-one UAV. Figure 1 and 2 show the smart-Smart-one UAV and test images. Table 1 summarize the inner orientation parameters of each image for tiepoint extraction. We set the coordinates system to UTM zone 52 S.
Figure 1. SmartOne UAV [http://smartplanes.se/]
UAV image acquisition area is over the campus of Inha University of Korea. The area contains mostly flat ground with a few campus buildings on the boundary of the area.
Figure 2. Experiment images
Table 1. Properties of UAV images (interior orientation parameters)
Focal length (mm)
Pixel size (um)
Column size (pixel)
Row size (pixel)
18.00 4.79 4928 3264
The accuracy of on-board GPS/INS sensors of UAV platform is lower than that of airplanes. This may derive serious match errors and poor geospatial results. Therefore updating of EO parameters with global bundle adjustment is required. As mentioned before, we applied the photogrammetric incremental bundle adjustment, implemented in-house, to UAV images. We used the FAST/ORB algorithm for automatic extraction of tiepoints, and extracted about 55,000 tiepoints in 58 images.
For global optimization, we implemented a global optimization scheme for finding optimal pairs (or groups) based on maximum spanning tree algorithm, Based on tiepoints extracted among images, connectivity of images were represented by a tree. The
bundle adjustment was carried out iteratively from the base image following connections within the tree.
Figure 3. Maximum spanning tree with experiment dataset
After performing bundle adjustment, we generated a list of global 3D tiepoints, whose geometric stability had been verified. Figure 4 shows a result of 3D tiepoint extraction in the model space. Among 55,000 tiepoints, about 8000 points were created as 3D tiepoints. Using thse 3D tiepoints, we applied global bundle adjustment and updated EO parameters per image.
Figure 4. Initial Point Cloud after bundle adjustment
In order to verify the performance of adjusted EO value, Y-parallax between individual stereo pairs was calculated. The average Y-parallax of all stereo pairs among 58 images showed a mean of 0.016 pixel and an absolute mean of 1.44 pixel. This small Y-parallax indicates that our photogrammetric incremental bundle adjustment had achieved accurate sensor orientations over all images. As a result of the bundle adjustment, reliable EO values were achieved and used for performing image matching process.
3. OBJECT SPACE-BASED MATCHING
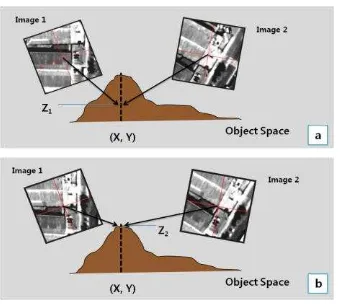
Object space-based matching method, which called vertical locus line method (VLL), was applied. This approach was reported to be a suitable for extraction of point cloud using a multiple image matching (Rhee et al, 2013). In order to apply this technique, the establishment of an accurate sensor model was reported as a necessary precedence.
Figure 5. Concept of matching in the object space. (a) Mismatched point, (b) Matched point
The size of search window for calculation of correlation coefficient is important. If the search window size is large, matching result is a reliable but it is difficult to capture detailed representation. If too small, it is possible to reverse detailed representation but noise will also be increased.
If the resolution and quality of images are different from each other, the use of the search window with fixed size is a disorder factor to generate a dense point cloud. To solve this problem, Noh et al. (2011) used searching window of adaptively varying size. In this study, we used a multi-dimensional search window at the same time for stable and accurate matching. Multi-dimensional search window consists of a full, upper left, upper right, lower left, lower right direction, based on one of the search window. And also the size of search window is set differently for each step (Figure 6).
Figure 6. Multi-Dimensional Search window (5 step)
The correlation coefficient was calculated in each of search window size. For each height, we generated 25 correlation coefficients. After correlation calculation was completed in all height step, we determined the height step with the highest correlation coefficient for each window. When the value of height has been determined for one particular window, we represent that it has one ‘hit’. The height with the largest number of hits is determined as the height of the grid under consideration.
Figure 7 illustrates the result of calculating the correlation coefficients for a total of five search windows in five height steps. In the search window W1, height H1 has the highest correlation coefficient. However, in the calculation result of the all of the search window, we can show that the hit count of H1 is twice and the Hit count of H4 is three times. In this method, it was determined H4 to the value of the final height.
Figure 7. Object space-based matching with multi-dimensional search window (5 windows and 5 step)
We can determine the quality of point cloud by adjusting hit count threshold. If hit count threshold is high, it brings point cloud with small number of blunders but number of matching points is also reduced. If the threshold value is set smaller, it brings point cloud with large number of blunders but the total matching points will be increased. The comparison results shall be reported in section 5.
4. IMAGE SPACE-BASED MATCHING AND GLOBAL OPTIMAZATION
In addition to an image matching method, it was applied to the image space-based matching technique on the epipolar geometry. If the geometric models are established correctly, a point in the base image is presented on the epipolar line of the target image. With this characteristic, epipolar-based image matching algorithm may work.
In this paper, we used stereo image matching algorithm with multi-dimensional search window, same as object space-based matching, and relaxation techniques.
Since the image-based matching technique used here is a stereo matching method, there is a need for selecting an appropriate image pair. For this, we used the maximum spanning tree shown in figure 3. We selected the images connected within the tree as pairs and applied matching.
Convergence angle between a pair was also considered to form a pair. For match region definition, minimum overlaps among the selected pairs (or groups) were aimed for fast processing.
5. EXPERIMENTS
Followings are a point cloud produced by each matching technique using the test data. Results were represented by the DSM type. We set a GSD of each point cloud DSM as 0.125m. As mentioned, post-processing and interpolation were not carried out for comparison of the matching performance itself.
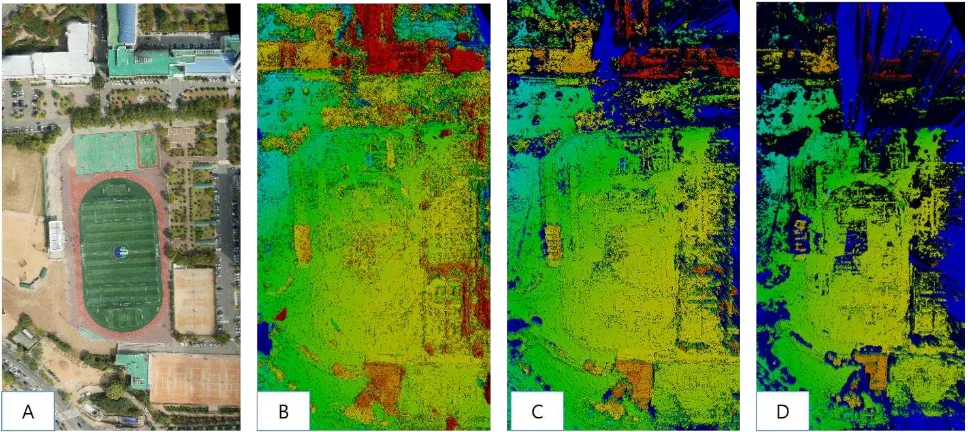
Figure 8. Point cloud results using object space-based matching with hit threshold (A: mosaic image, B: Hit 5, C: Hit 7, D: Hit 10)
Figure 9. Example of Point cloud results using image space-based matching (each stereo pair results)
Figure 10. Point cloud results (A: object space-based
fixed horizontal position in the object space. If hit count threshold was 5, it showed larger number of matching points than hit 7 and 10. And we observed more blunders than other threshold also. In the case of hit 10, noise was reduced, but the large number of holes occurred. We observed a lot of holes in the facade of the building or moving objects
Figure 9 shows the examples of point cloud results from individual stereo pair using image space-based matching. Figure 10B is the point cloud integration into global area. Due to the characteristics of stereo-base matching, 3D point clouds over the bush, tree and non-texture area were not generated well. We observed the image-based matching had better representation of height details. In case of object space-based matching results, we observed more blunders than image-based matching ones and noisy local height variations.
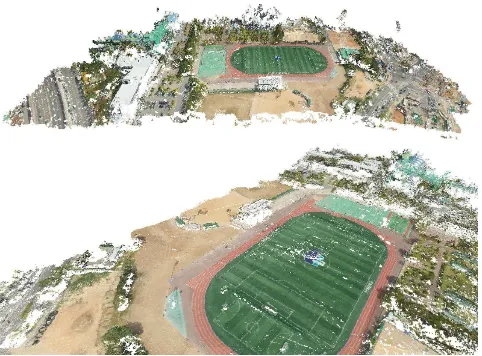
Figure 11 is a point cloud extraction result with RGB colour information. From these results, we were able to verify that calculated EO parameters through the block adjustment could be trusted. Considering these matching techniques known to be sensitive to sensor model accuracy, we could confirm the The International Archives of the Photogrammetry, Remote Sensing and Spatial Information Sciences, Volume XLI-B1, 2016
6. CONCLUSION
From experiments, we confirmed that through image matching and global optimization of sensor orientations, 3D point clouds were generated successfully. However, results also revealed some limitations. In case of image-based matching results, we observed holes in point clouds. In case of object space-based matching results, we observed more blunders than image-based matching ones and noisy local height variations. The work in this paper is still ongoing. We will further test our approach with more precise orientation parameters.
7. REFERENCES
Haala, N., & Rothermel, M., 2012. Dense multiple stereo matching of highly overlapping UAV imagery. ISPRS-International Archives of the Photogrammetry, Remote Sensing and Spatial Information Sciences, 39, B1.
Jeong, J., and Kim, T., 2014, Analysis of Dual-Sensor Stereo Geometry and Its Positioning Accuracy, Photogrammetric Engineering and Remote Sensing, 80(5):653-661
Noh, M., Cho, W. and Bang, G., 2012, Highly Dense 3D Surface Generation Using Multi-image Matching, ETRI Journal, 34(1):87-97.
Rhee, S., Kim, T., and Park, W., 2013. Precision DEM extraction using pseudo GCPs with ALOS/PRISM data, Proceedings of International Symposium on Remote Sensing, Chiba, Japan, 15-17 May 2013
Snavely, N. Bundler, 2011. Structure from Motion (SFM) for Unordered Image Collections; Available online: phototour.cs.washington.edu/bundler/ (accessed on 13 January 2011).
Turner, D., Lucieer, A., & Watson, C., 2012. An automated technique for generating georectified mosaics from ultra-high resolution unmanned aerial vehicle (UAV) imagery, based on structure from motion (SfM) point clouds. Remote Sensing, 4(5): 1392-1410.
Figure 11. Point cloud results with colour information (using object space-based matching)
![Figure 1. SmartOne UAV [http://smartplanes.se/]](https://thumb-ap.123doks.com/thumbv2/123dok/3292919.1403775/2.595.98.256.162.238/figure-smartone-uav-http-smartplanes-se.webp)