www.elsevier.com/locate/eja
Performance and application of the APSIM Nwheat
model in the Netherlands
S. Asseng
a,b,
*, H. van Keulen
b
, W. Stol
b
aCSIRO Plant Industry, Private Bag PO, Wembley, WA 6014, Australia
bDLO-Research Institute for Agrobiology and Soil Fertility (AB-DLO), PO Box 14, NL-6700 AA Wageningen, The Netherlands
Accepted 25 August 1999
Abstract
APSIM Nwheat is a crop system simulation model, consisting of modules that incorporate aspects of soil water, nitrogen (N ), crop residues, and crop growth and development. The model was applied to simulate above- and below-ground growth, grain yield, water and N uptake, and soil water and soil N of wheat crops in the Netherlands. Model outputs were compared with detailed measurements of field experiments from three locations with two different soil types. The experiments covered two seasons and a range of N-fertiliser applications. The overall APSIM Nwheat model simulations of soil mineral N, N uptake, shoot growth, phenology, kernels m−2, specific grain weight and grain N were acceptable. Grain yields (dry weight) and grain protein concentrations were well simulated with a root mean square deviation ( RMSD) of 0.8 t ha−1 and 1.6 protein%, respectively. Additionally, the model simulations were compared with grain yields from a long-term winter wheat experiment with different N applications, two additional N experiments and regional grain yield records. The model reproduced the general effects of N treatments on yields. Simulations showed a good consistency with the higher yields of the long-term experiment, but overpredicted the lower yields. Simulations and earlier regional yields differed, but they showed uniformity for the last decade.
In a simulation experiment, the APSIM Nwheat model was used with historical weather data to study the relationship between rate and timing of N fertiliser and grain yield, grain protein and soil residual N. A median grain yield of 4.5 t ha−1 was achieved without applying fertiliser, utilising mineral soil N from previous seasons, from mineralisation and N deposition. Application of N fertiliser in February to increase soil mineral N to 140 kg N ha−1
improved the median yield to 7.8 t ha−1but had little effect on grain protein concentration with a range of 8–10%. Nitrogen applications at tillering and the beginning of stem elongation further increased grain yield and in particular grain protein, but did not affect soil residual N, except in a year with low rainfall during stem elongation. A late N application at flag leaf stage increased grain protein content by several per cent. This increase had only a small effect on grain yield and did not increase soil residual N with up to 40 kg N ha−1 applied, except when N uptake was limited by low rainfall in the period after the flag leaf stage. The economic and environmental optima in winter wheat were identified with up to 140 kg N ha−1in February, 90 kg N ha−1between tillering and beginning of stem elongation and 40 kg N ha−1 at flag leaf stage resulting in a median of 8.5 t ha−1 grain yield, 14.0% grain protein and 13 kg N ha−1 soil residual N after the harvest. The maximum simulated yield with maximum N input from two locations in the Netherlands was 9.9 t ha−1. © 2000 Elsevier Science B.V. All rights reserved.
Keywords:Grain protein; Modelling; Nitrogen uptake; Simulation; Soil nitrogen; Wheat crop; Yield
* Corresponding author. Tel.:+61-8-9333-6615; fax:+61-8-9387-8991. E-mail address:[email protected] (S. Asseng)
1. Introduction field measurements in different climates ( Keating et al., 1995; Probert et al., 1995, 1998; Asseng Optimising economic returns in high N input et al., 1998a,b; Meinke et al., 1998) and have been systems, while minimising loss of N to the environ- used in agronomic studies of farming system sustai-ment, is one of the challenges for modern agricul- nability in the eastern states of Australia ( Keating tural production ( Whitmore and Van Noordwijk, et al., 1995; Probert et al., 1995, 1998) and Western 1995). Field studies have been conducted to optim- Australia (Asseng et al., 1998a).
ise N fertiliser in wheat production, but the results This paper aims (1) to evaluate the performance are always season-specific (e.g. Spiertz and Ellen, of the APSIM Nwheat model against a wide range 1978; Spiertz and Van de Haar, 1978; Ellen and of detailed field measurements in the temperate Spiertz, 1980; Chaney, 1990; Darwinkel, 1998). maritime climate of the Netherlands, and (2) to Crop models have been used to optimise manage- use the model in a simulation experiment to study ment practices under variable environments ( Van interactions between N-fertiliser application and Keulen and Seligman, 1987; Stapper and Harris, grain yield, grain protein and soil residual N. 1989; Keating et al., 1991; Meinke et al., 1993;
Savin et al., 1995; Thornton et al., 1995; Asseng
et al., 1998a) and application of a simulation 2. Material and methods model may be useful in extrapolating results from
such experiments. However, such simulation 2.1. APSIM Nwheat model models require rigorous testing against a wide
range of field experimental data before they can APSIM is a software tool that enables modules be used with confidence (Monteith, 1996; O’Leary (or sub-models) to be linked to simulate agricul-and Connor, 1996). Groot agricul-and Verberne (1991)
tural systems (McCown et al., 1996). Examples of have published a detailed data set, covering
modules include crops, pastures, soil water, nitro-different sites, seasons and N regimes in the
gen and erosion. Four modules, i.e. wheat crop Netherlands to validate simulation models for
(NWHEAT ), soil water (SOILWAT ), soil N nitrogen dynamics in crop and soil. Parts of these
(SOILN ) and crop residue (RESIDUE ) are most data have been used to validate models, with
relevant to the simulation of wheat-based cropping various success (De Willigen, 1991). Whereas most
systems. These modules have evolved from experi-of these models dealt with the above-ground
pro-ences in Australia with the CERES crop and soil cesses more or less adequately, simulation of
models ( Ritchie et al., 1985; Jones and Kiniry, below-ground processes was more problematic. In
1986), and the PERFECT model (Littleboy et al., particular, processes of N mineralisation and
1992), as modified by Probert et al. (1995, 1998). immobilisation, which are related to soil
microbio-The main differences of the APSIM Nwheat model logical activities, were poorly simulated (De
to the CERES wheat model are summarised by Willigen, 1991).
Probert et al. (1995) and Asseng et al. (1998b). The APSIM (Agricultural Production Systems
Documented model source code in hypertext Simulator) Nwheat model comprises crop growth,
format can be obtained by writing to Dr B.A. soil water, nitrogen and crop residue modules
Keating (CSIRO Division of Tropical Agriculture, (McCown et al., 1996) and enables simulation of
Brisbane, Australia, e-mail: brian.keating@c-their interactions. The wheat crop, soil water and
netns.tcp.csiro.au) or can be viewed at www.apsim-soil nitrogen modules ( Keating et al., 1995; Probert
help.tag.csiro.au. et al., 1995, 1998) have been derived from the
CERES models of Ritchie et al. (1985) and Jones
2.2. Experimental data
and Kiniry (1986), which have been widely tested and applied (e.g. Ritchie et al., 1985; Otter-Nacke
The APSIM Nwheat model with modules et al., 1986; Savin et al., 1994, 1995; Thornton et al.,
NWHEAT, SOILWAT, SOILN and RESIDUE in 1995; Toure´ et al., 1995). Results of the APSIM
meas-Table 1
Experimental sites used for simulation — observation comparisons (Groot and Verberne, 1991)
Location Latitude (°N ) Longitude (°W ) Soil type Rainfall (mm)
The East 52.4 5.4 Silty loam 646a
PAGV 52.3 5.3 Silty loam 646a
The Bouwing 51.6 5.4 Silty clay loam 763b
aAverage annual rainfall between 1974 and 1988. bAverage annual rainfall between 1954 and 1996.
urements from 18 treatments at three locations N treatments are listed in Table 2.
These data sets include frequently measured and two seasons, published by Groot and Verberne
(1991). These data were used for a statistical shoot biomass, shoot N content, leaf area, grain yield and its components, grain N, phenological analysis of model performance. An additional
qualitative test, involving the comparison of simu- development stages, changes in soil water, ground-water table depth and soil N and are described in lated with measured data, was carried out with (1)
grain yields from a long-term winter wheat detail by Groot and Verberne (1991).
To account for a continuous wet and dry depos-field experiment at Lovinkhoeve ( K.B. Zwart,
AB-DLO, pers. comm.), (2) yield data from ition of N in the Netherlands of about 35–50 kg N ha−1year−1 (Neeteson and Hassink, experiments by Spiertz and Ellen (1978) and
Spiertz and Van de Haar (1978) and (3) grain 1997), a monthly N deposition of 3 kg N ha−1of ammonium nitrate for sites at the Eest and PAGV yields from the Gelderland region (Crop Estimates,
Statistics Netherlands, Voorburg). All grain yields and 4 kg N ha−1for the Bouwing was assumed for all model simulations.
refer to dry matter weight, and all grain protein
contents are based on grain dry weight. The soil characteristics are listed in Tables 3a and 3b. Simulations were initialised using the first soil water and soil N measurements of each season
2.2.1. Field measurements after Groot and
Verberne (1991) (Groot and Verberne, 1991). Hence, all the first soil measurements were excluded from the statisti-Measured data sets from field experiments from
two Polder sites, a silty loam at the Eest and at cal performance test.
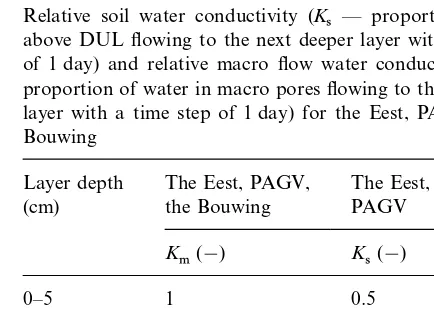
Estimated quantities of residues used to ini-PAGV (near Swifterbant), and from a third site,
a silty clay loam at the Bouwing (near Wageningen) tialise the model are presented in Table 4.
SOILN module parameters for the effects of the Netherlands, were used for model validation.
A site description is given in Table 1. soil water content on the processes of
mineralisa-Table 2
N-fertiliser treatments (N1, N2 and N3) after Groot and Verberne (1991)a
Location Year N1 (kg N ha−1) N2 (kg N ha−1) N3 (kg N ha−1)
The East 1983 0 60 120+40
1984 50+60 50+60+40 50+60+40
PAGV 1983 80 60+80 60+140+40
1984 80 80+60+40 80+120+40
The Bouwing 1983 0 60 120+40
1984 70 70+60+40 70+120+40
Table 3a
Soil characteristics for the Eest, PAGV and the Bouwinga
Layer depth (cm) The Eest PAGV The Bouwing
Silty loam Silty loam Silty clay loam
LL (m3m−3) DUL (m3m−3) OC (kg kg−1) OC (kg kg−1) LL (m3m−3) DUL (m3m−3) OC (kg kg−1)
0–5 0.09 0.34 0.030 0.023 0.18 0.39 0.028
5–10 0.09 0.34 0.030 0.023 0.18 0.39 0.028
10–20 0.09 0.34 0.030 0.023 0.18 0.39 0.028
20–30 0.10 0.34 0.030 0.023 0.18 0.39 0.028
30–40 0.12 0.35 0.020 0.018 0.18 0.37 0.014
40–60 0.14 0.37 0.020 0.018 0.20 0.37 0.014
60–80 0.14 0.39 0.018 0.018 0.20 0.37 0.012
80–100 0.14 0.39 0.018 0.018 0.20 0.37 0.012
100–130 0.14 0.39 0.010 0.010 0.20 0.37 0.010
130–200 0.14 0.39 0.010 0.010 0.20 0.37 0.010
Total (mm) 264 757 392 746
aLL: lower limit for plant available soil water; DUL: drained upper limit; OC: soil organic carbon. Data after Groot and Verberne (1991). LL and DUL for PAGV are the same as for the Eest.
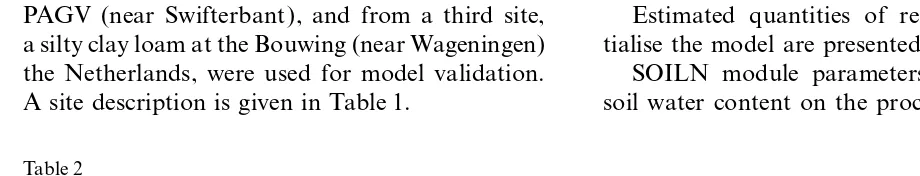
Table 3b cients [after Ritchie et al. (1985)] for Arminda are
Relative soil water conductivity (K
s — proportion of water given in Table 5.
above DUL flowing to the next deeper layer with a time step of 1 day) and relative macro flow water conductivity (K
m—
proportion of water in macro pores flowing to the next deeper 2.2.2. Grain yields from a long-term winter wheat layer with a time step of 1 day) for the Eest, PAGV and the
experiment at Lovinkhoeve Bouwing
Simulation results were compared with grain yields from a long-term winter wheat experiment
Layer depth The Eest, PAGV, The Eest, The
(cm) the Bouwing PAGV Bouwing at Lovinkhoeve (near the Eest site, same soil type
as at the Eest) with three N treatments (0, 38 and
K
m(−) Ks(−) Ks(−) 188 kg N ha−1) between 1974 and 1987 ( K.B. Zwart, AB-DLO, pers. comm.). The wheat variety
0–5 1 0.5 0.5
5–10 1 0.5 0.5 Arminda was sown in most years, except in 1974
10–20 1 0.5 0.5 when Clement, and 1975, 1977 when Lely was
20–30 1 0.5 0.5
sown. Since Arminda, Clement and Lely are
rela-30–40 1 0.5 0.5
tively similar in phenology and yield parameters,
40–60 1 0.4 0.5
the genetic coefficients of Arminda were used for
60–80 1 0.3 0.5
80–100 1 0.1 0.5 all the simulations. In every fourth year, no yield 100–130 1 0.1 0.3 data were available from the long-term experiment
130–200 0.6 0.001 0.001
due to a specific rotation ( K.B. Zwart, AB-DLO, pers. comm.).
For two years, in 1976 and 1977, additional yield measurements from N-fertiliser experiments tion and nitrification, and the potential
decomposi-tion rates for soil organic matter (0.00015 day−1) at the same location by Spiertz and Ellen (1978) and Spiertz and Van de Haar (1978) were included and microbial biomass (0.0081 day−1) were used
as suggested by Probert et al. (1998) for clay soils in the comparison. Each year was re-initialised with the soil water and sowing conditions from in Queensland, Australia.
Table 4
Initial plant residues for 17 October 1982 and 1983, for the Eest, PAGV and the Bouwing
Location The Eest PAGV The Bouwing
1982, 1983 1982 1983 1982, 1983
Above ground
Amount (t ha−1) 4.0 4.0 2.0 4.0
C:N ratio 50 50 50 50
Relative potential decomposition rate (d−1) 0.05 0.05 0.05 0.05 Root residues
Amount (t ha−1) 1.5 1.5 1.0 1.5
C:N ratio 50 50 50 50
Residue type Potatoes Sugarbeets Sugarbeets Potatoes
Table 5
Wheat genotype coefficients for cv. Arminda
Arminda Coefficient Explanation
4.0 p1v Sensitivity to vernalisation [1 ( lowest)–5 (highest)] 4.0 p1d Sensitivity to photoperiod [1 ( lowest)–5 (highest)]
640 p5 Thermal time (base 0°C ) from beginning of grain filling to maturity (°Cd )
32 Grno Coefficient of kernel number per stem weight at the beginning of grain filling [kernels (g stem)−1] 2.5 Fillrate Potential kernel growth rate [mg kernel−1day−1]
3.0 stwt Potential final dry weight of a single stem, excluding grain (g stem−1) 100 phint Phyllochron interval
Table 4; Section 2.2.1). A low mineral N content 4 kg N ha−1 of ammonium nitrate was included (Neeteson and Hassink, 1997). Since none of the at sowing (5 kg N ha−1) was assumed for each
year, and a monthly N deposition of 3 kg N ha−1 initial conditions or proportions of soil types were known for the wheat growing area in the of ammonium nitrate was included (Neeteson and
Hassink, 1997). Gelderland region, initial soil and sowing
condi-tions from the Bouwing 1982 (Groot and Verberne, These comparisons between simulated and
observed yields allowed another qualitative model 1991; Table 4; Section 2.2.1) were used as the nearest approximation. This allowed an additional test of N, season and growth interactions.
However, caution should be paid to the interpreta- qualitative model test of season–yield interactions over a long number of seasons, but as mentioned tion of model performance with estimated initial
conditions, since initial conditions could have been in Section 2.2.2, test results will be limited by the estimation of initial conditions, but also by very different in some years and might not reflect
the true model performance. different earlier farming practices.
2.3. Weather data 2.2.3. Grain yields from the Gelderland region
A simulation was carried out with
200 kg N ha−1 using Wageningen weather data Daily data for solar radiation, maximum and
minimum temperature and rainfall from
from 1975 to 1996. Simulation results were
com-pared with grain yields from winter wheat yields Swifterbant from 1974 to 1988 (near the Eest and PAGV ) and Wageningen from 1975 to 1996 (near of the Gelderland region between 1975 and 1996
(Crop Estimates, Statistics Netherlands, the Bouwing) were made available by the Department of Meteorology of Wageningen
Agricultural University. Fig. 1 presents summar- 2.5. Simulation experiments
ised average monthly weather data for
A simulation experiment was carried out to Wageningen.
study the effect of rate and timing of N-fertiliser applications on predicted grain yield, grain protein and soil residual N for a silty loam at the Eest,
2.4. Quantification of model performance
using weather data from the nearest weather sta-tion at Swifterbant, 1974–1988. Six N-fertiliser Model performance was quantified for data
treatments (A, B, C, D, E and F ) were applied at from the Eest, PAGV and the Bouwing (Groot
different growth stages described by a decimal and Verberne, 1991). Since there is no single means
code (DC ) (Zadoks et al., 1974) as shown in to quantify the performance of a model, a range
Table 6. of performance indicators was calculated. To assess
The initial, crop residue and sowing conditions model performance, a correlation analysis was
for this simulation experiment were identical to carried out, and the coefficient of determination
the Eest 1982/1983 simulations (Groot and for the 1 to 1 ory=xline [r2(1:1), which is NOT
Verberne, 1991; Table 4; Section 2.2.1), except for for the fitted regression line] was computed, which
the initial soil mineral N profile. Simulations were measures the true deviation of the estimates from
initialised before each simulation with the relative observations. The slope (m) is presented to
quan-low soil N profile from PAGV in 1982 (Groot and tify a possible over- or underestimation, calculated
Verberne, 1991; Section 2.2.1) to avoid any addi-from a best-fit regression line forced through the
tional N effects from residual soil mineral N of a origin. Note that a traditional regression analysis
previous year. was carried out only to show the slope, but not to
A second simulation experiment was carried out produce a coefficient of determination for a fitted
to study the effect of zero (0) and maximum (max) line, which is not relevant to a model validation
N-fertiliser applications ( Table 6) on predicted (Mitchell, 1997). Another indicator of model
per-grain yield, per-grain protein and soil residual N. formance, which also represents the true deviation
Simulations were done for a silty loam at the Eest of the estimates from observations, the root mean
using weather data from the nearest weather sta-square deviation (RMSD), i.e. the root of the
mean squared error of prediction (MSEP) after
Table 6
Wallach and Goffinet (1989), was computed to
Simulation experiment treatments with different N
provide a measure of the absolute magnitude of
applicationsa
the error.
Treatment N application (kg N ha−1) at growth stage:
February DC23 DC31 DC39
aTreatments (A)–(F ) received a N application based on Fig. 1. Average monthly solar radiation (———), maximum 140 kg N ha−1minus soil mineral N (Nmin) of the soil profile 0–100 cm on 17 February of each year. Treatment maximum (– – – –) and minimum ( · · · ) temperature and rainfall
(entire bars) based on 31 years of weather data from (max) N received a N application based on 220 kg N ha−1 minus soil mineral N of the soil profile 0–100 cm on 17 February Wageningen, the Netherlands. The dark lower parts of the bars
Table 7
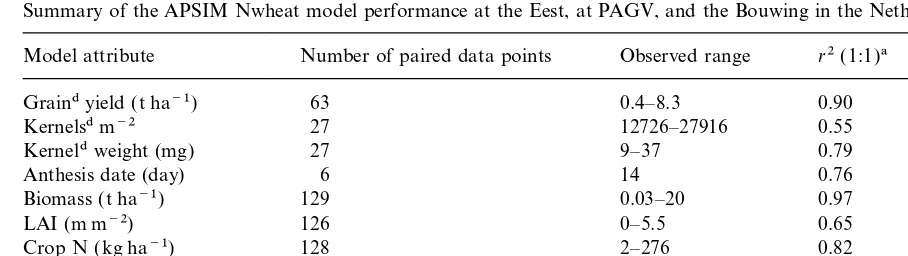
Summary of the APSIM Nwheat model performance at the Eest, at PAGV, and the Bouwing in the Netherlands
Model attribute Number of paired data points Observed range r2(1:1)a mb RMSDc
Graindyield (t ha−1) 63 0.4–8.3 0.90 0.96 0.8
Kernelsdm−2 27 12726–27916 0.55 0.95 2604
Kerneldweight (mg) 27 9–37 0.79 1.04 3.9
Anthesis date (day) 6 14 0.76 0.98 3.7
Biomass (t ha−1) 129 0.03–20 0.97 1.02 1.2
LAI (m m−2) 126 0–5.5 0.65 1.28 1.2
Crop N (kg ha−1) 128 2–276 0.82 1.03 28.5
GraindN (kg ha−1) 63 10–204 0.88 0.98 22.4
Grain protein (%) 18 7.1–15.6 0.59 1.00 1.6
Soil mineral N (kg ha−1) 546 0–78 0.46 0.75 9
ar2(1:1)=r2for the 1 to 1 line (y=x).
bSlope of linear regression (forced through the origin). cRoot mean square deviation.
dIncluding pre-maturity harvests.
tion at Swifterbant, 1974–1988 and a silty clay been summarised in Table 7. The observed grain yields ranged from 4.5 t ha−1 (or when including loam at the Bouwing, using weather data from the
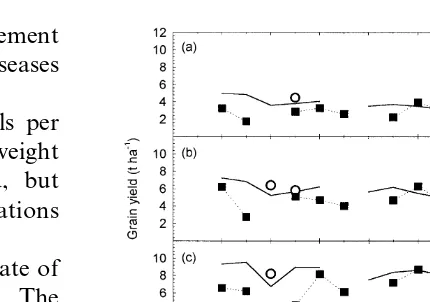
nearest weather station at Wageningen, 1955–1996. pre-maturity harvests from as low as 0.4 t ha−1) to 8.3 t ha−1 (Fig. 2). The yield simulations cap-tured the response to season and N-fertiliser effects with a coefficient of determination of r2 (1:1) of 3. Results
0.90 and RMSD of 0.8 t ha−1.
A comparison of simulated and observed yields Winter wheat crops were generally sown at the
end of October, emerged before the beginning of from a long-term experiment at Lovinkhoeve is shown in Fig. 3. The higher yields of this experi-winter (December), were dormant over experi-winter,
started to grow again after winter in about ment and the reported grain yields by Spiertz and Ellen (1978) and Spiertz and Van de Haar (1978) February/March and reached anthesis in June and
maturity in August. Rainfall was usually evenly in 1976 and 1977 for the three N treatments were well simulated. However, simulated and observed distributed throughout the season. Soil types were
favourable for root growth with a groundwater yields showed larger differences in particular with overestimations in seasons with lower yields. Note table at about 1 m below surface, restricting root
growth in most of the years. Due to the high that the simulated crop was killed in 1979 due to severe frost during winter by a frost kill function, water-holding capacity of the soils and a shallow
water table, periods without rainfall did not cause which accelerates leaf senescence in the NWHEAT module. A frost-hardening routine is currently not any severe water deficits. However, a lack of
rainfall might have delayed the uptake of applied available in NWHEAT. No simulated yields are presented for this year.
fertiliser in some years.
When comparing simulated yields at the Bouwing with regional yields from Gelderland
3.1. Performance of the APSIM Nwheat model in
the Netherlands from 1975 to 1996, much lower yields were mea-sured than simulated during the 1970s and early 1980s, but a good correlation occurred in the last Simulations with the APSIM Nwheat model
have been compared to more than 1200 actual simulated decade (Fig. 4). The early discrepancy reflects a ‘technology gap’ between the simulations measured values. The performance of the
manage-ment and modern varieties) and crop managemanage-ment in the seventies with partial control of diseases (e.g. mildew) and in particular less N input.
The yield components: number of kernels per m2 [r2 (1:1)=0.55] and specific kernel weight (r2=0.79) were reasonably well simulated, but were less accurate than grain yield simulations ( Table 7).
The coefficient of determination for the date of 50% anthesis was high (r2=0.76, Table 7). The overall phenology simulations were found to be good.
Simulations of biomass production were very
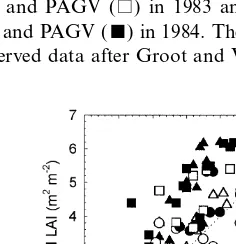
good with r2 (1:1) of 0.97 ( Fig. 5, Table 7). In Fig. 3. Simulated (———) and observed (&: long-term winter
contrast to the biomass simulations, leaf area index wheat experiment at Lovinkhoeve, K. B. Zwart, AB-DLO, pers. comm.) grain yields with (a) 0 kg N ha−1, (b) 38 kg N ha−1,
(LAI ) simulations were poor with a coefficient of
and (c) 188 kg N ha−1from 1974 to 1987. Additional measured
determination r2 (1:1) of 0.65 ( Table 7) and a
grain yields (#) with 50 and 200 kg N ha−1 in 1976 (Spiertz
tendency of overpredicting LAI (m=1.28, Table 7;
and Ellen, 1978) and 0 and 50 kg N ha−1in 1977 (Spiertz and
Fig. 6). Frequently, the model tended to under- Van de Haar, 1978). No measured yields were available at every estimate the rapid senescence of leaves when fourth year from the long-term winter wheat experiment ( K.B. Zwart, pers. comm.). Note, no simulated yield was available for 1979 due to simulated frost kill. Solid bars in (c) show annual rainfall amounts.
approaching maturity. At two times (the East, N1 treatment, 18 July 1983 and PAGV, N1 treatment, 19 July 1983), the simulated LAI was still above 1.0 while leaves were already fully senesced in the field experiments ( Fig. 6).
Total crop N (kg N ha−1) simulations were reasonable with a coefficient of determination r2 (1:1) of 0.82 ( Table 7; Fig. 7), with a tendency to
Fig. 2. Model performance for grain yields. Simulated ( lines) and observed (symbols) grain yields for treatment N1 ($———) and N3 (6· · · ) at (a) the Eest in 1983, (b) PAGV in 1983
Fig. 4. Simulated grain yields with 200 kg N ha−1 at the and (c) the Bouwing in 1984 ( Table 2). (d ) Simulated versus
observed grain yields at the Bouwing (6), the Eest (#) and Bouwing (———) and Gelderland regional yields (n: Crop
Estimates, Statistics Netherlands, Voorburg) from 1975 to 1996. PAGV (%) in 1983 and the Bouwing (+), the Eest ($)
and PAGV (&) in 1984. Small symbols are pre-maturity har- Note, no simulated yields were available for 1979, 1985 and 1987 at the Bouwing due to simulated frost kill. Solid bars show vests. The dotted line is the 1 to 1 line. Observed data after
over predict slightly at lower crop N content and larger variations above 100 kg N ha−1of crop N.
Simulated and observed patterns of total shoot biomass production, LAI and crop N for two different N applications on a silty loam at the Eest in 1983 are shown in Fig. 8. Increasing the N application from 0 to 160 kg N ha−1 had a large effect on observed total shoot biomass production, which was also reproduced by the model [Fig. 8(a)]. The simulations appropriately reflected the differences in LAI between the two N
treat-Fig. 5. Model performance for total shoot biomass. Simulated ments [Fig. 8(b)]. However, LAI was over-versus observed total shoot biomass at the Bouwing (6), the predicted between the end of tillering ( late April ) Eest (#) and PAGV (%) in 1983 and the Bouwing (+), the
and flag leaf stage (end May). The model provided
Eest ($) and PAGV (&) in 1984. The dotted line is the 1 to 1
a satisfactory simulation of crop N (above-ground
line. Observed data after Groot and Verberne (1991).
biomass N ) dynamics for the two N treatments shown in Fig. 8(c). Note the sudden drop of about 80 kg N ha−1in the measured crop N amounts of the high N treatment during grain filling at 20 July, which might suggest the presence of a larger variability in the actual measurements.
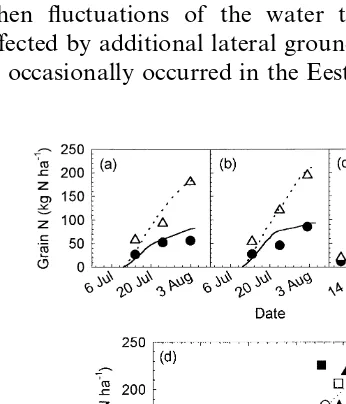
The model simulated grain N (kg ha−1)
Fig. 6. Model performance for LAI. Simulated versus observed LAI at the Bouwing (6), the Eest (#) and PAGV (%) in 1983
and the Bouwing (+), the Eest ($) and PAGV (&) in 1984. The dotted line is the 1 to 1 line. Observed data after Groot and Verberne (1991).
Fig. 8. Effects of N fertiliser on shoot biomass production, LAI Fig. 7. Model performance for total above ground crop N. and crop N. Simulated ( lines) and observed (symbols) for N1 ($———) and N3 (+- - -) fertiliser treatments at the Eest, 1983 Simulated versus observed crop N at the Bouwing (6), the Eest
(#) and PAGV (%) in 1983 and the Bouwing (+), the Eest (Table 2); (a) total shoot biomass production, (b) LAI and (c) crop N. The arrow indicates the date of observed anthesis. ($) and PAGV (&) in 1984. The dotted line is the 1 to 1 line.
response to N-fertiliser applications and different seasons reasonably well, resulting in a coefficient of determination of r2 (1:1) of 0.88 ( Table 7; Fig. 9).
Grain protein is derived from the ratio of grain N to grain yield. The measured protein concen-tration ranged from 7 to 16%, whereas the simu-lated protein ranged from 8 to 16%. The model was able to reproduce the general trend of grain protein response to N-fertiliser application, but could differ in some cases by several protein% from measured values, e.g. in the Bouwing 1984 [Fig. 10(a)]. Grain protein% simulations had a coefficient of determination ofr2(1:1) of 0.59 and RMSD of 1.6 [ Table 7; Fig. 10(b)].
The dynamics of soil water contents were well simulated for wet and dry seasons [Fig. 11(a) and (b)] when the bypass flow was neglectable and when fluctuations of the water table were not affected by additional lateral ground water inflow,
as occasionally occurred in the Eest and PAGV in Fig. 10. Model performance for grain protein%. (a) Simulated ( lines) and observed (symbols) grain protein%for three N treat-ments ( Table 2) at PAGV in 1983 ($———) and at the Bouwing in 1984 (6· · · ). (b) Simulated versus observed
grain protein content at the Bouwing (6), the Eest (#) and
PAGV (%) in 1983 and the Bouwing (+), the Eest ($) and PAGV (&) in 1984. The dotted line is the 1 to 1 line. Observed data after Groot and Verberne (1991).
1983. No such effect was apparent at the Bouwing in 1984. Observed and simulated soil water contents in the silty clay loam at the Bouwing are shown in Fig. 11(c), for three dates in the growing season 1984. The model closely simulated soil water contents in the 1 m profile at the flag leaf stage (31 May), beginning of grain filling (4 July) and during grain filling (18 July).
It was possible to simulate the fluctuation of the groundwater table with the model by setting
k
m less than 1 and ks to a very low value in the bottom of the soil profile [ Table 3(b)]. However, the simulated water table depths were less sensitive
Fig. 9. Model performance for grain N. Simulated ( lines) and
than the measurements (not shown) due to
occa-observed (symbols) grain N for treatment N1 ($———)
and N3 (D · · · ) at (a) the Eest in 1983, (b) PAGV in 1983 sional bypass flow and additional lateral ground
and (c) the Bouwing in 1984 ( Table 2). (d ) Simulated versus water inflow. Nevertheless, bypass flow and addi-observed grain N at the Bouwing (6), the Eest (#) and PAGV tional lateral ground water inflow tended not to
(%) in 1983 and the Bouwing (+), the Eest ($) and PAGV (&)
affect the performance of any other model
compo-in 1984. Small symbols are pre-maturity harvests. The dotted
nents, including soil N dynamics and crop growth.
line is the 1 to 1 line. Observed data after Groot and
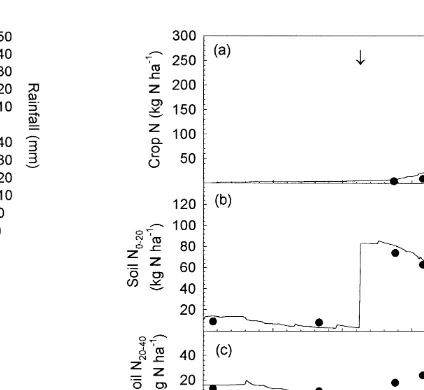
Fig. 12. Effects of N fertiliser on crop N and soil mineral N content. Simulated ( lines) and observed (symbols) for (a) crop N, (b) soil mineral N in 0–20 cm and (c) soil mineral N in 20– 40 cm at PAGV in 1983/1984. Treatment N1 ($———) with 80 kg N ha−1applied on 17 February 1984 and treatment N3 Fig. 11. Model performance for soil water. Simulated ( lines)
(+- - -) with 80 kg N ha−1applied on 17 February 1984, plus and observed (symbols) total soil water in 0–100 cm soil depth
120 kg N ha−1 on 14 May 1984 and 40 kg N ha−1on 8 June (N1 treatments, Table 2) for (a) a silty clay loam at the Bouwing
1984. Both simulations were initialised on 17 October 1983, in 1983 ($———) and (b) a silty loam at PAGV in 1984
with soil N measurements from 3 November 1983. The arrows (+· · · ). Solid bars show daily rainfall amounts. (c)
indicate the dates of N applications. Observed data after Groot Simulated and observed volumetric soil water contents on 31
and Verberne (1991). May ($———), 4 July (&– – –) and 18 July (+· · · ) 1983
for a silty clay loam at the Bouwing 1983. Observed data after Groot and Verberne (1991).
above-ground biomass and 27.9 kg N ha−1in the roots (root N not shown), slightly overestimating soil mineral N was acceptable, even though only
a relatively low coefficient of determination was the measured uptake [Fig. 12(a)]. During the same time, 4.9 kg N ha−1 was immobilised in soil obtained [r2 (1:1)=0.46, RMSD=9; Table 7]. In
particular, the pattern of mineral N in the soil was organic matter, 1.9 kg N ha−1 was lost through denitrification, and 0.02 kg N ha−1 was lost by generally simulated well by the model, considering
the variability and observed rapid changes. Fig. 12 NO
3leaching (not shown). These processes caused a reduction in soil mineral N of 118 kg N ha−1 shows the dynamics of crop and soil N in two
different N treatments on a silty loam at PAGV (including a monthly 3 kg N ha−1of N deposition, added to the surface layer on 31 May 1984), with in 1983/1984.
Fig. 13 shows simulated changes of N compo- most of the changes occurring in the top 20 cm [Fig. 12(b)]. A further breakdown of soil organic nents within the crop–soil system. Nitrogen
dynamics after the second N application of matter pools is shown in Fig. 13(b). The fresh organic matter pool increased its N content in this 120 kg N ha−1at 14 May 1984 are presented until
the day before the third N application at 7 June period by 5.5 kg N ha−1. This pool had received all the initial root residues and 95% of the initial 1984, for the highest N treatment at PAGV
1983/1984 (the same as the high N treatment in surface residues when ploughed in the soil on 17 October 1983. The microbial biomass pool showed Fig. 12). Fig. 13(a) indicates that in this period,
Fig. 13. Simulated change in N components within the crop– soil system for the period after the second N application of 120 kg N ha−1at 14 May 1984 until the day before the third N application at 7 June 1984 for the high N treatment (N3) at PAGV 1984 (the same N3 treatment as in Fig. 12). (a) Above-and below-ground crop N (- - - -), above-ground crop N (– – – –), soil organic matter N (– · – · –), denitrification loss ( · · · ) and soil mineral N (———). The arrow indicates a monthly N deposition of 3 kg N ha−1, added to the surface layer on 31 May 1984. (b) Fresh organic matter N (– · – · –), net N minerali-sation (– – – –), microbial biomass N (- - - -), surface residue N ( · · · ) and soil humus N (———).
Fig. 14. Simulated effects of rate and timing of N-fertiliser
appli-humus pool of 2.6 kg N ha−1 and in the surface
cation in addition to the main application in February at the
residue pool of 0.1 kg N ha −1. The loss of N is Eest ( Table 6). Cumulative probability distributions of (a) grain shown as negative. The net increase in soil organic yield, (b) grain protein and (c) soil residual N for treatments A (———), B (— —), C — 20 kg N ha−1at DC39 (– – – –),
matter N was due to N loss from decaying roots
D — 40 kg N ha−1 at DC39 (- - - - -), E — 60 kg N ha−1 at
feeding into the fresh organic matter pool.
DC39 ( · · · ) and F — 80 N kg ha−1at DC39 (– · – · –). All
However, there was a positive net mineralisation
treatments (A–F ) received a February N application.
of 4.7 kg N ha−1in this period (14 May to 7 June). Treatments B–F received 90 kg N ha
−1at DC23/DC31. 3.2. Simulation experiments
median of 8.7%. Soil residual N for treatment (A), however, ranged from 9 to 20 kg N ha−1 with a Probability distributions for grain yield, grain
protein and soil residual N for six different N median of 10 kg N ha−1. Simulated grain yields and grain protein [Fig. 14(a) and (b)] were largely applications for the Eest based on 14 years of
historical weather data from Swifterbant are pre- affected by the second and third N application (treatment B) during tillering (DC23) and the sented in Fig. 14. With N applied only in February
to increase the soil mineral N to 140 kg N ha−1 beginning of stem elongation (DC31), respectively, but hardly affected soil residual N, except during (treatment A), yields ranged from 5.8 to
8.6 t ha−1, with a median (=50% probability of the year 1985 with a dry period between 6 May and 13 June (average rainfall from 1974 to 1984 exceeding or 1 out of 2 years’ chance) of
8.4 t ha−1, and grain protein ranged from 11.3 to 13.5%with a median of 12.8%. Soil residual N for treatment (B) ranged from 9 to 49 kg N ha−1, with only a small increase in the median, compared to treatment (A), from 10 to 11 kg N ha−1.
Model simulations showed [Fig. 14(a) and (b)] that additional N fertiliser applied at the flag leaf stage (DC39) (treatments C, D, E and F ) had minimal effects on grain yields, but increased grain protein to medians of 13.5, 14.0, 14.9 and 15.0% when applying 20, 40, 60 and 80 kg N ha−1, respec-tively. Such an increase in applied N at DC39 hardly affected the median for residual N (13 kg N ha−1) with up to 40 kg N ha−1fertiliser, but increased the median to 18 and 31 kg N ha−1 with 60 and 80 kg N ha−1fertiliser applied, respec-tively [Fig. 14(c)]. However, the upper range in soil residual N was affected with each additional N application at DC39, reaching 68, 87, 106 and 125 kg N ha−1 with fertiliser applications of 20, 40, 60 and 80 kg N ha−1, respectively.
In a second experiment, grain yield, grain pro-tein and soil residual N were compared for zero (0) and maximum (max) N applications for the Eest, based on simulations with 14 years of histori-cal weather data from Swifterbant and for the
Bouwing, based on simulations with 31 years of Fig. 15. Simulated effects of zero (0) and maximum (max) N-fertiliser application at the Eest and at the Bouwing.
historical weather data from Wageningen
Cumulative probability distributions of (a) grain yield, (b) grain
(Fig. 15). The additional N-fertiliser applications
protein and (c) soil residual N for the Eest 0 (———) and max
in the maximum N treatment had minor effects on (- - - - -) and the Bouwing 0 (– – – –) and max ( · · · ). grain yield and protein, but increased the soil
residual N substantially. The highest simulated 4. Discussion yield was 9.9 t ha−1. Without any N-fertiliser
application, the yields ranged between 3.8 and 4.1. Performance of the APSIM Nwheat model in 5.7 t ha−1. The Bouwing, with weather data from the Netherlands
Wageningen showed slightly lower yields in the 0
winter dominant and uniform rainfall regions in in a year with less rainfall, as for instance in 1996, with only 68% of the average rainfall, an above eastern Australia (Meinke et al., 1998) and the
Mediterranean climate of Western Australia average yield was observed and also simulated. In such a dry year, roots grew deeper into the soil (Asseng et al., 1998a,b).
However, Asseng et al. (1998b) and Meinke profile with no physical soil constraints, utilising deeper soil layers and partially groundwater for et al. (1998) have pointed out the poor
perfor-mance of grain protein simulations of the APSIM water uptake. The analysis of other growth condi-tions revealed that the above average yield in 1996 Nwheat model under Australian conditions, in
particular with terminal droughts during grain was due to higher solar radiation during the dry early summer (10%higher radiation during June – filling. In contrast to the Western Australian
simu-lations, predictions of protein content for the July in 1996 than the average for this period at Wageningen) as a result of fewer rain days and Netherlands were good with a RMSD as low as
1.6%, compared to 3.2% in Western Australia below-average temperatures during grainfilling (1.2°C below the Wageningen mean average tem-(Asseng et al., 1998b). These better protein
simula-tions in the Netherlands were mainly due to the perature of 17°C for July).
Similar to the performance of the APSIM absence of water limitations. The performance test
for grain protein in the temperate maritime climate Nwheat model in Western Australia, larger tions occurred in the LAI simulations. These devia-also showed no tendency towards over- or
underprediction as reported for the Mediterranean tions had little effect on the accuracy of biomass and grainfilling simulations (Asseng et al., 1998b), growing conditions (Asseng et al., 1998b),
suggest-ing that the basic model routines for grain protein even though LAI is critical for light interception and photosynthesis in the model at least during after Ritchie et al. (1985) are reasonable, but
requires improvements for dealing with terminal lower LAI (Ritchie et al., 1985). Most overestima-tions occurred in a higher LAI range, where an drought conditions.
A comparison between simulations and long- increase in LAI only marginally affects light inter-ception when the ground is fully covered with a term experiments or historical yield data often
allows an additional assessment of model–season LAI of about 3 (Ritchie et al., 1985). However, some of the overestimations also occurred at a interactions. However, such comparison is not
always valid, in particular when initial conditions lower LAI, early and at the end of the growing season during senescence, when light interception had to be estimated. Initial conditions could have
been very different in some years in reality, and is more critical, but showed no major effects on the performance of other model components. other conditions could have been present which
are not considered by the model, and were not A groundwater table was simulated with the APSIM Nwheat model, but simulated water table recorded with the data (e.g. disease, pest or weeds).
This usually results in higher simulated than depths did not follow measured depths (not shown), because the model is not capable of hand-observed values. Consequently, comparisons of
simulations with such data should be qualitative ling bypass flow through soil cracks or lateral ground water inflow. Preferential pathways for soil and treated with caution for interpretation of
model performance. water movement have been suggested for similar
soils (Lafolie, 1991) and an improved water table In analysing the general seasonal–yield
inter-action and its reproduction with a model, particu- simulation has been shown for some of these soils by using a soil water model with a bypass routine larly of a rare dry season in the Netherlands, the
historical long-term yield data proved to be useful. (Eckersten and Jansson, 1991). However, a simple water balance test indicated water table fluctua-In all the seasons, the absence of severe water
deficits in the Netherlands simulations was due to tions, which were not accounted for by rainfall inputs, suggesting additional lateral ground water a combination of usually evenly distributed
rain-fall, soils with high water holding capacities and inflow, which is impossible to simulate with any of the above models.
Some of the smaller discrepancies between simu- three of the 546 measured soil mineral N data (Groot and Verberne, 1991) could not be ade-lated and observed soil mineral N could be due to
bypass flow (Rijtema and Kroes, 1991), as sug- quately reproduced by the model. These data were also impossible to explain through a simple budget gested by small amounts of mineral N that had
built up in deeper layers, even though hardly any test (De Willigen, 1991). One of these measured data occurred on 2 March 1983 at the Eest, where water as the basic medium for N transport moved
through the soil according to the model. However, 52 kg N ha−1 was measured in the 0–30 cm soil layer, after measurements of 7 kg N ha−1 in this this bypass movement of mineral N had only
marginal effects on the overall accuracy of soil N layer 3 weeks earlier. Since no fertiliser was applied between 9 February and 2 March 1983, no reason-simulations. This confirms results with other
crack-ing clays without a shallow groundwater table, able explanation exists for this steep increase in mineral N over a period of 21 days, when the where bypass flow through soil cracks had little
effect on the accuracy of soil N simulations with average mean temperature was−0.2°C (maximum mean temperature of 5.2°C ). The model simulated the APSIM Nwheat model (Probert et al., 1998).
Others, who had simulated some of the data in this case a rather constant value of about 10 kg N ha−1for February 1983. At another time, sets from the Eest, PAGV or the Bouwing with
different models, reported problems with simulat- no increase in soil mineral N was measured at 13 or 41 days or at any other following measuring ing the sharp decline in soil mineral N after an
increase from a fertiliser application ( Eckersten day after applying 80 kg N ha−1 fertiliser on 16 February 1983 at PAGV, while the model showed and Jansson, 1991; Grant, 1991; Groot and De
Willigen, 1991; Kersebaum and Richter, 1991; an increase in soil mineral N in the top soil layer by the amount of the fertiliser N application, as Lafolie, 1991; Mirschel et al., 1991; Rijtema and
Kroes, 1991; Whitmore et al., 1991) and overesti- expected. Any other fertiliser N applied in February in any of the experiments by Groot and mations of the relatively low observed mineral N
contents later in the season (Bergstrom et al., 1991; Verberne (1991) has been accounted for in soil measurements shortly after application (Groot and Carbon et al., 1991; Eckersten and Jansson, 1991;
Lafolie, 1991; Mirschel et al., 1991). In contrast, Verberne, 1991) and was accordingly simulated with the APSIM Nwheat model.
the APSIM Nwheat model with the SOILN module by Probert et al. (1998) adequately
simu-lated the soil mineral N dynamics. It reproduced 4.2. Simulation experiments
the sharp declines in soil N after fertiliser
applica-tions and the low observed soil mineral N contents The simulation experiment with different rates of N fertiliser showed that N applied at tillering late in the season in each of the simulations for
the Eest, PAGV or the Bouwing. The soil N (DC23) and at the beginning of stem elongation (DC31) increased grain yield and grain protein module in APSIM, SOILN, divides the soil organic
matter into two pools BIOM and HUM. BIOM with little effects on residual soil N, except for one season with little or no rainfall after the fertiliser is a carbon and N pool notionally representing the
more labile, soil microbial biomass and microbial application. N applications at flag leaf stage (DC39) had a small effect on grain yield but products, whilst HUM comprises the rest of the
soil organic matter. The flows between the pools increased grain protein substantially, with a N-fertiliser application of up to 40 kg N ha−1. A are calculated in terms of carbon as a function of
soil water, temperature and C:N ratio. The corre- similar relative effect has been reported by Ellen and Spiertz (1980) with an increase of 7% yield sponding nitrogen flow depends on the C:N ratio
of the receiving pools. NO
3moves according to its (from 5.6 to 6.0 t hacontent (from 8.2 to 8.9−1) and 10%) by applying an addi-% grain protein soil water concentration with the flow of water
and can be lost from the bottom of the profile in tional 40 kg N ha−1at the flag leaf stage and an increase of 11% in yield (from 5.6 to 6.3 t ha−1) drainage water (Probert et al., 1998).
10.4%) by applying an additional 80 kg N ha−1. Netherlands showed slightly better growing condi-tions for wheat near the coastal region at Note that relative effects are compared here
because of the very different N application Swifterbant than more inland at Wageningen due to slightly more favourable climatic growing condi-amounts previous to the flag leaf stage N
applica-tion (40 kg N ha−1in early April in the Ellen and tions (higher radiation and lower temperatures), but were otherwise very similar. An average yield
Spiertz (1980) experiment, but up to
140 kg N ha−1 in February and 90 kg N ha−1 for both locations of 4.3 t ha−1 was simulated without any fertiliser N application by utilising during tillering and the beginning of stem
elonga-tion in the simulaelonga-tion). Simulated yield and grain mineral N left after the previous crop (initial soil N in the model ), N from mineralisation of crop protein contents for the same or similar locations
were in the range of observed data with yields of residues and soil organic material, and about 35–50 kg N ha−1year−1 continuous wet and dry 6.4–8.2 t ha−1 (Spiertz and Ellen, 1978),
4.0–8.1 t ha−1 (Spiertz and Van de Haar, 1978), deposition of N in the Netherlands (Neeteson and Hassink, 1997).
4.2–6.4 t ha−1 ( Ellen and Spiertz, 1980),
4.5–8.3 t ha−1 (Groot and Verberne, 1991), and The N treatment with up to 140 kg N ha−1 fertiliser in February, a total of 90 kg N ha−1 at 5.6–9.4 t ha−1(Darwinkel, 1998) and grain protein
contents of 9.7–12.5% (Spiertz and Ellen, 1978), tillering and beginning of stem elongation plus 40 kg N ha−1 at flag leaf stage was the most eco-8.1–9.9% (Spiertz and Van de Haar, 1978), 7.4–
10.9%( Ellen and Spiertz, 1980), 7.6–15.6%(Groot nomic treatment, with large effects on increasing grain yield and grain protein and low amounts of and Verberne, 1991), 11.2–13.0% (Darwinkel,
1998). Fischer et al. (1993) reported a grain pro- residual N left in the soil after the harvest. The medians for this treatment were 8.5 t ha−1, 14.0% tein of up to 15% for irrigated wheat in Australia
for yields of up to 9 t ha−1. grain protein and 13 kg N ha−1 soil residual N. The economic and environmental optima in winter
The simulation showed that up to
40 kg N ha−1at DC39 had little effect on residual wheat seem to coincide ( Whitmore and Van Noordwijk, 1995), which has also been demon-N in most of the years, but did increase residual
N substantially in a year with a dry period in June, strated with data from England by Chaney (1990). The optimum N-fertiliser amount and splitting just after the N application. However, such a
season with a dry period around the flag leaf stage regime agree with recent field experimental-based recommendations for N-fertiliser application occurred only once in 14 years. Chaney (1990)
found small non-significant increases in soil nitrate for high-yielding winter wheat crops in the Netherlands (Darwinkel, 1998).
up to an optimum fertiliser rate for yield, but once the optimum was reached, further addition of fertiliser increased only soil nitrate after the wheat
harvest significantly. In the simulation experiment, 5. Conclusions larger N applications of 60 or 80 kg N ha−1
fertiliser increased grain protein only by a From this comprehensive set of model–observa-tion comparisons, it is concluded that the APSIM small amount. However, 80 kg N ha−1 fertiliser
increased residual N substantially in almost every Nwheat model is able to simulate the interactions accurately between a wide range of N-fertiliser year and 60 kg N ha−1 fertiliser increased it at
least once in a year with a dry June. A further application rates and soil N dynamics, crop N uptake, crop growth and phenology, grain yield increase in N-fertiliser applications of up to
220 kg N ha−1in February, 130 kg N ha−1applied and grain protein content under the temperate maritime climate of the Netherlands.
at tillering and at the beginning of stem elongation,
plus 60 kg N ha−1 at the flag leaf stage showed This wheat model can thus be used as a research tool to investigate interactions between the amount minor increases in grain yield and protein, but
yielding winter wheat at recommended nitrogen rates in
results showed that up to 140 kg N ha−1 applied
The Netherlands. Meststoffen 1997/1998, 65–73.
in February, a total of 90 kg N ha−1 applied at
De Willigen, P., 1991. Nitrogen turnover in the soil–crop
tillering stage and at the beginning of stem elonga- system, comparison of fourteen simulation models. Fert. tion can increase the grain yield and grain protein Res. 27, 141–149.
with little effect on soil residual N. An additional Eckersten, H., Jansson, P.E., 1991. Modelling water flow, nitro-gen uptake and production for wheat. Fert. Res. 27,
amount of up to 40 kg N ha−1applied at the flag
313–329.
leaf stage would only slightly increase the grain
Ellen, J., Spiertz, J.H.J., 1980. Effects of rate and timing of
yield, but further increase grain protein, with little nitrogen dressing on grain yield formation of winter wheat effect on soil residual N in most seasons. Larger (T. aestivumL). Fert. Res. 1, 177–190.
amounts of N fertiliser applied at flag leaf stage Fischer, R.A., Howe, G.N., Ibrahim, Z., 1993. Irrigated spring wheat and timing and amount of nitrogen fertilizer I —
would lead to only minor improvements in grain
Grain yield and protein content. Field Crops Res. 33, 37–56.
protein content, but would substantially increase
Grant, R.F., 1991. The distribution of water and nitrogen in
soil residual N.
the soil–crop system: a simulation study with a validation from a winter wheat field trial. Fert. Res. 27, 199–213. Groot, J.J.R., De Willigen, P., 1991. Simulation of the nitrogen
balance in the soil and a winter wheat crop. Fert. Res. 27,
Acknowledgements
261–272.
Groot, J.J.R., Verberne, E.L.J., 1991. Response of wheat to
We thank Dr B.A. Keating from APSRU for nitrogen fertilisation a data set to validate simulation models support with the APSIM Nwheat model, Dr K.B. for nitrogen dynamics in a crop and soil. Fert. Res. 27,
349–383.
Zwart for providing unpublished yield data, Drs
Jones, C.A., Kiniry, J.R., 1986. CERES-Maize: A simulation
J.H.J. Spiertz and J. Goudriaan for constructive
model of maize growth and development. Texas A&M
Uni-discussions, Drs J.W. Bowden, J. Braschkat, J.F. versity Press, College Station, TX.
Angus and M. Stapper for useful comments on Keating, B.A., Godwin, D.C., Watiki, J.M., 1991. Optimising the manuscript and the Department of nitrogen inputs in response to climatic risk. In: Muchow, R.C., Bellamy, J.A. (Eds.), Climatic Risk in Crop
Pro-Meteorology of Wageningen Agricultural
duction: Models and Management for the Semiarid Tropics
University for weather data. This study was
sup-and Subtropics. CAB International, Wallingford, UK,
ported by the Grains Research and Development
pp. 329–358.
Corporation and CSIRO Division of Plant Keating, B.A., McCown, R.L., Cresswell, H.P., 1995.
Paddock-Industry. scale models and catchment-scale problems: the role for
APSIM in the Liverpool Plains. In: Binning, P., Bridgman, H., Williams, B. (Eds.), Proc. MODSIM 95 Int. Congress on Modelling and Simulation. The University of Newcastle,
References Newcastle, UK, pp. 158–165.
Kersebaum, K.C., Richter, J., 1991. Modelling nitrogen dynamics in a plant–soil system with a simple model for Asseng, S., Fillery, I.R.P., Anderson, G.C., Dolling, P.J.,
advisory purposes. Fert. Res. 27, 273–281. Dunin, F.X., Keating, B.A., 1998a. Use of the APSIM
Lafolie, F., 1991. Modelling water flow, nitrogen transport and wheat model to predict yield, drainage, and NO
3leaching root uptake including physical non-equilibrium and optimi-for a deep sand. Aust. J. Agric. Res. 49, 363–377.
zation of the root water potential. Fert. Res. 27, 215–231. Asseng, S., Keating, B.A., Gregory, P.J., Fillery, I.P.R.,
Littleboy, M., Silburn, D.M., Freebairn, D.M., Woodruff, Bowden, J.W., Turner, N.C., Palta, J.A., Abrecht, D.G.,
D.R., Hammer, G.L., Leslie, J.K., 1992. Impact of soil ero-1998b. Performance of the APSIM wheat model in Western
sion on production in cropping systems I. — Development Australia. Field Crops Res. 57, 163–179.
and validation of a simulation model. Aust. J. Soil Res. Bergstrom, L., Johnsson, H., Tortensson, G., 1991. Simulation
30, 757–774. of soil nitrogen dynamics using the SOILN model. Fert.
McCown, R.L., Hammer, G.L., Hargreaves, J.N.G., Holzw-Res. 27, 181–188.
orth, D.P., Freebairn, D.M., 1996. APSIM: a novel software Cabon, F., Girad, G., Ledoux, E., 1991. Modelling of the
nitro-system for model development model testing and simulation gen cycle in farm land areas. Fert. Res. 27, 161–169.
in agricultural systems research. Agric. Syst. 50, 255–271. Chaney, K., 1990. Effect of nitrogen fertiliser rate on soil nitrate
Meinke, H., Hammer, G.L., Chapman, S.C., 1993. A sunflower nitrogen content after harvesting winter wheat. J. Agric. Sci.
simulation model: II Simulating production risks in a vari-114, 171–176.
Meinke, H., Rabbinge, R., Hammer, G.L., Van Keulen, H., tivars of different growth cycle length. Field Crops Res. 38, 125–133.
Jamieson, P.D., 1998. Improving wheat simulation
capabili-ties in Australia from a cropping systems perspective. II. Savin, R., Satorre, E.H., Hall, A.J., Slafer, G.A., 1995. Assess-ing strategies for wheat croppAssess-ing in the monsoonal climate Testing simulation capabilities of wheat growth. Eur.
J. Agron. 8, 83–99. of the Pampas using the CERES-Wheat simulation model. Field Crops Res. 42, 81–91.
Mirschel, W., Kretschmer, H., Mattha¨us, E., Koitzsch, R.,
1991. Simulation of the effects of nitrogen supply on yield Spiertz, J.H.J., Ellen, J., 1978. Effects of nitrogen on crop devel-opment and grain growth of winter wheat in relation to formation process in winter wheat with the model
TRIT-SIM. Fert. Res. 27, 293–304. assimilation and utilisation of assimilates and nutrients. Neth. J. Agric. Sci. 26, 210–231.
Mitchell, P.L., 1997. Misuse of regression for empirical
valida-tion of models. Agric. Syst. 54, 313–326. Spiertz, J.H.J., Van de Haar, H., 1978. Cultivar and nitrogen effects on grain yield, crop photosynthesis and distribution Monteith, J.L., 1996. The quest for balance in crop modeling.
Agron. J. 88, 695–697. of assimilates in winter wheat. Neth. J. Agric. Sci. 26, 233–249.
Neeteson, J.J., Hassink, J., 1997. Nitrogen budgets of three
experimental and two commercial dairy farms in the Nether- Stapper, M., Harris, H.C., 1989. Assessing the productivity of wheat genotypes in a Mediterranean climate, using a crop-lands. In: Van Ittersum, M.K., Van de Geijn, S.C. (Eds.),
Perspectives for Agronomy — Adapting Ecological Prin- simulation model. Field Crops Res. 20, 129–152.
Thornton, P.K., Saka, A.R., Singh, U., Kumwenda, J.D.T., ciples and Management Resource Use. Elsevier Science,
Amsterdam, pp. 171–178. Brink, J.E., Dent, J.B., 1995. Application of a maize crop simulation model in the central region of Malawi. Exp. O’Leary, G.J., Connor, D.J., 1996. A simulation model of the
wheat crop in response to water and nitrogen supply: II. Agric. 31, 213–226.
Toure´, A., Major, D.J., Lindwall, C.W., 1995. Comparison of Model validation. Agric. Syst. 52, 31–55.
Otter-Nacke, S., Godwin, D.C., Ritchie, J.T., 1986. Testing and five wheat simulation models in southern Alberta. Can. J. Plant Sci. 75, 61–68.
Validating the CERES-Wheat Model in Diverse
Environ-ments. AGRISTARS Yield Model Development. USDA- Van Keulen, H., Seligman, N.G., 1987. Simulation of Water Use, Nitrogen Nutrition and Growth of a Spring Wheat ARS, Temple, TX.
Probert, M.E., Keating, B.A., Thompson, J.P., Parton, W.J., Crop: Simulation Monograph. Pudoc, Wageningen, The Netherlands. 310 pp
1995. Modelling water, nitrogen, and crop yield for a
long-term fallow management experiment. Aust. J. Exp. Agric. Wallach, D., Goffinet, B., 1989. Mean squared error of predic-tion as a criterion for evaluating and comparing system 35, 941–950.
Probert, M.E., Dimes, J.P., Keating, B.A., Dalal, R.C., Strong, models. Ecol. Model. 44, 299–306.
Whitmore, A.P., Coleman, K.W., Bradbury, N.J., Addiscott, W.M., 1998. APSIM’s water and nitrogen modules and
sim-ulation of the dynamics of water and nitrogen in fallow T.M., 1991. Simulation of nitrogen in soil and winter wheat crops: modelling nitrogen turnover through organic matter. systems. Agric. Syst. 56, 1–28.
Rijtema, P.E., Kroes, J.G., 1991. Some results of nitrogen simu- Fert. Res. 27, 283–291.
Whitmore, A.P., Van Noordwijk, M., 1995. Bridging the gap lations with the model ANIMO. Fert. Res. 27, 189–198.
Ritchie, J.T., Godwin, D.C., Otter, S., 1985. CERES-Wheat: A between environmentally acceptable and agronomically desirable nutrient supply. In: Glen, D.M., Greaves, M.P., User-oriented Wheat Yield Model. Preliminary
Documenta-tion: AGRISTARS Publication No. YM-U3-04442-JSC- Anderson, H.M. (Eds.), Ecology and Integrated Farming Systems. Wiley, Chichester, UK, pp. 272–288.
18892. Michigan State University, MI.