CHAPTER III
RESEARCH METHODOLOGY
A. The Method of Study
Research is a careful inquiry or examination to discover new information or relationship and to expand and to verify existing knowledge (Francis Rummel in Verma, 2004: 2). The method of research which was use in this thesis was experimental research. Experimental research is a research which aims to know whether there is any effect from something given to the subject of research or not (Arikunto, 2010: 9). In other words, experiment tries to look for the causal relationship by comparing one or more group which is given any treatments.
Based on Suwartono (2007: 58), there are 3 kinds of experimental methods, they are as follows:
1. Pre- Experimental design 2. Quasi- Experimental design 3. True Experimental design
used non-equivalent design since it was done based on the consideration as follows:
1. There were two groups or classes namely experimental class and control class is which each group would be given pre-test and post-test.
2. Before the experiment was done, the first conditions of the two classes were ignored because in the field condition is imposible to serve equivalent group.
3. The control class would be taught with conventional method, while the experimental class would be given Circle game as the treatment.
The purpose of this research was to find out the effectiveness of circle game for seventh grade students in junior high school in teaching English vocabulary. The design of the research as follows:
Experimental class = O1 X O2 Control class = O3 X O4 Where:
O1 = Pre-test of experiment class O3 = Pre-test of control class O2 = Post-test of experiment class O4 = Post-test of control class X = Treatment
B. The Subject of the Study
This research was conducted to the Seventh Grade Students of SMP Negeri 4 Purbalingga in Academic Year 2012/2013. The total students‟ of the Seventh Grade of SMP Negeri 4 Purbalingga in Academic Year 2012/2013 was 240 students. There were eight classes in SMP Negeri 4 Purbalingga. Each class consists of 30 students.
In this research, it was decided to take two classes as the sample. Those classes were VII G class as the control class and VII H class as the experiment class. Each class consists of 30 students.
The reason of choosing those two classes was based on the consideration that before the experiment was done, the first conditions of the two classes were ignored because in the field condition is imposible to serve equivalent group and two classes is close-set.
C. The Place and Time of Study
1. The Place of Study
The research was held on SMP Negeri 4 Purbalingga in Academic Year 2012/2013.
2. The Time of Study
D. The Technique of Data Collection
Technique for collecting data is the way that can be used by the researcher to collect the data (Arikunto, 2010: 192). The data of the research were collected from test and questionnaire. Below are the descriptions:
1. Test
Data from this research will be collected through test. The test is used to measure the vocabulary mastery. According to Arikunto (2010: 193), test is question, exercise or other tools, which are used to measure skill, knowledge, or talent owned by individual or group. The test type is multiple choices and gap filling. In this research, it would be used two kinds of tests namely:
a. Pre-Test
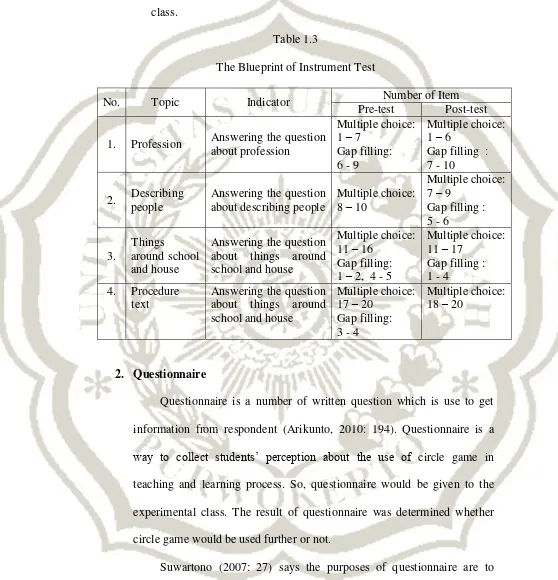
Pre-test is used to know the vocabulary mastery of each group before treatment is given. Pre-test was given for both experimental class and control class. The instrument that was used in pre-test is multiple choices and gap filling. The numbers of pre-test that would be given are 20 items of multiple choice and 10 items of gap filling. b. Post-Test
gap filling.Post-test was given for both experimental class and control class.
Table 1.3
The Blueprint of Instrument Test
No. Topic Indicator Number of Item
Pre-test Post-test 1. Profession Answering the question
about profession information from respondent (Arikunto, 2010: 194). Questionnaire is a way to collect students‟ perception about the use of circle game in teaching and learning process. So, questionnaire would be given to the experimental class. The result of questionnaire was determined whether circle game would be used further or not.
questionnaire able to give explanation about identity, for example sex, age, education, job, salary, etc. As a measure, information is taken able to present in form of percentage by scoring the questionnaire using certain valid system.
The score was converted into percentage to explain the rank of some condition. In this case, writer would be used closed questionnaire. To analyze it, the data must be reduced by using tally. Reducing is a process of simplify the data through grouping the answer for each statement. It has fourth options as follows:
SS (Sangat Setuju) = 4
S (Setuju) = 3
TS (Tidak Setuju) = 2 STS (Sangat Tidak Setuju) = 1
The result of reducing would be converted into percentage using the formula as follow:
The total score of each questionnaire was counted by summing up the score of each statement. After that, the data must be presented using frequency of the criteria of score. The criteria of score are as follows: 81 – 100% = very good
0 – 20% = very bad
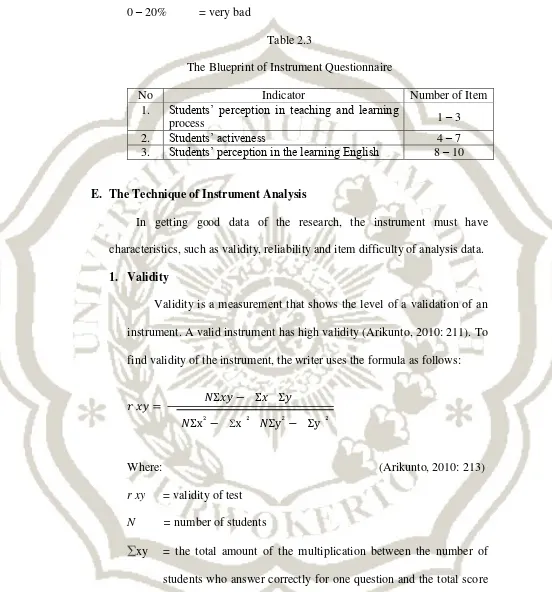
Table 2.3
The Blueprint of Instrument Questionnaire
No Indicator Number of Item
1. Students‟ perception in teaching and learning
process 1 – 3
2. Students‟ activeness 4 – 7
3. Students‟ perception in the learning English 8 – 10
E. The Technique of Instrument Analysis
In getting good data of the research, the instrument must have characteristics, such as validity, reliability and item difficulty of analysis data.
1. Validity
Validity is a measurement that shows the level of a validation of an instrument. A valid instrument has high validity (Arikunto, 2010: 211). To find validity of the instrument, the writer uses the formula as follows:
Where: (Arikunto, 2010: 213)
r xy = validity of test
N = number of students
x = the number of the students who answer correctly for one question.
y = the total number of correct answer of students x = the sum of square of distribution x
y² = the sum of squared score in distribution y (the multiplication between the score of the students and the total score of the students)
Then, the result is classified into the validity grade of test items as follows: Criterion:
0.81 rxy ≤ 1.00 = very high 0.61 rxy ≤ 0.80 = fair 0.21 rxy ≤ 0.40 = low 0.00 rxy ≤ 0.20 = very low
rxy ≤ 0.00 = not valid
2. Reliability
Reliability is an important characteristic of a good test, if the test is administrated or given to the same student in different occasion and the result is consistent, it shows that the test or instrument is reliable.
The formula of reliability is:
r 11 = reliability k = the total items Vt = total variant
p = proportion of subject who answer the question with the correct item (the proportion of subject who have a score 1)
q = proportion of subject who gets score of 0 (q = 1p)
pq : the sum of multiplication between the population of the students who answered correctly and the proportion of the students who had wrong answer
(Arikunto, 2010: 231)
This research was used some steps as follows: a. Determining the total variant (Vt)
The formula of total variant as follows:
Where:
Vt = the variant of total score
y = the sum of students‟ total score
y² = the sum square of students‟ total score N = number of students
According to Arikunto, the criterion of instrument‟s reliability can be
classified as follow:
0.20 ≤ r11 ≤ 0.40 : low
0.40 ≤ r11 ≤ 0.60 : enough
0.60 ≤ r11 ≤ 0.80 : high
0.80 ≤ r11 ≤ 1.00 : highest
b. Calculating pq
In calculating pq here some steps: 1. Determining p
2. Determining q q = 1 – p
3. Multiplying between p and q
c. Entering formula
After finding pq, vt and k then enter it to formula. After knowing the result then writer consults to the r table. If the r counted is higher than the r table, it means that the test is reliable.
3. Item Difficulty
Where:
FV = the index of difficulty
F = the number of correct answer
N = the number of students taking the best
Arikunto (2010: 239) notes that an item is said to be too difficult if the index of difficulty is less than 0.30 and it is said too easy of index of difficulty more than 0.70 it is supported by difficulty of test:
0.00 – 0.30 = difficult 0.30 – 0.70 = medium 0.71 – 1.00 = easy
F. The Technique of Data Analysis
After collecting the data, the writer would be analyzed the data. The steps of data analysis are:
1. The percentage scores of the individual work in the vocabulary
mastery.
a. Determining the individual vocabulary mastery, the formula is as follows:
Where:
(Arikunto 2010: 269)
After knowing the percentage of individual score, the result was classified into five categories:
81 – 100% of the answer are correct = very good 61 – 80% of the answer are correct = good 41 – 60% of the answer are correct = fair 21 – 40% of the answer are correct = bad 0 – 20% of the answer are correct = very bad
b. Mean
Mean is used to find the average of the data distribution. This research used the formula as follows:
Experimental group Control group
(Arikunto 2010: 356)
Where:
Mx = mean of score to the experimental class My = mean of score to the control class
c. The sum of square deviation each group. This research used the formula as follows Experimental group
Control group
(Arikunto 2010: 355)
Where:
x² = square deviation of experimental group y² = square deviation of control group x = residual score of experimental group y = residual score of control group
N = respondent
2. T-test Computation
a. This research used the t-test formula as follows:
(Arikunto 2010: 354)
Where:
Mx = the mean of experiment class My = the mean of control class
y²= the square deviation of control class
Nx = the total number of students of experimental class Ny = the total number of students of control class
b. Finding degree of freedom (d.f) as follows: d.f = (Nx Ny – 2)