Kota Kendari dalam Angka / Kendari City in Figures 2012
173
BAB VI
INDUSTRI PENGOLAHAN
DAN ENERGI
Pada bab ini disajikan data
dan ulasan secara ringkas tentang
hasil kegiatan pembangunan di
sektor industri pengolahan, listrik,
dan penyediaan air minum di Kota
Kendari.
6.1 Industri Pengolahan
6.1.1 Perusahaan
dan
tenaga kerja industri
Pengumpulan data industri
besar sedang dilakukan melalui
Survei Industri Besar dan Sedang
dilaksanakan setiap tahun secara
lengkap. Survei ini mencakup
semua perusahaan indiustri yang
mempunyai tenaga kerja 20 orang
atau lebih. Klasifikasi industri yang
digunakan
dalam
survei
ini
berdasar kepada Klasifikasi Baku
Lapangan Usaha Indonesia (KBLI).
Industri pengolahan adalah
kegiatan ekonomi yang melakukan
kegiatan mengubah suatu barang
dasar secara mekanis, kimia, atau
dengan tangan sehingga menjadi
barang jadi/setengah jadi, dan atau
barang
yang
kurang
nilainya
menjadi barang yang lebih tinggi
nilainya, dan sifatnya lebih dekat
kepada pemakai akhir. Termasuk
dalam kegiatan ini adalah jasa
industri dan pekerjaan perakitan .
CHAPTER VI
MANUFACTURING INDUSTRY
AND ENERGY
This
chapter
presents
an
overview of Kendari City about the
result of development implementation
in
manufacturing
industry,
Electricity, and water supply in
Kendari City.
6.1 Manufacturing Industry
6.1.1 Manufacturing
establishment and labor
Data collection of large and
medium
scale
manufacturing
is
conducted through The Large and
Medium
Manufacturing
Establishment Survey that has been
done annually. Large and Medium
Manufacturing Establishment Survey
covers all manufactures/industries
with 20 worker or more.
Manufacturing
industry
is
defined as an economic activity
processing basic goods mechanically,
chemicals or manually into final or
intermediate goods. It is also defined
as processing of lower value goods
into higher value goods as final or
intermediate products. The activities
also
include
services
for
manufacturing
and
assembling.
174
Kota Kendari dalam Angka / Kendari City in Figures 2012Perusahaan
atau
usaha
industri
adalah
suatu
unit
(kesatuan) usaha yang melakukan
kegiatan
ekonomi,
bertujuan
menghasilkan barang atau jasa,
terletak pada suatu bangunan atau
lokasi tertentu, dan mempunyai
catatan
administrasi
tersendiri
mengenai produksi dan struktur
biaya serta ada seorang atau lebih
yang bertanggung jawab atas usaha
tersebut.
Industri
pengolahan
dikelompokkan
ke
dalam
4
golongan berdasarkan banyaknya
pekerja, yaitu: Industri besar (100
orang pekerja atau lebih), Industri
sedang/menengah (20-99 pekerja),
Industri kecil (5-19 orang/pekerja),
dan industri mikro (1-4 orang
pekerja).
Pengeluaran untuk tenaga
kerja merupakan imbalan atau
jasa-jasa yang telah dikorbankan oleh
pekerja untuk pihak lain yang
meliputi upah/gaji, upah lembur,
hadiah, bonus dan sejenisnya, iuran
dana pension, tunjangan sosial,
tunjangan kecelakaan dan lainnya.
Dari hasil Survei Industri
menunjukkan
bahwa
jumlah
perusahaan industri besar/sedang di
Kota Kendari tahun
2011 adalah
26
perusahaan
dan
menyerap
tenaga kerja sebanyak 1.575 orang.
Menurut status pekerjaan mereka,
terdapat sebanyak 1.155 orang atau
A manufacturing establishment
is defined as a production unit
engaged
in
economic
activity,
producing goods or services, located
in a building or in a building or in a
certain location, keeping a bussines
record concerning the production and
cost structure, and having a person or
more that are responsible to those
activities.
Manufacturing industries are
categorized into four groups, based
on the number of employees: Large
scale manufacturing (100 employees
or
more),
Medium
scale
manufacturing (20-99 employees),
Small scale manufacturing (5-19
employees), and Micro Industry (1-4
employees).
Labor cost is defined as
compensation for workers in the form
of money and goods. Labor cost
covers wage and salary, overtimepay,
bonus in cash and goods, pension
funds, social allowance, accident
allowance e.t.c.
From
the
Industry
Survey
results show that the number of large/
medium
industry
enterprises
in
Kendari in the
year 2011 was 26
companies and absorb 1,575 labors.
According to their employment status,
there are 1,155 labors or 73.33
percent as production workers and
Kota Kendari dalam Angka / Kendari City in Figures 2012
175
73,33 persen adalah tenaga kerja
produksi dan sebanyak 420 orang
atau 26,67 persen adalah tenaga
kerja lainnya.
6.1.2 Investasi
dan
nilai
produksi
Barang
yang
dihasilkan
adalah barang yang dihasilkan
dalam proses produksi. Dalam
menghasilkan barang, diperlukan
modal tetap. Modal tetap adalah
modal kerja yang dapat digunakan
lebih dari satu tahun.
Melalui kegiatan perusahaan
diharapkan dapat diperoleh nilai
tambah.
Nilai
tambah
adalah
besarnya output dikurangi besarnya
nilai input (antara). Input atau
biaya antara adalah biaya yang
dikeluarkan dalam proses industri
yang berupa bahan baku/bahan
penolong,
jasa
industri,
sewa
gedung, dan biasa jasa non industri.
Sedangkan output merupakan nilai
keluaran yang dihasilkan dari
proses kegiatan industri yang
berupa barang yang dihasilkan,
tenaga listrik yang dijual, jasa
industri, keuntungan jual beli,
pertambahan barang stok setengah
jadi dan penerimaan lain.
Nilai
output
dan
input
perusahaan industri besar/sedang
tahun 2010 sebesar Rp.155,39
miliar sedangkan biaya inputnya
sebesar Rp. 70,46 miliar.
420 people or 26.67 percent were
other labor.
6.1.2
Investment
and
value
production
Outcome product is goods
related in the production process. In
producing goods need fixed asset.
Fixed asset is working capital that
can be used for more than one year.
By the establishment activity, it
is expected to get value added. Value
added is defined as substraction from
output to input. Input or intermediate
cost is defined as cost of raw
materials and supporting materials,
fuel, other materials, Electricity,
industrial services, building rent, and
nonindustrial services, etc While
output is defined as total value of all
process
good
which
include
production,
Electricity
sold,
industrial services, profits, change in
stocks and other incomes.
The output value and input of
large/medium industry enterprises in
the year 2010 amounted to Rp.155.39
billion while the input costs were Rp.
70.46 billion.
176
Kota Kendari dalam Angka / Kendari City in Figures 20126.2 Energi
6.2.1 Listrik
Perusahaan Listrik Negara
(PLN) adalah Perusahaan Umum
Milik Negara yang mempunyai
aktivitas kegiatan pembangkitan,
transmisi, dan distribusi tenaga
listrik. Dalam proses distribusi
listrik, PLN menjual listrik kepada
rumah tangga maupun unit usaha.
Jumlah
listrik
terjual
adalah
banyaknya listrik yang disalurkan
kepada para pelanggan.
Dengan
sejumlah
input
diharapkan
PLN
mampu
menghasilkan
listrik
yang
mencukupi
serta
dapat
pula
memberikan nilai tambah bagi
perusahaan. Biaya input merupakan
pengeluaran yang digunakan untuk
pembelian
bahan
bakar
dan
pelumas tenaga listrik yang dibeli,
alat-alat tulis, onderdil, ongkos
pemeliharaan dan perbaikan kecil
alat produksi, sewa gedung, dan
mesin
serta
jasa
lainnya.
Sedangkan nilai output merupakan
nilai tenaga listrik yang dijual atau
didistribusikan
kepada
para
pelanggan dan ditambah dengan
pendapatan atau penerimaan dari
kegiatan jasa perusahaan.
Jumlah pelanggan listrik
PLN di Kota Kendari tahun 2011`
tercatat sebanyak 50 875 pelanggan
atau
meningkat
17,16
persen
dibandingkan tahun sebelumnya.
6.2 Energy
6.2.1 Electricity
State Electricity Company
(PLN) is a State owned company that
has
activities
for
Electricity
production,
transmission
and
Electricity distribution. In distribution
processing, PLN sell Electricity to
household
customer
and
also
establishment units. Sold Electricity
is total Electricity distributed to
customer.
With a number of input, PLN is
expected can yield fullfilling electrics
and also gives value added to
company.
Input
values
include
expenditures for fuel and lubricant,
Electricity consumed maintenance,
stationaries, spareparts, maintenance
costs of machineries and vehicles,
building and machineries rental costs,
and costs of other services. While
output
cover
Electricity
and
distributed to customers added by
income from other services.
Number of electricity customers
in Kendari in 2011 were 50,875
subscribers, or 17.16 percent over
the
previous
year.
While
sold
electricity value increased 16,20
Kota Kendari dalam Angka / Kendari City in Figures 2012
177
Sedangkan tenaga listrik yang
terjual nilai penjualannya
masing-masing meningkat 16,20 persen
dan 13,45 persen dibandingkan
tahun sebelumnya. Jenis pelanggan
listrik didominasi oleh rumah
tangga (64,02 %). Dengan kata lain
pelanggan
rumah
tangga
memberikan kontribusi terhadap
penggunaan listrik di Kota Kendari
lebih besar dibandingkan tahun
sebelumnya yang mencapai 50,78
persen.
6.2.2 Air
Perusahaan Air Bersih adalah
perusahaan
yang
mempunyai
aktivitas
dalam
penampungan,
penjernihan, dan penyaluran air
baku atau air bersih dari terminal air
melalui saluran air, pipa atau mobil
tangki (dalam satu pengelolaan
administrasi
dengan
kegiatan
ekonomi) kepada rumah tangga,
perusahaan industri, atau pengguna
komersial lainnya.
Konsep jumlah air bersih
terjual, biaya input, maupun nilai
output air bersih sama dengan
konsep pada listrik yang dipaparkan
sebelumnya.
Pada tahun 2011, Perusahaan
Daerah Air Minum (PDAM) Kota
Kendari menyerap tenaga kerja
sebanyak
245
orang
atau
meningkat sebesar 7,93 persen
dibandingkan tahun sebelumnya,
yang terdiri dari 195 laki-laki dan
percent and 13,35 percent over the
previous year. Type of electricity
customers
are
dominated
by
households (64,02%). In other words,
household customers contributed to
the electricity utilization in Kendari
City is smaller than the previous year
which reached 50,78 percent.
6.2.2 Water
The water supply company
(PDAM) is a company with several
ativities such as the collection and
purification
of
water
and
the
distribution of water to households,
industries, and other commercial
users.
The concept of number of sold
clean water, input value, and also
clean water output value is equal to
concept at Electricity which has been
explained before.
In 2011, the Regional Water
Supply Company (PDAM) of Kendari,
employing as many as 245 people or
increasing 7,93 percent over the
previous year, which consisted of
195 men and 48 women. The volume
of water delivered during the year
178
Kota Kendari dalam Angka / Kendari City in Figures 201250 orang perempuan. Volume air
yang disalurkan selama tahun 2011
sebanyak
3.564.575
m³
atau
meningkat
5,37
persen
dibandingkan tahun sebelumnya,
dengan nilai penjualan sebesar
14,13 milyar rupiah.
2011 as many as 3.564.575 m³ or
5,37 percent decline from previous
year, with sales reached 14.13 billion
rupiahs.
Kota Kendari dalam Angka / Kendari City in Figures 2012
179
Gambar
Figure
6.1.1
Banyaknya Tenaga Kerja menurut Jenisnya di Kota
Kendari, 2006 - 2010
Number of Labors by Type of Labors in Kendari City,
2006 - 2010
[Diolah dari hasil Survey Tahunan Perusahaan Industri Besar/Sedang 2011, BPS / Based on The
180
Kota Kendari dalam Angka / Kendari City in Figures 2012Gambar
Figure
6.2.1
Produksi Listrik dan Tenaga Listrik yang Terjual di
Kota Kendari, 2006 - 2010
Electricity Produced and Electricity Sold in Kendari
City, 2006 - 2010
Sumber/Source : PT. PLN (Persero) Wilayah Sulsel dan Sultra Cabang Kendari
Kota Kendari dalam Angka / Kendari City in Figures 2012
181
Gambar
Figure
6.2.2
Volume Air Minum yang Disalurkan menurut
Kategori Pelanggan di Kota Kendari (m
3), 2008 – 2010
Volume of Water Supply Distributed by Kind of
Customers in Kendari City (m3), 2008 -2010
Sumber/Source: Perusahaan Daerah Air Minum Kota Kendari
182
Kota Kendari dalam Angka / Kendari City in Figures 20126.1 Industri Pengolahan/ Manufacturing Industry
Tabel
Table
6.1.1
Banyaknya Perusahaan Industri Besar/Sedang,
Tenaga Kerja dan Pengeluaran untuk Tenaga Kerja
menurut Kecamatan di Kota Kendari, 2011
Number of Establishments, Labors and Total Wages of
Large and Medium Scale Industry by Districts in
Kendari City, 2011
[Diolah dari hasil Survey Tahunan Perusahaan Industri Besar/Sedang 2011, BPS / Based on The
Annual Large and Medium Manufacturing Establishment Survey 2011, BPS ]
Kecamatan Districts Banyaknya Perusahaan Number of Establishments Tenaga Kerja Labors Pengeluaran Untuk Tenaga Kerja (000 Rp.) Total Wages (000 Rupiahs) (1) (2) (3) (4) 1. Mandonga
3
180
4 268 288
2. Baruga-
-
-
3. Puuwatu2
84
1 185 290
4. Kadia-
-
-
5. Wua-wua2
51
510 400
6. P
oasia1
33
428 200
7. Abeli11
734
6 781 884
8. Kambu-
-
-
9. Kendari3
100
1 57 888
6. Kendari Barat4
141
1 608 288
Jumlah/Total 2 0 1 1 26 1 323 16 358 238 2 0 1 0 24 1 575 21 117 846 2 0 0 9 23 1.533 16 438 346 2 0 0 8 25 1.697 23 817 783 2 0 0 7 23 1.612 17 865,075Kota Kendari dalam Angka / Kendari City in Figures 2012
183
Tabel
Table
6.1.2
Banyaknya Perusahaan Industri Besar/Sedang, Tenaga
Kerja dan Pengeluaran untuk Tenaga Kerja menurut
Golongan Industri di Kota Kendari, 2011
Number of Establishments, Labors and Total Wages of
Large and Medium Scale Manufacturing Industry by
Industry Code in Kendari City, 2011
[Diolah dari hasil Survey Tahunan Perusahaan Industri Besar/Sedang 2011, BPS / Based on The
Annual Large and Medium Manufacturing Establishment Survey 2011, BPS ]
Banyaknya Perusahaan
Tenaga Kerja Pengeluaran
Kode Industri Labors Jumlah Tenaga Untuk
Industry Code Number of Produksi Lainnya Total Kerja
Establishment Production Others Total Wages
(000 Rp) (1) (2) (3) (4) (5) (6) 15 20 22 35 17 2 5 2 688 104 135 20 192 57 146 2 1 107 161 281 22 12 807 811 1 461 949 5 701 090 1 146 996 Jumlah/Total 2 0 1 0 26 947 420 1 575 16 358 238 2 0 0 9 24 1 155 420 1 575 21 117 846 2 0 0 9 23 1 126 407 1 533 16 438 346 2 0 0 8 25 1 293 404 1 697 23 817 783 2 0 0 7 23 1 193 419 1 612 17 865 075
184
Kota Kendari dalam Angka / Kendari City in Figures 2012Tabel
Table
6.1.3
Nilai Output Industri Besar/Sedang menurut
Golongan Industri di Kota Kendari (ribu rupiah), 2011
Gross Output Value of Large and Medium Scale
Manufacturing Industry by Industry Code in Kendari
City (thousand rupiahs), 2011
[Diolah dari hasil Survey Tahunan Perusahaan Industri Besar/Sedang 2011, BPS / Based on The
Annual Large and Medium Manufacturing Establishment Survey 2011, BPS]
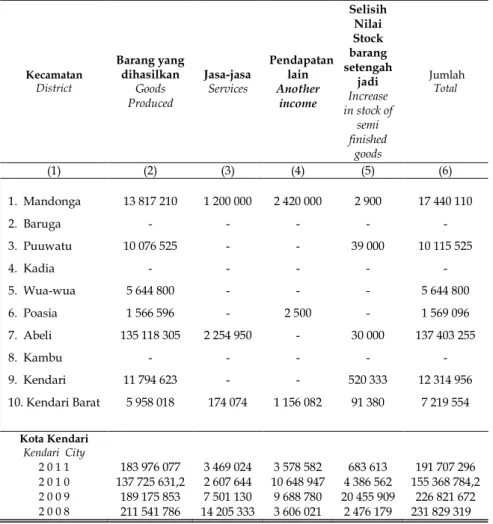
Kecamatan District Barang yang dihasilkan Goods Produced Jasa-jasa Services Pendapatan lain Another income Selisih Nilai Stock barang setengah jadi Increase in stock of semi finished goods Jumlah Total (1) (2) (3) (4) (5) (6) 1. Mandonga 13 817 210 1 200 000 2 420 000 2 900 17 440 110 2. Baruga - - - - - 3. Puuwatu 10 076 525 - - 39 000 10 115 525 4. Kadia - - - - - 5. Wua-wua 5 644 800 - - - 5 644 800 6. Poasia 1 566 596 - 2 500 - 1 569 096 7. Abeli 135 118 305 2 254 950 - 30 000 137 403 255 8. Kambu - - - - - 9. Kendari 11 794 623 - - 520 333 12 314 956 10. Kendari Barat 5 958 018 174 074 1 156 082 91 380 7 219 554 Kota Kendari Kendari City 2 0 1 1 183 976 077 3 469 024 3 578 582 683 613 191 707 296 2 0 1 0 137 725 631,2 2 607 644 10 648 947 4 386 562 155 368 784,2 2 0 0 9 189 175 853 7 501 130 9 688 780 20 455 909 226 821 672 2 0 0 8 211 541 786 14 205 333 3 606 021 2 476 179 231 829 319
Kota Kendari dalam Angka / Kendari City in Figures 2012
185
[Diolah dari hasil Survey Tahunan Perusahaan Industri Besar/Sedang 2011, BPS / Based on TheAnnual Large and Medium Manufacturing Establishment Survey 2011, BPS]
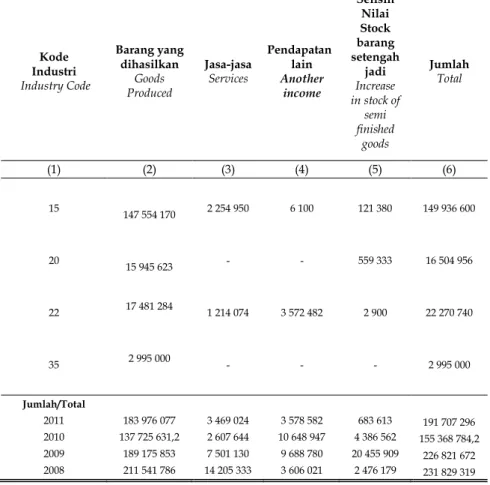
Kode Industri Industry Code Barang yang dihasilkan Goods Produced Jasa-jasa Services Pendapatan lain Another income Selisih Nilai Stock barang setengah jadi Increase in stock of semi finished goods Jumlah Total (1) (2) (3) (4) (5) (6) 15 20 22 35 147 554 170 15 945 623 17 481 284 2 995 000 2 254 950 - 1 214 074 - 6 100 - 3 572 482 - 121 380 559 333 2 900 - 149 936 600 16 504 956 22 270 740 2 995 000 Jumlah/Total 2011 183 976 077 3 469 024 3 578 582 683 613 191 707 296 2010 137 725 631,2 2 607 644 10 648 947 4 386 562 155 368 784,2 2009 189 175 853 7 501 130 9 688 780 20 455 909 226 821 672 2008 211 541 786 14 205 333 3 606 021 2 476 179 231 829 319
Tabel
Table
6.1.4
Nilai Output Industri Besar/Sedang menurut
Golongan Industri di Kota Kendari (ribu rupiah), 2011
Gross Output Value of Large and Medium Scale
Manufacturing Industry by Industry Code in Kendari
City (thousand rupiahs), 2011
186
Kota Kendari dalam Angka / Kendari City in Figures 2012 [Diolah dari hasil Survey Tahunan Perusahaan Industri Besar/Sedang 2011, BPS / Based on TheAnnual Large and Medium Manufacturing Establishment Survey 2011, BPS]
Kecamatan District Nilai Ouput Gross Output Value Biaya Input Input Costs Nilai Tambah Harga Pasar Value Added at Current Market Prices Pajak Tak Langsung Indirect Taxes Nilai Tambah Biaya Faktor Value Added at Factor Costs (1) (2) (3) (4) (5) (6) 1. Mandonga 17 440 110 4 70 358 12 649 752 554 845 12 315 099 2. Baruga - - - - - 3. Puuwatu 10 11 525 5 191 042 4 924 483 19 982 5 603 724 4. Kadia - - - - - 5. Wua-wua 5 644 800 3 248 874 2 395 926 3 551 2 316 978 6. Poasia 1 569 096 814 376 754 720 10 250 681 444 7. Abeli 137 403 255 3 21 995 9 098 961 68 889 7 095 774 8. Kambu - - - - - 9. Kendari 12 314 956 3 215 995 9 098 961 68 889 7 95 774 10.Kendari Barat 7 219 554 2 873 724 4 345 830 304 521 3 908 297 Kota Kendari Kendari City 2 0 1 1 191 707 296 98 877 743 92 829 553 1 222 766 87 091 884 2 0 1 0 155 368 784 70 457 314 84 911470,2 1 159 373 69 036 982 2 0 0 9 226.821.672 119.420.135 11.175.723 1.112.503 124.552.579 2 0 0 8 231.829.319 135.262.460 96.566.770 1.764.526 94.802.244 2 0 0 7 253.880.799 132.616.077 119.277.772 1.983.872 117.334.876
Tabel
Table
6.1.5
Nilai Output Industri Besar/ Sedang menurut
Golongan Industri di Kota Kendari (ribu rupiah),
2011
Gross Output Value of Large and Medium Scale
Manufacturing Industry by Industry Code in
Kendari City (thousand rupiahs), 2011
Kota Kendari dalam Angka / Kendari City in Figures 2012
187
[[Diolah dari hasil Survey Tahunan Perusahaan Industri Besar/Sedang 2011, BPS / Based on TheAnnual Large and Medium Manufacturing Establishment Survey 2011, BPS]
Kode Industri Industry Code Nilai Ouput Gross Output Value Biaya Input Input Costs Nilai Tambah Pajak Tak Value Added at Indirect Taxes Harga Pasar Langsung Current Market Prices Nilai Tambah Biaya Faktor Value Added at Factor Costs (1) (2) (3) (4) (5) (6) 15 20 22 35 114 623 613,2 13 403 131 22 853 240 4 488 800 54 901 782 7 769 374 6 901 912 884 246 59 721 831 5 633 757 15 951 328 3 604 554 366 775 74 330 470 708 247 560 45 301 514 1 976 367 16 694 239 5 064 862 Kota Kendari Kendari City 2 0 1 0 155 368 784,2 70 457 314 84 911 470 1 159 373 69 036 982 2 0 0 9 226 821 672 119 420 135 111 175 723 1,112,503 124 552 579 2 0 0 8 231 829 319 135 262 460 96 566 770 1 764 526 94 802 244 2 0 0 7 253 880 799 132 616 077 119 277 772 1 983 872 117 334 876 2 0 0 6 741 702 083 135 216 342 606 485 741 578 953 605 906 788
Tabel
Table
6.1.6
Nilai Tambah Industri Besar/Sedang menurut
Golongan Industri di Kota Kendari (ribu rupiah), 2011
Value Added of Large and Medium Scale Manufacturing
Industry by Industry Code in Kendari City (thousand
rupiahs), 2011
188
Kota Kendari dalam Angka / Kendari City in Figures 20126.2. Energi / Energy
Tabel
Table
6.2.1
Banyaknya Pelanggan, Tenaga Listrik yang
Terjual dan Nilai Penjualan menurut
Penggunaan di Kota Kendari, 2011
Number of Customers, Total Electricity Sold and
Its Value by Kind of Customers in Kendari City,
2011
Jenis Penggunaan Kind of Customers Jumlah Pelanggan Number of Customers Tenaga Listrik Yang Terjual Total of Electricity Sold (Kwh) Nilai Penjualan Tenaga listrik Value of Electricity Sold (000 Rp) (1) (2) (3) (4) 1. Produksi/Production 1.1. Industri 59 14 387 855 11 207 176 Manufac. Industry 1.2. Bisnis/Bussines 5.078 44 124 257 45 224 184 2. Penerangan Jalan 122 4 154 296 3 406 497 Road Lighting 3. J a w a t a n 561 9 442 018 10 480 895 Goverment Institution 4. Rumahtangga 44.314 83 611 593 55 388 338 Household 5. S o s i a l/Social 741 4 563 875 3 146 993 6. Umum/Public - 1 227 569 1 748 025 J u m l a h / T o t a l 2 0 1 1 50 875 157 357 167 130 602 109 2 0 1 0 43 423 145 149 229 109 442 397 2 0 0 9 40 380 131 698 312 94 725 523 2 0 0 8 39 885 116 901 832 80 114 881 2 0 0 7 39 636 107 878 271 70 232 927 2 0 0 6 38 108 94 580 472 60 839 504 Sumber/Source : PT. PLN (Persero) Wilayah Sulsel dan Sultra Cabang KendariKota Kendari dalam Angka / Kendari City in Figures 2012
189
Tabel
Table
6.2.2
Daya Terpasang, Produksi Listrik, Tenaga
Listrik yang Terjual, dan Nilai Penjualan
Tenaga Listrik di Kota Kendari, 2007 - 2011
Installed Capacity, Electricity Produced and
Sold, and Value of Electricity Sold in Kendari
City, 2007- 2011
Tahun Year Daya Terpasang Installed Capacities (Kw) Produksi Listrik Electricity Produced (Kwh) Tenaga Listrik Yang Terjual Electricity Sold (Kwh) Nilai Penjualan Tenaga Listrik Value of Electricity Sold (000 Rp) (1) (2) (3) (4) (5) 2 0 1 1 78 450 228 431 343 161 511 463 130 602 109 2 0 1 0 64 232 218 051 473 145 154 484 109 462 398 2 0 0 9 57 679 225 867 728 131 698 312 94 725 523 2 0 0 8 57 679 249 157 931 116 901 832 80 114 881 2 0 0 7 60 694 228 858 776 107 878 271 70 232 927Sumber/Source : PT. PLN (Persero) Wilayah Sulsel dan Sultra Cabang Kendari
190
Kota Kendari dalam Angka / Kendari City in Figures 2012Tabel
Table
6.2.3
Volume Air Minum yang Disalurkan menurut
Kategori Pelanggan di Kota Kendari (m
3), 2009 – 2011
Volume of Water Supply Distributed by Kind of
Customers in Kendari City (m
3), 2009 -2011
Kategori Pelanggan 2 0 0 9 2 0 1 0 2 0 1 1 Kind of Customers (1) (2) (3) (4)
1 Rumah tempat tinggal 3 271 062 2 897 574 3 009 379
Household
2 Badan-badan Sosial 24 773 22 750 22 750 dan Rumah sakit
Social Institution & Hospitals
3 U m u m - - -
P u b l i c
4 Toko, Perusahaan dan 239 329 221 725 247 871 Industri
Shops, Establishments and Industries 5 Instansi Pemerintah 254 967 240 967 283 520 Goverment Institutions 6 Lain-lain Other
Jumlah / Total 3 790 131 3 383 016 3 563 575 Sumber/Source: Perusahaan Daerah Air Minum Kota Kendari
The Water Supply Company of Kendari City
Kota Kendari dalam Angka / Kendari City in Figures 2012
191
Tabel
Table
6.2.4
Nilai Air Minum yang Disalurkan menurut
Kategori Pelanggan di Kota Kendari (ribu
rupiah), 2009 - 2011
Value of Water Supply Distributed by Kind
of Customers in Kendari City (thousand
rupiahs), 2009 - 2011
Kategori Pelanggan 2 0 0 9 2 0 1 0 2 0 1 1 Kind of Customers (1) (2) (3) (4)1 Rumah tempat tinggal 11 783 774 10 593 088 10 944 368
Household
2 Badan-badan Sosial 57 858 53 379 56 267 dan Rumah sakit
Social Institution & Hospitals
3 U m u m - - -
P u b l i c
4 Toko, Perusahaan dan 1 584 307 1 456 006 1 605 213 Industri
Shops, Establishments and Industries 5 Instansi Pemerintah 1 249 037 1 190 902 1 419 592 Goverment Institutions 6 Lain-lain - - - O t h e r s Jumlah / Total 14 674 976 13 293 375 14 025 440 Sumber/Source: Perusahaan Daerah Air Minum Kota Kendari
192
Kota Kendari dalam Angka / Kendari City in Figures 2012Tabel
Table
6.2.5
Banyaknya Tenaga Kerja Perusahaan Daerah
Air Minum di Kota Kendari, 2011
Number Labors of Water Supply Establishment
in Kendari City, 2011
Tenaga Kerja Laki-laki Perempuan Jumlah
Workers Male Female Total
(1) (2) (3) (4) 1 Pekerja Operasional 2011 92 6 98 2010 97 5 102 2 Pekerja Lainnya 2011 103 44 147 2010 82 43 125 Jumlah / Total 2 0 1 1 195 50 245 2 0 1 0 179 48 227 2 0 0 9 142 30 172 2 0 0 8 141 28 169
Sumber/Source: Perusahaan Daerah Air Minum Kota Kendari
The Water Supply Company of Kendari City