INTRODUCTION
In corporate finance literature, one of the most puzzling issues is capital structure theory. As we know from the description of its term, it is implied that the strategy of firm to finance their assets is through combina
-tion of equity, debt, and hybrid securities. By analyzing the factors coming up, the firms can determine what kind of financial poli
-cies issued. For example, a firm that sells twenty billion rupiah in equity and eighty bil
-lion rupiah in debts is said to be 20 % equity financed and 80% debt financed. The firm’s ratio of debt to total financing, for example 80 %, is referred as the firm’s leverage.
Forms of capital structure theory, Mo
-digliani and Miller who were propounded, begun to be the basis of modern thinking on capital structure. Since many important fac
-tors can determine the capital structure de
-cision, still this theorem is generally viewed as a purely theoretical result. For instance in their paper, Modigliani and Miller (1958)
assume that tax holds big proportions in case dealing with optimizing capital struc
-ture, but academicians and professionals consider that this is purely theoretical issue. As leverage increases, the tax advantage of debt eventually will be offset by an in
-creased cost of debt, reflecting the greater likelihood of financial distress. The theorem states that, in a perfect market, how that firm is financed the asset affects the value of the firm. This result becomes the base reasons why capital structure is relevant; the capital structure it employs directly in
-fluences the company’s value.
Debate about a firm’s optimal capi
-tal structure in the scope of corporate fi
-nance concerns keep ongoing. Specifically, is there a way to separate a firm’s capital into debt and equity so as to maximize the value of the firm? From a practical point of view, this question is of utmost importance for corporate financial officers and also ac
-ademicians, as it has been forcefully dem
-CAPITAL STRUCTURE ANALYSIS
IN THE APPLICATION OF FISCAL , TRADE-OFF
AND PECKING ORDER THEORY
NUKMAN TAUFIK
DWIPRAPTONO AGUS HARJITO Fakultas Ekonomi UII Yogyakarta
email:[email protected]
ABSTRAK
Tujuan yang lebih kongkrit dari penelitian ini adalah untuk menguji relevansi dari teori fiskal, te -ori trade-off dan te-ori peking order dalam analisis struktur modal dari perusahaan-perusahaan publik yang ada di Bursa Efek Indonesia. Dengan menguji teori-teori tersebut di atas akan dip -eroleh informasi empiris tentang penerapan teori-teori tersebut di perusahaan-perusahaan In -donesia. Kemudian, penelitian ini juga menginvestigasi apakah faktor-faktor yang menentukan struktur modal perusahaan dapat mempengaruhi struktur hutangya. Untuk mencapai tujuan yang diinginkan, penelitian ini mengumpulkan data dari perusahaan-perusahaan yang terdaftar di Bursa Efek Indonesia dari tahun 2002 hingga tahun 2006. Dari analisis data ditemukan ba -hwa tarif pajak efektif, struktur asset dan ukuran perusahaan menyebabkan adanya pengaruh positif dan signifikan terhadap rasio hutang perusahaan. Variabel lainnya seperti non debt tax-shield dan nilai proftabilitas periode yang lalu membuat efek negative terhadap rasio hutang. Bagi tingkat pertumbuhan perusahaan, penelitian tidak menemukan hubungannya dengan rasio hutang. Dan variabel-variabel bebas dapat mempengaruhi rasio hutang secara simultan dan secara simultan.
onstrated in the survey results by Graham and Harvey (2001) only recently. Whereas through this subject, many parties can use as manual to get deeper analysis about capital structure as one of the components to create firm’s value.
From the Modigliani and Miller per
-spective, forms the basis of modern think
-ing on capital structure, it implies the rel
-evance of the different financing theories for explaining capital structure choice in many corporate. The question is what capital structure need to be determined by company’s management to apply effec
-tively and efficiently. Just look in debt case, debt values (and therefore yield spreads) cannot be determined without knowing the company’s capital structure, which will af
-fect the default potential and bankruptcy. To better observe in reading the problem we can refer to the traditional theory, Modigli
-ani and Miller. According to the M&M theo
-rem, in the absence of taxes, bankruptcy costs, and asymmetric information, and in an efficient (perfect) market, the value of a firm are unaffected by how that firm is fi
-nanced. Conversely, if capital structure is irrelevant in a perfect market, then imper
-fections which exist in the real world must be the cause of its relevance. The theories, for instance: trade-off theory, pecking order theory, try to show some of these imperfec
-tions by relaxing assump-tions made in the M&M model. So that this approaching can then be extended to look at whether there is in fact an ‘optimal’ capital structure. This can enhance the value of the firm.
Therefore financing decisions in several companies can be explained more briefly for the affection. According to this theorem, capital structure significantly af
-fects the firm’s valuation. Trade off theory, for example, the purpose is to explain the fact that firms usually are financed partly with debt and partly with equity. It states that there is an advantage to finance with debt, the Tax Benefit of Debt and there is a cost of financing with debt, the costs of fi
-nancial distress including Bankruptcy Costs of debt and non-Bankruptcy costs. This ar
-gument will be in accordance with Hova
-kimian et al. (2001) opinion. They find that more profitable companies will employ debt rather than equity. This is also consistent
with firm trading of the risks of bankruptcy with tax benefits of debt. On the other hand, this opinion supports the pecking order theory. Another prediction was issued by Sarkar (2000). He said that in his model, he found among a firm’s earnings and optimal leverage ratio occur negative relationship. This assumption is contrary with traditional statement, but the consistency of empirical findings can be kept. We also can find the manual for trade-off theory (also with peck
-ing order theory) in paper provided by Frank and Goyal (2005).
Another theory that simultaneous
-ly support Traditional theory, which states capital structure will effectively influence the level of value of firm, is Pecking Order Theory. In here we get that company’s as
-sets financed by tendency to choose wheth
-er the sources of funds based hi-erarchy of risk (Myers and Majluf, 1984). It states that according to the law of least effort, manage
-ment of companies prioritizes their sources of financing -from internal financing to eq
-uity. Hence, the order of using sources is at the first will internal funds until exhaust
-ing, then debt begin to issue, and when it is not sensible to issue any more debt, equity is issued. This theory maintains that busi
-nesses adhere to a hierarchy of financing sources and prefer internal financing when available, and debt is preferred over equity if external financing is required. Pecking Or
-der Theory is theory that based on the infor
-mation assymetry. Infor-mation assymetry will affect capital structure of certain firm by the agency of limited access to the external sources from outside. The acceptance of this theory is support by Zoppa and McMa
-hon (2002). They found phenomena as be
-low market financial returns often accepted by SME owners and owner-managers, the alleged finance gap faced by SMEs seek
-ing longer-term development capital. This finding is consistent with the pecking or
-der statement. Another acceptance for the study was also issued by Jong, Verbeek, and Verwijmeren (2005). Their finding is consistent with the predictions of a pecking order model that considers firms’ debt ca
In accordance with prior research, Mira (2001), research aim is to get the determinants of debt policy decisions in companies listed in IDX (Indonesia Stock Exchange). The debt policy itself, theoreti
-cally, sets comprehensive guidelines for the financing of capital expenditures. It is the objective of the policy that are: (1) The dis
-trict obtains financing only when advisable. (2) The process for identifying the timing and amount of debt or other financing be efficient. (3) Competitive interest and other costs be obtained, and
Through capital analysis we get some brightening in understanding key issue of firms and developing the debt policy. This understanding will help us to clarify certain firm’s options for debt financing, evaluate tolerance for risk of interest rate changes and engage your board of directors with ownership and understanding of the policy (Pladson, 2005).
In order to examine the relevance of differences in financing decisions, in this case is to explain the firm’s debt policy, and then we need to know what parameters that we use to get brighter understanding. Le
-land (1994) said between debt value and capital structure has interlinked variable. His paper results indicate that unprotected debt values and protected debt values be
-have very much as expected. Unprotected “junk” bonds exhibit quite different behav
-ior. For instance, increasing of debt value is the result of an increase in firm risk, as will a decrease in the coupon. This result implies the content of trade-off theory. It means there is relation between financial structures of certain company and the val
-ue of debt being iss-ued. According to Har
-ris and Raviv (1990) the importance of any of these roles for debt in a capital structure theory do not denied, but the informational and disciplining role can be judged as im
-portant thing and enables users to address issues, such as liquidation vs. reorganiza
-tion that were not addressed in the theories just mentioned. The debt information or pol
-icy stated by any firms will impact the whole activity of the company itself. Liquidation or any further implication will be consequenc
-es whatever financial policy decid-es.
LITERATURE REVIEW
Many hypotheses issued to con
-solidate many thinking in order to get ideal theorem about role of capital (financial) structure to influence firm (business) value. The idea presented by Modigliani and Miller (1958) set up the basis for the development of a theoretical body around the firm capital structure issue. Its main proposition estab
-lishes that the valuation of a company will be independent from its financial structure. As this conclusion is absolutely true un
-der the assumptions Modigliani and Miller (1958) took into account, the enlargement of the theory onwards has been produced relaxing these fundamental assumptions, also with the aim of approximating the the
-ory to the firm reality.
Despite the unrealistic assumptions, MM’s irrelevance result is extremely im
-portant. By indicating the conditions under which capital structure is irrelevant, i.e., by what is usually referred to as the company’s investment policy. The economic substance of the firm is unaffected whether the liability side of the firm’s balance sheet is sliced into more or less debt. To increase the value of the firm, it must invest in additional projects with positive net-present values (Drobetz and Fix, 2003). This perspective provided some clues about what is required for capi
-tal structure to be relevant and hence to af
-fect a firm’s value.
From that theory then issued many arguments/studies that already reviewed about capital structure; from this point we can get thorough about debt policy deci
-sions (example) in companies because the majority of these studies use capital struc
-ture arguments emphasizing the importance of tax shield benefits from debt financing, as the explanation for this phenomenon. To prove the existences of theory, debate about a firm’s optimal capital structure in the scope of corporate finance concerns keep ongoing. Specifically, is there a way to separate a firm’s capital into debt and eq
-uity so as to maximize the value of the firm? From a practical point of view, this ques
Fiscal Theory
Basically Fiscal Theory is theory used by government to determine what kind policy regulated to finance their activities (economic aspect). This theorem reflects in Fiscal policy, taking place within the scope of budgetary policy, refers to government policy that attempts to influence the direc
-tion of the economy through changes in government taxes, or through some ex
-penses (fiscal allowances). The fiscal the
-ory is operating whenever it is possible for fiscal policy to become active. Then a cut in current taxes, financed by sales of nomi
-nal government debt, does not generate an expectation that future taxes will rise by at least enough to service the new debt. The tax reduction leaves households feeling wealthier, at initial prices and interest rates, and they perceive they can raise their con
-sumption paths.
Trade-Off Theory
Research following the MM papers has led to a “trade-off theory of leverage,” in which firm’s trade off benefits of debt fi
-nancing (favorable corporate tax treatment) against higher interest rates and bank
-ruptcy costs. The tradeoff between debt tax shields and bankcruptcy costs has featured prominently in models predicting optimal leverage ratios. However, existing tradeoff models are silent regarding the optimal mixture of bank and market debt, as well as the optimal priority of the two lender class
-es. This silence has been interpreted as evidence against the ability of the tradeoff theory to explain debt structure. Hovakim
-ian et al. (2001) found that more profitable companies will employ debt rather than eq
-uity, also this is consistent with firm trading of the risks of bankruptcy with tax benefits of debt. Leland and Pyle (1977) argue that debt can be valuable as a device for signal
-ing firm value.
Pecking Order Theory
According to the pecking order the
-ory, the firms will prefer for using internal financing. The firms prefers internal to ex
-ternal financing, and debt to equity if the firm issues securities. In the pure pecking order theory, the firms have no well-defined debt-to-value ratio. There is a distinction between internal and external equity. Sev
-eral authors have been given credit for in
-troducing signaling as an argument in the discussion of debt’s explanatory factors. Leland and Pyle (1977) and Myers and Ma
-jluf (1984) are often quoted as the seminal articles in this branch of the literature. To
-gether with Zoppa and McMahon (2002), they found phenomena as below market financial returns often accepted by SME owners and owner-managers, the alleged finance gap faced by SMEs seeking longer-term development capital.
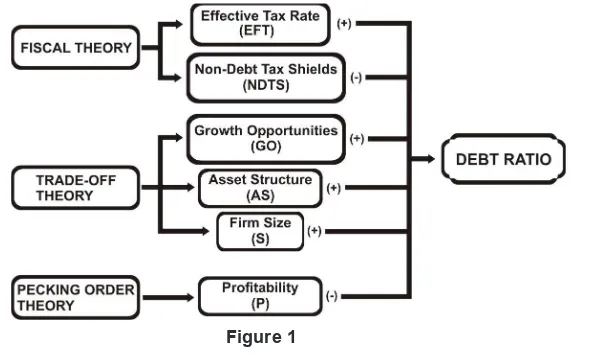
From the theories above, this re
-search can be illustrated as a general framework as shown in Figure 1.
The result of Modigliani and Miller (1958) research becomes pioneer of capital structure issue, which then develops to be theoretical body around it. Its main proposi
-tion establishes that the valua-tion of a com
-pany will be independent from its financial
Figure 1
structure. The result, in this, was triggering other researchers to become more curious in proving the concept of capital structure analysis. For example the existence of tra
-ditional theory, such as: trade-off theory (Miller, 1977) and pecking order theory (Myers and Majluf, 1984). This debate still moves on until this era, but none has the best concept.
Through capital analysis we get some brightening in understanding key issue of firms and developing the debt policy. This understanding will help us to clarify certain firm’s options for debt financing, evaluate tolerance for risk of interest rate changes and engage your board of directors with ownership and understanding of the policy (Pladson, 2005).
Following the prior study formulat
-ed by Mira (2001) and bas-ed on what re
-searcher already stated on theoretical re
-view, hypotheses can be further described as follows:
Fiscal Theory (FT)
H1: “Debt would be positively related to the effective tax rate”
This hypothesis is focus in concept that ar
-gued by M&M, the tendency of firms choose to financed by the debt is regarding to tax deductibility of interest payments. Fiscal theory teach that people with less tax will more wealthier.
H2: “Leverage ought to be negatively relat
-ed with non – debt tax shields”
Other tax shield, just like: depreciation, re
-search and development expenses, etc, will be the second place after using debt.
Trade-Off Theory (TOT)
H3: “Firm leverage will have positively rela
-tionship with growth opportunities”
Growth opportunities are opportunities to expand that arise from the firm’s current operating knowledge, experience, and oth
-er resources. When a company decides to conduct an expansion directly or indirectly, it will affect the debt policy. In real circum
-stance, creditors tend to reduce their sup
-ply to company which has underinvestment problem.
H4: “Asset structure and firm leverage ratio should relate positively”
The existence of debt agency costs will attract the creditors to ask more collateral asset to be requirements of taking loan. Because regarding the money supplier, this type of assets could be sold in market as the compensation of firm’s payment.
H5: “Firm Size and debt level should be positively correlated”
Big companies tend to employ more debt than, so impliedly there is a certain re
-lationship between two components: Size and Debt Ratio. Also larger companies will deal with greater diversification and failure.
Pecking Order Theory (POT)
H6: “There should be a negative relation be -tween leverage and firm profitability”
Based on Myers and Majluf (1984) opinion, company use their funds based on hierarchy in the financing funds. First is in
-ternal capital sources and then ex-ternal. It imply that companies with higher profit at
-tempt to use their retained earnings rather than employ some debt.
RESEARCH METHOD Research Sample
The sample of data was derived from purposive sampling method, specifically those data need to follow several criterion. The criteria were: (1) Companies listed on Indonesia Stock Exchange years 2002-2006. (2) Companies which have positive equity resources and also positive net in
-come over the whole period of study. Com
-panies that were not included in a bankrupt
-cy process which means companies have positive EAT (Earning after Tax) in 3 years respectively.
Research Variable
we calculated based on what we taken in form of economic or financial account of the firm.
Total Debt Ratio (TDR), The mea
-surement gives an idea to the leverage of the company along with the potential risks the company faces in terms of its debt-load. This will tell us how much the company re
-lies on debt to finance assets. Total debt ra
-tio (TDR) = Total Debt : Total Assets . Effective Tax Rate (EFT), Accord
-ing to Modigliani and Miller (1963) in Mira (2001) paper, firms prefer debt to financing their business rather than other resources considering reduce the tax of interest pay
-ment. Effective Tax Rate (EFT) = Taxes : (EAIBT + Depreciation).
Non-Debt Tax Shields (NDTS), The fiscal role of debt can be replaced by other alternative tax shields such as deprecia
-tion, research and development expenses, investment deductions, etc, according to DeAngelo ad Masulis (1980). Non-debt Tax Shields (NDTS) =Depreciation : Total As -sets
Growth Opportunities (GO), Myers (1977) research states that for companies with more growth opportunities will face more intense underinvestment problem. In order to mitigate this problem, firms attempt to employ short-term debt. Growth Oppor
-tunities (GO) = Intangible Assets : Total As -sets.
Asset Structure (AS), Normally, the cause of the existence of debt agency cost, creditor tend to require guarantees for their lending money (could be materialized in collateral assets). These collateral assets will retain value in case of a potential liqui
-dation of the firm, or it also has chance to be sold for the commitment payment. Asset
Structure (AS) = Tangible Assets : Total As -sets.
Size /firm (S), As Warner (1977), Smith and Warner (1979), Ang et al. (1982) and Pettit and Singer (1985) in Mira’s paper (2001) pointed out, larger firms tend to have big capacity to survive and more diversified, so that between size and probability to get collapse will has inversely proxy. Size (S) = Natural logarithm of total assets
Profitability (P), Myers (1984) and Myers and Majluf (1984) assume that, based on Pecking order financing, firms prefer using internal capital sources to ex
-ternal for the next sources. This opinion suggests that higher profitable companies will tend to finance by retaining earnings before debt using.Profitability (P) = ROA= EBIT : Total assets
Technique Data Analysis
Panel data is become the main meth
-odology that used in this empirical research, this is related to best analysis that outcome in the end. The data analysis model can be formulated as follows:
RESEARCH FINDINGS
In EVIEWS 4 we can proceed some analyzing will be better if the data is more complicated. For example: in this analysis, researcher uses several features of analy
-sis which are included in the software (tool). Then researcher found that EVIEWS 4 is better in case of use panel data model to accomplish the analysis. The first result is linear regression analysis with common ef
-fect model; the data is formatted shown as follows:
To simplify the regression measure
-ment of the quite big data, this study uses EVIEWS 4 to accomplish the problems
Where:
DT = Debt Ratio,
EFT = Effective Tax Rate, NDTS = Non-debt Tax Shields, GO = Growth Opportunities, AS = Asset Structure, S = Size (firm size), P = Profitability,
(analysis). In here, researcher chooses Fixed Effect model rather than other. The reason is that the result issued in here is much better than in other model. For ex
-ample Random Effect model, this model can not be used because the number of the variables is bigger than the data time series (2002-2006). According to Judge (1985, in Wimboh, 1996), random effects assump
-tion can produce inefficient estimator when the actual distribution of μi evidently is dif
-ferent from the distribution μi predicted is known. Judge (1985) also suggested that random effects assumption will be better when the number of N (number of cross-section data) is small. Another reason be
-hind the choice of the Fixed Effect model is from the first researcher assumption that intercept and slope around the companies is not the same (Judge, 1985). The result against Panel Regression Model with fixed effect approaching can be shown in table 2.
To strengthen the decision in us
-ing fixed effect model as the main model of statistical analysis, the researcher ana
-lyzes between 2 tables. According to 2 re
-sults produced by 2 models, the best panel regression model can be viewed from the S.E. of regression. Whereas the smaller Standard Error Regression, the more ac
-curate model can be relied on. S.E Regres
-sion of fixed effect model is 0.115667 (see table 2), while the common effect model is 0.180242 (see table 1). Thereby we know that the better model is fixed effect model (shown on table 2).
Interpreting the data shown in table 2, formulation with Fixed Effect as the mod
-el can be wrote as follows:
HYPOTHESIS TESTING
Effective tax rate (EFT) effect to debt ra-tio (TDR)
From the result of t-test on EFT vari
-able just shown in t-able 2, we can get prob
-ability of 0.0001 the value of which is bellow 0.05 (p<0.05). Regression coefficient which has positive value of 0.008794 shows that EFT is proved influencing to debt ratio (TDR) positively. Thereby, Ho is rejected and H1 stating that debt ratio has positive relation
-ship to effective tax rate is accepted. The conclusion was that EFT significantly and negatively influenced TDR. This outcome also support to Mackie-Mason (1990) find
-ing, they stated that the desirability of debt finance at the margin varies positively with the effective marginal tax rate.
This result accordance with Fiscal theory which states a company with high debt will be able to reduce the taxes. Mo
-digliani and Miller (1963) in their revised
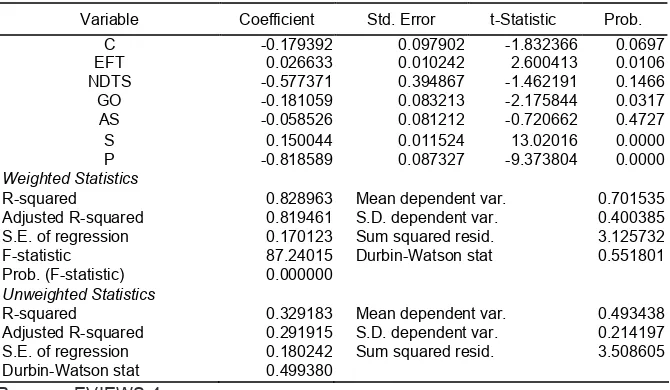
Variable Coefficient Std. Error t-Statistic Prob. C -0.179392 0.097902 -1.832366 0.0697 EFT 0.026633 0.010242 2.600413 0.0106 NDTS -0.577371 0.394867 -1.462191 0.1466 GO -0.181059 0.083213 -2.175844 0.0317 AS -0.058526 0.081212 -0.720662 0.4727 S 0.150044 0.011524 13.02016 0.0000 P -0.818589 0.087327 -9.373804 0.0000
Weighted Statistics
R-squared 0.828963 Mean dependent var. 0.701535 Adjusted R-squared 0.819461 S.D. dependent var. 0.400385 S.E. of regression 0.170123 Sum squared resid. 3.125732 F-statistic 87.24015 Durbin-Watson stat 0.551801 Prob. (F-statistic) 0.000000
Unweighted Statistics
R-squared 0.329183 Mean dependent var. 0.493438 Adjusted R-squared 0.291915 S.D. dependent var. 0.214197 S.E. of regression 0.180242 Sum squared resid. 3.508605 Durbin-Watson stat 0.499380
Table 1
Panel Regression result with Common Effect model
Resourc: EVIEWS 4
paper stated that firms would prefer debt to other financing resources due to the tax deductibility of interest payments. This as
-sumption covered the Fiscal Theory partial
-ly, and outcome from this study is as same as M&M opinion.
Non-debt tax shields (NDTS) effect to debt ratio (TDR)
From the result of t-test on NDTS variable just shown as table 4.4, we can get probability of 0.0194 which is the value bel
-low 0.05 (p<0.05). Regression coefficient which has negative value of -0.241612 shows that NDTS is proved influencing debt ratio (TDR) negatively. Thereby, Ho is rejected and H2 stating that debt ratio has positive relationship to non-debt tax shields can be supported. The conclusion was that
NDTS significantly and negatively influ
-enced TDR.
This result produces the similar result of Mackie-Mason’s Fiscal Theory (1990). Mackie-Mason said that separation proceed of non-debt tax shield (NDTS) in two cate
-gories, those like tax loss carry forward, ex
-pected to generate a negative relationship with debt financing
Growth opportunities (GO) effect to debt ratio (TDR)
The t-test on growth opportunities (GO) variable that appears on table 4.4 re
-sult is probability 0,3658 which p-value is above 0,05. This means that there is no sig
-nificant growth opportunities effect on debt ratio partially exists. Therefore Ho is not re
-jected, which means 3th hypothesis (H
3) is
Variable Coefficient Std. Error t-Statistic Prob.
EFT 0.008794 0.002148 4.094274 0.0001
NDTS -0.241612 0.101434 -2.381966 0.0194
GO -0.021984 0.024180 -0.909202 0.3658
AS 0.009688 0.003348 2.893825 0.0048
S 0.306723 0.010075 30.44448 0.0000
P -0.272549 0.047923 -5.687183 0.0000
Fixed Effects
BUMI--C -1.229701
DAVO--C -1.334166
FAFO--C -1.223805
STTP--C -1.356830
ULTJ--C -1.495689
PBRX--C -1.060812
BATA--C -1.260341
CLPI--C -1.139600
LTLS--C -1.238904
JPRS--C -1.306605
LIMW--C -1.071510
ASII--C -1.725797
HEXA--C -1.114931
TURI--C -1.194989
UNTR--C -1.409206
MAID--C -1.515684
MRAT--C -1.514576
BLTA--C -1.352887
HITS--C -1.281252
ISAT--C -1.688640
TLKM--C -1.725016
HERO--C -1.228243
MPPA--C -1.471005
Weighted Statistics
R-squared 0.996514 Mean dependent var 1.361843
Adjusted R-squared 0.995378 S.D. dependent var 1.701433
S.E. of regression 0.115667 Sum squared resid 1.150589
F-statistic 4916.158 Durbin-Watson stat 1.262977
Prob(F-statistic) 0.000000
Table 2 :
not significant or rejected.
The result on this research is con
-trary with trade-off theory, which states a company with rapid growth will depend on external fund. Moreover, emission cost for common stocks selling normally will be higher than the expenses to publish bond. As a consequence, rapid growth compa
-nies will employ higher debt than a slow-growth company. The insignificant slow-growth opportunities variable was caused by the variable measured by intangible composi
-tion against total assets.
Asset structure (AS) effect to debt ratio (TDR)
The t-test on asset structure (AS) variable shown on table 4.4 result produce probability of 0.0048 the value of which is below 0.05. This shows positive regres
-sion coefficient of 0.009688, which states that AS has a positively significant impact on debt ratio. Therefore, null hypothesis Ho is rejected and hypothesis H4 is accepted, which means that if company assets suits with the conditions of loan request, the company will have a tendency to loan more money. Thereby, a company which employs an asset to be the collateral of debt tends to use bigger debt.
Based on static trade-off theory, As
-sets tangibility will affect leverage posi
-tively. Harris and Raviv (1991) assumed a company with low level of Fixed Assets will get more problems on asymmetric in
-formation compared to company which has higher level of fixed assets. Reciprocally, a company with high level of fixed asset is a big company. This category of companies will be able to sell their stocks with a fair rate and they will not use loan to finance their investment.
Size (S) effect to debt ratio (TDR)
T-test result on firm size (S) variable that emerge on table 4.4 result probability of 0,0000 the value of which is less than 0.05 (p<0.05). This outcome also shows positive regression coefficient of 0.306723 which means firm size has a positive and significant impact on debt ratio. So fifth (H5) hypothesis is accepted, which means that there is positive correlation among firm size and debt ratio can be proved.
If we look at positive regression coef
-ficient, it shows that the higher firm size, the higher company debt ratio. Normally, this is because big firm will be followed by bigger number of assets. With their assets, a big company will be easier to propose a loan then the smaller companies. Big number of assets will become bond holder’s collateral to get great loan. Therefore, debt ratio’s company can increase.
Profitability (P) effect to debt ratio (TDR)
The t-test on profitability (P) variable result that appear on table 4.4 produces probability of 0.0000 the value of which is less than 0,05 (p<0.05). By negatively re
-gression coefficient, profitability will affect debt ratio (TDR) significantly negative which means that negative relation between prof
-itability and debt ratio exist. Thereby, null hypothesis (Ho) is rejected or sixth (H6) hy -pothesis is accepted. It consistent with the Mira (2001) result which assumed more profitable, SMEs tend to use lesser debt when financing their business activity.
It is caused by the bigger profitability of a company, the bigger the company’s li
-quidity. The implication is on long-term debt deduction where internal source of fund is enough to market expansion. The bigger profitability, the bigger retained earnings. Finally, own capital will increase and simul
-taneously it will decrease debt ratio. It is in accordance with Pecking Order Theory and Graham (2006) finding.
CONCLUSSION AND SUGGESTION Based on the result and latest discus
-sion, the conclusions of this research are: Based on t-test, the effects of each variable to the dependent variables are: Effective tax rate (EFT) influence debt ratio (TDR) positively and significantly; Non–debt tax shields (NDTS) influence debt ratio (TDR) negatively and it is significant; Growth op
-portunities (GO) influences debt ratio (TDR) insignificantly, but it has a negative influ
-ence which is contradictory to the hypothe
-sis; Asset structure (AS) has positive effect to debt ratio (TDR) and it is significant; Firm size (S) influence debt ratio (TDR) posi
ratio (TDR).
Variable Effective tax rate, assets structure and firm size have a positive and significant effect on company debt ratio, partially. It means, the higher company ac
-tive value, the higher effec-tive tax rate and structure asset of the company in using fund resource from debt. Others, non-debt tax shields and profitability value made a significant effect negatively to debt ratio, it means higher profitability and non-debt tax shields then more decrease the company using fund resource from debt. While for growth opportunities variable didn’t made a significant effect to debt ratio.
The researcher gives the following recommendations for the next research:
For the variable in third hypothesis, we found that growth opportunities doesn’t have significant influence on debt ratio. In the next study, researcher suggests, the
variable ratio should be changed. If in this research the compositions of ratios are in
-tangible assets with total assets, it will be better if this is changed to other variables. For example: sales revenue, or gross profit. Then we can find better result in analyzing the growth opportunities, before change it into another proxy.
It will be better if the periods of re
-search sample are added into longer peri
-ods so that information emerging from it can be more supporting, for instance panel re
-gression analysis with random effect model can be used.
Number of the companies sample should be bigger, at least 30 companies. The number ratios of finance will be used in the research sample should be increased so that the result can be more complete.
REFERENCES
Barclay, Michael J. and Smith, Clifford W. Jr. (1999), “The capital structure puzzle: another look at the evidence”. Journal of Applied Corporate Finance, Spring, Vol. 12, No. 1, pp. 8-20.
Berger, Allen N. and Patti, Emilia Bonaccorsi. (2002), Capital Structure and Firm Performance: A New Approach to Testing Agency Theory and an Application to the Banking Industry, Federal Reverse System, Bank of Italy.
Brounen, Dirk and Eichhotlz, Piet M.A. (2001), Capital Structure Theory: Evidence from European Property Companies’ Capital Offerings, University of Amsterdam
Drobetz, Wolfgang and Fix, Roger. (2003), “What are the Determinants of the Capital Structure? Some Evidence for Switzerland”, Working paper, University of Basel and University st. Gallen.
Frank, Murray Z. and Goyal, Vidhan K. (2005), Trade-off and Pecking Order Theories of Debt, Hong Kong University of Science & Technology.
Frydenberg, S. (2004), Capital Structure Theory–A Review. Sør-Trøndelag University College.
Ghosh, C., R. Nag and C.F. Sirmans. (2000), “The Pricing of Seasoned Equity Offerings: Evidence from REITs”, Real Estate Economics, Vol. 28, pp.363-384.
Graham, J., and C. Harvey, (2001), “The Theory and Practice of Corporate Finance: Evidence from the Field”, Journal of Financial Economics, Vol. 60, pp.187-243.
Graham, John R. (2006), Taxes and capital structure. http://www.entrepreneur.com/ , retrieved on March 31.
Harris, Milton and Raviv, Artur. (1990), “Capital Structure and the Informational Role of Debt”.
The Journal of Finance, Vol. 45, No.2, pp.321-349.
Hovakimian, A., T. Opler, and S. Titman. (2001). “The debt-equity choice”, Journal of Financial and Quantitative Analysis, Vol. 36, pp.1-25.
Leland, Hayne and Pyle, David. (1977), “Informational Asymmetries, Financial Structure and financial Intermediation”,Journal of Finance, Vol. 32, PP. 371–387.
Leland, Hayne E., (1994), “Corporate Debt Value, Bond Covenants, and Optimal Capital Structure”. The Journal of Finance, Vol. 49, pp.1213-1252.
Mackie, Jeffrey K. and Mason. Dec. (1990), “Do Taxes Affect Corporate Financing Decisions?”
The Journal of Finance, Vol. 45, No.5, pp.1471-1493.
Mira, Francisco Sogorb. (2001), On capital structure in the Small and Medium Enterprises: the Spanish case, Universidad Cardenal Herrera.
Myers. S and Majluf. (1984), “Corporate Financing and Investment Decision When Firms have information Investors Do not Have”, Journal of Finance Economics, Vol. 13, pp. 187-221.
Pladson, Terence, February (2005), “Why develop a debt policy? Consider the risks and rewards of variable rate interest and options for financing debt.” http://findarticles. com/p/articles/mi_m0843/is_1_31/ai_n10016742, retrieved on April 01, 2008.
Sarkar, Sudipto. (2007), The Trade-Off Model with Mean Reverting Earnings: Theory and Empirical Tests. Southern Methodist University
Titman, Sheridan and Wessels, Roberto. (1988), “The Determinants of Capital Structure Choice”, The Journal of Finance, Vol. 43, No.1, pp. 43-55.