Arch. Tierz., Dummerstorf44 (2001) 6, 649-659
Faculty of Animal Science, Bogor Agricultural University1- Center Research for Animal Production, Ciawi BogoH
Indonesia and Institut für Tierzucht und Tierhaltung mit Tierklinik der Martin-Luther-Universität Halle-Wittenbere'
Germany "'
RONNY RACHMAN NOOR', ANDI DJAJANEGARA2 and LUTZ SCHÜLER3
Selection to improve birth and weaning weight of
Javanese Fat Tailed Sheep
Dedicated to Prof. Dr. Dr. h. c. Hans Joachim Schwark on the occasion of his 75'h birthday
Summary
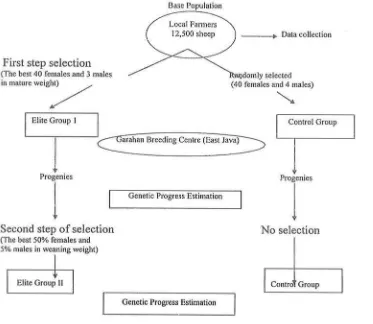
In Indonesia, the Javanese Fat Tailed Sheep is a very populär domestic animal for its meat production However selection to increase body weight has never been done by local farmers. As a result the variability of body weight is high, and expected that application ofa selection program can improve this trait Two Steps of selection were done in order to improve birth and body weight. In the first selection, the elite group was established by selecting the best 40 females and 3 males from 12500 sheep reared by local farmers based on their mature body weight and tail length. The control group was established by randomly selecting 40 females and 4 males In the second step of selection, the best 50% females and 5% males of the progeny of the elite group was selected based on their weaning weight and tail size. The first selection results indicate that there was a positive genetic progress in both birth and weaning weight. Selection had increased 7.17% and 5.48% of male and female birth weight respectively and 9.48% and 9.78% of male and female weaning weight, respectively. Positive genetic progresses of birth and body weight were also found after the second selection. Birth weights of males and females were 6.75% and 7.20% higher than those in the control group. Male and female weaning weights were 5.60 % and 8.19% higher than those in the control group, however, selection for weaning weight did not affect reproduetive traits.
Kev Words: sheep, genetic, selection, weight, heritability
Zusammenfassung
Titel der Arbeit: Selektion auf Erhöhung des Geburts- und Absetzgewichtes beim Javanischen Fettschwanzschaf
Das Javanische Fettschwanzschaf spielt in Indonesien eine große Rolle in der Versorgung der Bevölkerung mit Fleisch. Eine Selektion auf Erhöhung der Körpermasse durch die Züchter ist nicht erfolgt. Diese Rasse ist durch eine hohe Variabilität der Körpermasse charakterisiert, die eine Selektion ermöglicht. In zwei Stufen wurde zur Verbesserung der Geburts- und Körpergewichte ein Selektionsprogramm realisiert.. In der ersten Stufe wurde eine Elitepopulation gebildet, die aus 40 weiblichen und 3 männlichen Tieren bestand und aus einer Gesamtpopulation von 12.500 Schafen selektiert wurde. Die zufällig selektierte Kontrollgruppe bestand aus 40 weiblichen und 4 männlichen Tieren.
Im zweiten Schritt wurden 50% der besten weiblichen und 5% der besten männlichen Nachkommen dieser Ehtetiere auf der Grundlage ihrer Absetzgewichte und der Schwanzlänge selektiert. Diese Selektion erhöhte sowohl das Geburts- als auch das Absetzgewicht. So erhöhten sich die Geburtsgewichte um 7,17% a und 5,48% 9 und im Absetzgewicht um 9,48% er bzw. 9,78% 9. Ein positiver züchterischer Erfolg in beiden Merkmalen wurde auch im zweiten Selektionsschritt erhalten. So war das Geburtsgewicht der männlichen und weiblichen Tiere um 6,75% und 7,20 % höher als die der Kontrolle und im Absetzgwicht um 5,60% bzw. 8,19% Überlegen. Diese Form der Selektion nach Absetzmasse und Schwanzlänge hatte keinen negativen Effekt auf die Fruchtbarkeitsmerkmale.
Introduction
The sheep population in Indonesia is the largest when compared to that in other South
East Asian countries. In 1992, the number of sheep in Indonesia was 5,750,000 with
49.97% of them concentrated in West Java.
There are two types of sheep, i.e. thin tailed sheep and fat tailed sheep. Thin tailed
sheep can be found in the wet areas, e.g. West Java. On the other hand fat tailed sheep
can mostly be found in dry areas, e.g. East Java and the eastern parts of Indonesia
(SUTAMA, 1992). The sheep are relatively small, with mean mature ewe weight of 20
to 39 kg under traditional management. However, they are well adapted to the warm,
humid climate of the country. They breed all year around and can have a mean
lambing intervals of as low as 200 days (BRADFORD and INOUNU, 1996).
DEVENDRA and McLEROY (1982) suggested that the javanese fat tailed sheep
originated from West Asia and/or East Asia and were introduced by Arab traders
hundred years ago. EDEY (1983) stated that after the introduction, the Indonesian fat
tailed sheep were concentrated at Madura Island and then spread out to different parts
of East Java and Nusa Tenggara Islands. The original fat tailed sheep have been
crossed with some local sheep resulting in the fat tailed sheep that are found at present.
MASON (1980), DEVENDRA and McLEROY (1982), SUTAMA and INIGUEZ
(1990), SAKUL et al. (1994), and BRADFORD and INOUNU (1996) described the
characteristics of fat tailed sheep as follows: hornless, white coat colour, medium size
ear, sigmoid shaped tail with 15-18 vertebra! bones, birth weight of 1.6 kg, weaning
weight of 8.6 kg; mature weight is 43 and 40 kg for male and female respectively, and
prolific ewes with high frequency of litters of three, four or more than can be expected
for populations with mean litter size of generally between 1.3 and 1.9. SABRANI et
al. (1993) found that lamb survival of this type of sheep is low (51.4%), coefficient of
Variation of weaning weight is high (26.60%) and coefficient of Variation of mature
weight is even higher (45.45%). With these high phenotypic variabilities, the breeder
can select them in order to get significant improvements in birth and weaning weight.
Selection on birth and weaning weight of javanese fat tailed sheep has not been done
(Noor et al., 1998). Therefore, the main objective of this experiment was to evaluate
birth and weaning weight through selection.
Material and Methods
An intensive survey was conducted to collect important data from 12500 sheep reared
by local farmers in areas of East Java (in six districts, i.e. Situbondo, Sumenep,
Bondowoso, Pasuruan, Pamekasan, and Probolinggo). The data collected were sex,
age, birth type, number of sheep at weaning (3 months old), mature body weight (the
age estimated based on the formation of permanent teeth), body length, body height,
heart girth, tail length, tail width, coat colour.
Units of measurement were (i) body weight (kg): animal weight before eating in the
morning, (ii) body length (cm): distance between
Tuber ischii
to
Tuberositas humeri,
Arch. Tierz. 44(2001)6 651
Correlation among traits
In order to study the relationship among the body measurements and the relationship
between body weight and linear body measurements, coefficients of correlation were
estimated.
First Step of Selection
The elite group was established by selecting the best of 40 females and 3 males based
on their mature weight from the 12,500 sheep that were measured independent from
age, birth type and lactation (Fig. 1). Besides the mature weight, the selected sheep
should have white colour coat, free from any exterior abnormalities, have large and
sigmoid shaped tail. The size and shape of tail are the second selection criteria,
because the traits are highly correlated to the ability of animals survive in dry areas.
The selection method used in this experiment was independent culling level.
The control group was established by randomly selecting 40 females and 4 males. It
should be noted that in the elite group only three males have mated the selection
criteria. Both groups then were maintained at Garahan Research Centre, at Jember,
East Java . Both groups were given the same type and quality of feed.
Base Population
First step selection
(The best 40 females and 3 males in mature weight)
Data collection
domly selected (40 females and 4 males)
Elite Group 1
jarahan Breeding Centre (East Java)
Control Group
i
ProgeniesGenetic Progress Estimation
Second step of selection
(The best 50% females and 5% males in weaning weight)
Progenies
No selection
Elite Group II Contro* Group
[image:3.516.52.425.293.617.2]Genetic Progress Estimation
Second Step of Selection.
The progenies of both groups were maintained until they were weaned.
The best 50% females and 5% males of the progeny of the elite I group were
selected based on their weaning weight and used for the parent for the next generation.
There was no selection in the control group.
Heritability Estimation
The heritability of birth and weaning weight was estimated using 'Animal Model' of
DFREML (MEYER, 1993). The heritability values were estimated from lambs which
were born from the elite and control groups. Both sex and birth types were treated as
fixed effects. Differential Selection (DS) was calculated using the following formula
(NOOR, 1996):
DS =
Ye - Yc
where:
DS : differential selection
Xe
: means of birth or weaning weight at the elite group
Xc
: means of birth or weaning weight at the control group
Genetic progress per generation (per selection cycle) was calculated using the
following formula:
AG = h
2x DS
where,
AG : genetic progress
h
2: heritability of birth or weaning weight
DS : differential selection
Results
Means of Body Measurement Traits
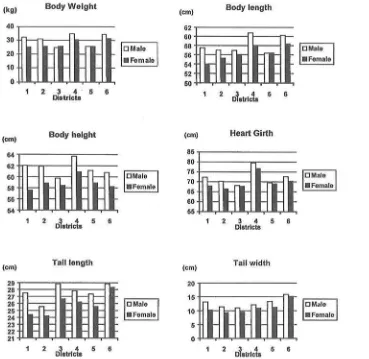
In general, the javanese fat tailed sheep originating from Pasuruan, Situbondo and
Probolinggo were significantly larger than those of other districts (Fig. 2). The
variations in mean body measurement traits among district were high.
Coefficient of correlation among body measurement traits in the six different districts
at the base population is presented in Table 1.
Arch. Tierz. 44 (2001) 6 653
(kg) Body Weight (cm)
62 60 50 56 54 52 50
Body length
Sil
PMaie• Female
1 2 3 4 5 6 Districts
(cm)
64
S2 60
50 56
54
Body height Heart Girth
Si
DMale• Female
1 2 3 4 5 6 Districts
(cm)
29 20 27 26 25 24 23 22 21
Tail length
iü
DMale• Female
1 2 3 4 5 6
Districts
(cm) Tail width
[image:5.516.67.436.85.444.2]1 2 3 4 5 6 Districts
Fig. 2: The body weight, body length, body height, heart girth, tail length and tail width of male and female javanese fat tailed sheep in six districts in East Java (Note: 1. Situbondo, 2. Sumenep, 3. Bondowoso, 4. Pasuruan, 5, Pamekasan and 6. Probolinggo) (Körpergewicht, Körperlänge, Körperhöhe, Herzumfang, Schwanzlänge, Schwanzbreite von männlichen und weiblichen Javanesischen Fettschwanzschafen in 6 Regionen von Ostjava (Region I. Situbondo, 2. Sumenep, 3. Bondowoso, 4. Pasuruan, 5. Pamekasan und 6. Probolinggo))
Table 1
Coefficients of correlation among body measurement traits of male (lower diagonal) and female (upper diagonal) javanese fat tailed sheep in Situbondo, Sumenep, Bondowoso, Pasuruan, Pamekasan, and Probolinggo (Korrelationskoeffizienten zwischen den Merkmalen der Körperkonformation in männlichen (unter der Diagonalen) und weiblichen (über der Diagonalen) Javanischen Fettschwanzschafen in 6 Regionen)
Groups Traits
Situbondo BW BL BH HG TL TW
BW BL BH HG TL TW
*
0.286 0.727 0.740 0.463 0.744
0.429
*
0.673 0.341 0.530 0.272
0.534 0.671
«
0.627 0.598 0.615
0.692 0.370 0.554
*
0.455 0.584
0.373 0.334 0.367 0.356
*
0.532 0.452 0.153 0.268 0.362 0.280
[image:5.516.55.429.574.652.2]Table 1 (continuation)
Sumenep BW BL BH HG TL TW
BW BL BH HG TL TW 0.642 0.547 0.799 0.479 0.632 0.440
*
0.508 0.534 0.530 0.551 0.549 0.491»
0.497 0.420 0.490 0.759 0.332 0.554*
0.264 0.425 0.193 0.421 0.229 0.116*
0.738 0.551 0.460 0.430 0.456 0.504*
Bondowoso BW BL BH HG TL TW BW BL BH HG TL TW 0.743 0.749 0.838 0.558 0.478 0.536
*
0.783 0.673 0.616 0.393 0.511 0.670*
0.770 0.494 0.496 0.755 0.582 0.602 0.756 0.689 0.315 0.317 0.304 0.452*
0.702 0.474 0.414 0.299 0.599 0.392Pasuruan BW BL BH HG TL TW
BW BL BH HG TL TW 0.403 0.547 0.647 0.711 0.539 0.106
*
0.756 0.590 0.078 0.118 0.458 0.634*
0.594 0.260 0.191 0.737 0.262 0.458 * 0.502 0.431 0.335 -0.098 0.034 0.098 * 0.659 0.560 0.002 -0.049 0.550 0.223Pamekasan BW BL BH HG TL TW
BW BL BH HG TL TW 0.637 0.649 0.738 0.633 0.647 0.372
*
0.604 0.547 0.412 0.505 0.530 0.439 0.763 0.448 0.615 0.645 0.347 0.518*
0.508 0.685 0.433 0.155 0.353 0.377*
0.610 0.391 0.402 0.444 0.500 0.271Probolinggo BW BL BH HG TL TW
BW BL BH HG TL TW 0.088 0.243 0.190 0.435 0.437 0.107
*
0.799 0.433 -0.210 -0.109 0.309 0.755*
0.416 -0.410 -0.269 0.077 0.642 0.623*
-0.020 0.110 0.517 -0.101 -0.375 -0.106*
0.281 0.462 0.040 -0.162 0.102 0.403Note: BW: body weight; BL: body length; BH : body height; HG : heart girth; TL: tail length; TW: tail widüi
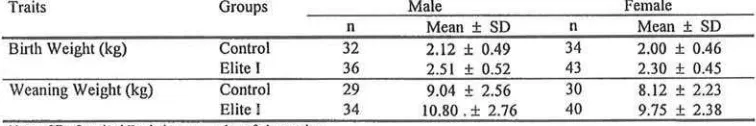
Selection Experiment Results
[image:6.516.48.426.526.589.2]Birth
and body weight of sheep in the elite I and control
groups are presented in Table
2.
Table 2
Birth and weaning weight of male and female javanese fat tailed progenies sheep in the elite I and control groups after the first selection (Geburts- und Absetzgewichte von männlichen und weiblichen Nachkommen in der Elite
Traits
Birth Weight (kg)
Weaning Weight (kg)
Groups Control Elite I Control Elite I n 32 36 29 34 Male
Mean ± SD 2.12 ± 0.49 2.51 + 0.52 9.04 + 2.56 10.80. ± 2.76
n 34 43 30 40 Female Mean + SD 2.00 ± 0.46 2.30 ± 0.45 8.12 ± 2.23 9.75 ± 2.38 Nolc : SD; Standard Deviation, n: number of Observation
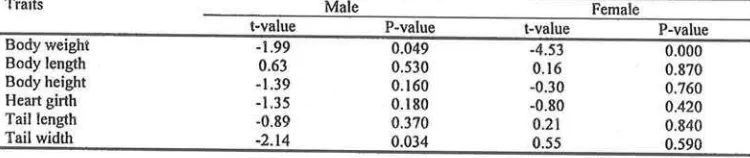
Arch. Tierz. 44 (2001) 6
increased the male tail width, however selection on mature weight did significantly
increased body length, body height, heart girth and tail length of both male and female
animals (Table 3).
Table 3
The t-test result between the means of body weight, body length, body height, heart girth, tail length and tail width in the elite I and control groups (Ergebnisse des t-Tests ftlr die Merkmale der Körperkonformation in der Elite (1) und Kontrollgruppe)
Traits Body weight Body length Body height Heart girth Tail length Tail width t-value -1.99 0.63 -1.39 -1.35 -0.89 -2.14 Male P-value 0.049 0.530 0.160 0.180 0.370 0.034 t-value -4.53 0.16 -0.30 -0.80 0.21 0.55 Female P-value 0.000 0.870 0.760 0.420 0.840 0.590
The estimated heritability values at all ages were moderate to high (Table 4), however,
due to the small number of animals used, the Standard errors of heritability values
were relatively high. As the animals were getting older, the additive genetic (V
A),
environmental (V
E) and phenotypic (V
P) variances were also getting larger (Table 4 ).
Table 4Estimated heritability values (h2) and Standard error (SE) of body weight of javanese fat tailed sheep at different ages, Additive Genetic (VA), environmental (VE) and phenotypic (VP) variances, phenotypic Standard deviation (SDP) and phenotypic coefficient of Variation (CVP) (Heritabilitäten (h2) und Standardfehler (SE) des Körpergewichtes in verschiedenen Altersstufen und deren Varianzkomponenten (VA - additiv-genetische Varianzen, VE - Umweltvarianzen, VP - phänotypische Varianzen, SDP - phänotypische Standardab-weichungen, CVP - phänotypische Variationskoeffizienten))
Body Weight at Number of h2 ± SE V
A VE VP ~~SD^ CV^
week Animals r%\
[image:7.516.51.426.154.233.2]1 2 3 5 6
"/
8 9 10n
13 14 73 73 73 73 7373
72 72 72 71 71 71 0.385 ±0.282 0.259 ± 0.239 0.122 ±0.152 0.403 ±0.131 0.390 ±0.315 0.276 ± 0.278 0.357 ±0.323 0.257 ± 0.323 0.445 ± 0.450 0.647 ± 0.432 0.487 ±0.322 0.173 ±0.144 0.082 0.171 0.144 1.017 1.465 1.366 1.402 1.403 2.263 3.669 2.843 0.888 0.131 0.493 1.032 0.151 2.291 3.584 4.050 4.045 2.827 1.994 2.993 4.244 0.212 0.775 0.176 2.525 3.756 5.950 5.452 5.448 5.090 5.663 5.836 5.132 0.461 0.816 1.085 1.589 1.938 2.225 2.335 2.334 2.256 2.374 2.416 2.265 21.27 25.55 24.07 23.75 25.48 26.02 24.70 24.12 22.21 22.60 20.64 18.90 Table 5The differential selection and genetic progress of birth and weaning weight of males and females javanese fat tailed sheep after the first selection (Selektionsdifferenz und Selektionserfolg im Geburts- und Absetzgewicht nach dem 1. Selektionsschritt)
Differential Selection (kg)
Genetic Progress (kg)
Traits
Birth Weight (kg) Weaning Weight (kg) Birth Weight (kg) Weaning Weight (kg)
Male 0.3927 1.76 0.1520 0.8571 Female 0.303 1.63 0.1169 0.7938
weight, respectively, and 9.48% and 9.78% of male and female weaning weight,
respectively.
The female reproduetive Performance in the elite I and control groups are (Table 6),
showed that selection on mature weight did not significantly affect reproduetive traits.
Table 6
Pregnancy rate, birth rate, prolification and reproduction rate of sheep in elite 1 and control group progenies
ITZr.tr.litlwrlsaitcA'ite'ri in Acr PlitA I iinH I ^ n n t r n l l o n i n n p ^
Traits Pregnancy rate' Birth rate2 Prolification5 Reproduction rate4
Elite I Group 99.67 ± 1.05 98.80 ± 2.83
1.54 ± 0.19 1.18 ± 0.08
Control Group 95.74 ± 7.10 94.53 ± 7.94 1.66 ± 0.34 1.12 ± 0.12
P value 0.073 0.093 0.290 0.200
Note
1 Number of pregnant ewes divided by number of mated ewes x 100 % 2 Number of ewes giving birth divided by number of mated ewes x 100 % 3 Number of bom sheep divided by number of pregnant ewes
4.Number of weaned sheep divided by number of mated ewes P- Value Probability value ofthe t-test
[image:8.516.43.425.347.415.2]Positive genetic progresses of birth and body weight were also found after the second
selection. Birth weights of males and females were 6.75% and 7.20% higher than those
in the control group. Male and female weaning weights were 5.60 % and 8.19% higher
than those in the control group (Tables 7 and 8).
Table 7
Birth and weaning weight of male and female javanese fat tailed sheep progenies at elite II and control group
Traits
Birth Weight (kg)
Weaning Weight (kg)
Groups
Control Elite II Control Elite II
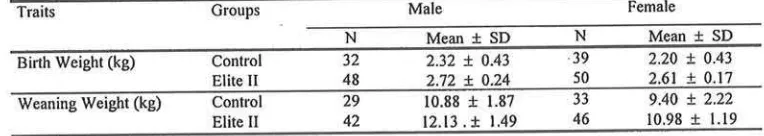
N 32 48 29 42
Male
Mean ± SD 2.32 ± 0.43 2.72 ± 0.24 10.88 ± 1.87 12.13. ± 1.49
N 39 50 33 46
Female
Mean ± SD 2.20 ± 0.43 2.61 ± 0.17 9.40 ± 2.22 10.98 ± 1.19
[image:8.516.56.425.469.521.2]Note: SD : Standard Deviation, n: number of Observation
Table 8
The differential selection and genetic progress of birth and weaning weight of males and females javanese fat tailed sheep after the second selection (Selektionsdifferenz und Selektionserfolg im Geburts- und Absetzgewicht
Differential Selection (kg)
Genetic Progress (kg)
Traits
Birth Weight (kg) Weaning Weight (kg) Birth Weight (kg) Weaning Weight (kg)
Male 0.40 1.25 0.1548 0.6088
Female 0.41 1.58 0.15867
0.7695
Discussion
The Variation of body measurement traits between districts were high (Fig. 2).
Considering that the feed quality and management system in those districts are almost
similar, it was suggested that this high Variation is caused by the genetic Variation due
to the fact that no selection had been done before.
Arch. Tierz. 44 (2001) 6 657
[image:9.516.55.400.205.483.2]The javanese fat tailed sheep is a prolific breed. They produce single (34.41%), twins
(42.16%), and triplets and quadruplets (23.43%), however, the mortality rate of twins,
triplets and quadruplets are higher than Singles (9.89% for twins, 12.49% for triplets
and quadruplets vs. 0.01% for single). The causes of this high mortality of twins,
triplets and quadruplets were due to low birth weight and lack of milk. This high
mortality at birth may be significantly reduced by providing better feeding to pregnant
ewes at the last quarter of the pregnancy period and by giving sufficient milk to the
new-born sheep. Considering the available facilities and knowledge of local farmers,
it is recommended that selection should also be aimed at producing twins rather than
triplets or quadruplets. In most cases, farmers can still manage twin born sheep
properly, hence, the mortality can be kept low.
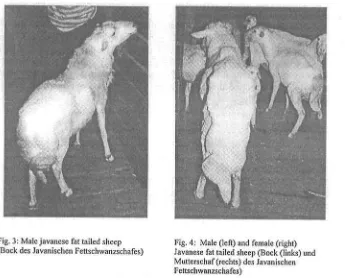
Fig. 3: Male javanese fat tailed sheep
(Bock des Javanischen Fettschwanzschafes) Fig. 4: Male (left) and female (right) Javanese fat tailed sheep (Bock (links) und Mutterschaf (rechts) des Javanischen Fettschwanzschafes)
The first selection results indicated that positive genetic progress in both birth and
weaning weight. Selection had increased 7.17% and 5.48% of male and female birth
weight, respectively, and 9.48% and 9.78% of male and female weaning weight,
respectively. It should be noted that if the genetic progress is calculated using the
formula AG = h
2x i o> where, AG is the genetic progress, h
2is heritability values, i is
The results indicate that local sheep can be improved genetically using a conventional
selection method. Occasionally black and brown spot colour still appeared in the elite
group. However, the percentage of this oecurrence was very low. During the
experiment no abnormalities are apparent in the elite group.
Tail shape is also an important trait in this experiment. The tail size is closely related
to the ability of the animal survive in the dry area. The fat deposit in the tail may
function as a body reserve and utilized when the environmental conditions and feed
quality are poor. The tail size will appear small in this condition, however, when the
environmental condition is retumed to normal, the tail size become large. INIGUEZ et
al. (1991) found that among the fat-tailed populations in Indonesia, those on the island
of Madura had on the average the most extreme fat tails. Under good feeding
conditions, fat mass of the tails interfered substantially with the ability of the rams to
serve ewes (OBST et al., 1980).
Selection also improved the size of tail (Figures 3 and 4) and the large size ofthe tail
made it difficult to mate naturally. The tail has to be Iifted up during the mating. In
order to solve this problem several females were docked. The docking result indicate
that males do not want to mate if the tail of the female is too short. The male tend to
mate female animals with normal tail. Based on these results it is recommended that
selection should aim to produce sheep with large body size and optimum tail size so
they still couid mate naturally.
Conclusion
Selection on weaning weight of javanese fat tailed sheep substantially improved birth
and weaning weights, however, this selection did not significantly affect reproduetive
traits. Further improvement could still be expected if the selection is continued.
Considering the high mortality rate in triplets and quadruplet lambs, under the present
local farmer management condition in Indonesia, it is recommended to select ewes
towards producing Singles and twins.
Acknowledgements
This research was supported by ARMP II project funds from The World Bank. This
paper was written while R.R. Noor on study visit at Marthin Luther University,
Halle-Wittenberg Germany supported by DAAD. Special thank to Grahan Sheep and Goat
Breeding Centre research group for making this experiment possible.
References
BRADFORD, G.E.; INOUNU, I.:
Prolific breeds of Indonesia. Pp. 137-146. Dalam: Prolific Sheep. Ed. M.H. FAHMY. CAB International, University Press, Cambridge. London. 1996
DEVENDRA. C; McLEROY, G.B.:
Goat and Sheep Production in the Tropics. Longman Group Limited, London. 1982 EDEY, T.N.:
Tropical Sheep and Goat Production. Australian Universities International Development Program (AUIDP), Canberra, Australia. 1983
INIQUEZ, L.; BRADFORD, G.E.; KOMARUDIN, K.; SUTAMA, I.K.:
659 Arch. Tierz. 44(2001) 6
MASON, I.L.:
Prolific Tropical Sheep. Food and Agricultural Organisation. Rome, Italy. 1980
MEYER, K.:
Derivative Free Maximum Likelihood (DFREML) Manual. Animal Genetics and Breeding Unit. University ofNew England, Australia. Armidale, 1993
NOOR, R.R.:
Genetika Ternak. Penebar Swadaya, Jakarta. 1996 NOOR, R.R.; SAEFUDDIN, A.; DJAJANEGARA, A.; INOUNU, I.:
The genetic improvement of Javanese Fat Tailed Sheep through selection. Research Report. Bogor Agricultural University - ARMPII project of Agricultural Agency for Research and Development 1998 OBST, J.M.; BOYES, T.; CHANIAGO, T.:
Reproduetive Performance of Indonesian sheep and goats. Proceedings Australian Society of Animal Production 13 (1980), 321-324
SAKUL, H.E.; BRADFORD, G.E.; SUBANDRIYO:
Prospects of genetic improvement of small ruminants in Asia. Proc. of a Symposium held in conjunetion with the Seventh AAAP, July 11-16, Denpasar, Bali, Indonesia 1994
SABRANI, M.; DJAJANEGARA, A.; SUTAMA; I.K.:
Report on Genetic Improvement of Javanese Fat Tailed Sheep. Bogor Research Institute for Animal Production, Ciawi Indonesia and FAO. 1993
SUTAMA, I.K.:
Domba Ekor Gemuk di Indonesia: Potensi dan Permasalahannya (Javanese Fat Tailed Sheep in Indonesia: Potential and Problems). Prosiding Saresehan Usaha Ternak Domba and Kambing Menyongsong Era PJPT II (Proceedings of the Discussion on Sheep and Goat Breeding towards the Second Indonesia Long Term Development Projects), 13-14 December 1992. Ikatan Sarjana Ilmu-ilmu Peternakan Indonesia, Cabang Bogor. 1992
SUTAMA, I.K.; INIGUEZ, L.:
Proceedings ofa Workshop on Production Aspects of Javanese Fat Tail Sheep, 10-11 August, Surabaya, East Java, Indonesia. Bogor Research Institute for Animal Production, Ciawi Indonesia. 1990
Received: 1998-12-02
Accepted: 2001-10-12
Authors' addresses
RONNY RACHMAN NOOR, Ir. MRur.Sc. Ph.D. Faculty of Animal Science
Bogor Agricultural University Kampus 1PB Darmaga Bogor 16680 Indonesia
ANDI DJAJANEGARA; Ir., MAgrSc, Ph.D. Centre Research for Animal Production Ciawi, Bogor
Indonesia
Prof. Dr. habil. LUTZ SCHÜLER
Landwirtschaftliche Fakultät der Martin-Luther-Universität Halle-Wittenberg Institut flir Tierzucht und Tierhaltung mit Tierklinik
Adam-Kuckhoff-Straße 35 D-06108 Halle
Umweltbedingte Rückstände in Fleisch - Abnahme der Gehalte in den
vergangenen 25 Jahren
H. HECHT, Kulmbach, Kurzfassung eines Fachvortrages anläßlich der 36. Kulmbacher
Woche, 8. - 9. Mai 2001, Kulmbach
Anfang der 70er Jahre des vorigen Jahrhunderts fing man während des auf Hochtouren laufenden Wirtschafts-wunders allmählich an, sich über die Schwermetallemissionen und die dadurch bedingten Immissionen auf Nutz-und Futterpflanzen Gedanken zu machen. Das Hauptinteresse galt damals dem Blei, zu dem schnell Arsen, Cad-mium und Quecksilber kamen. Da die Höchst- bzw. Richtwerte für die Futter- und Lebensmittel nicht aufeinan-der abgestimmt festgelegt wurden, müsste ihre gegenseitige Verträglichkeit durch Carry-over-Experimentc über-prüft werden.
Man stellte schnell fest, dass die Schwermetellbelastungen einiger Lebens- und Futtermittel aus toxikologischer Sicht recht hoch waren und man Maßnahmen ergreifen müsste, die Immissionen als ihre Quellen zu reduzieren. Einige Änderungen der technischen Anleitung Luft zusammen mit stufenweisen Reduzierungen der Bleigehalte in Vergaserkraftstoffen waren die Folge. Die dort festgelegten Höchstwertregelungen wurden laufend verschärft mit der Folge, dass die Schwermetallbelastung vor allem bei Blei, Cadmium und Quecksilber in den Folgejahren bis zum heutigen Tage laufend abnimmt. Heute sind z. B. die Bleigehalte der Lebern und Nieren, also in den Akkumulationsorganen der Tiere für diese Elemente niedriger als sie es damals im Fleisch waren. Im Fleisch sind die Blei-, Cadmium und Quecksilbergehalte mittlerweile so niedrig, dass sie mit den modernsten Spurenelement-Nachweismethoden nicht mehr oder gerade noch nachgewiesen werden können. Die fallenden Trends der Um-weltbelastung können mit Hilfe standorttreuer Wildtiere gezeigt werden.
Nach den Schwermetallen traten bald auch die persistenten Organochlorverbindungen, meist waren es Pestizide, als Umweltkontaminanten in Erscheinung. Es begann mit dem DDT und seinen Metaboliten, ß-HCH folgte und endet heute bei polychlorierten Dibenzodioxinen und -furanen, Toxaphenen und planaren PCB. Auch hier konnten in den meisten Fällen die Akkumulationserscheinungen geklärt und durch Verbote oder Höchstwertre-gelungen erreicht werden, dass die Kontamination der vom Tier stammenden Lebensmittel laufend deutlich zu-rückgeht, was ihren quantitativen Nachweis und die Auswertung der Analysenergebnisse trotz modernster Nach-weisverfahren immer mehr erschwert. Viele der Organochlorverbindungen haben heute als Rückstände bei uns keine Bedeutung mehr. Das gilt z. B. für DDT und seine Metaboliten und eine Reihe von Pestiziden auf Orga-nochlorbasis wie Heptachlor, Aldrin oder auch Lindan.
Der Unfall von Tschernobyl belastete die Umwelt sehr heterogen, aber örtlich ganz erheblich mit künstlichen Radioisotopen, von denen zum Glück über lange Zeiträume nur die Cäsium-Isotope und vor allem das CS-137 Bedeutung besitzen. Aufgrund der physikalischen Eigenschaften des Cäsiums im Boden spielte das Radiocäsium aber auf landwirtschaftlichen Nutzflächen und damit in den dort erzeugten Futter- und Lebensmittel schon ein Jahr nach dem Unfall keine Rolle mehr. Anders sah und sieht noch heute die Situation bei einigen geschlossenen Moor- und Waldökosystemen aus, in denen wahrscheinlich noch viele Jahre lang bei Reh- und besonders beim Schwarzwild erhebliche Kontaminationen weit über dem als Grenzwert benutzten eigentlich von der EU nur für die Einfuhr aus Drittländern definierten Höchstwert von 600Bq/kg frische Muskelmasse liegen. Die Folgen des Unfalls von Tschernobyl sind ein Beispiel, das zeigt, wie kritisch Schadstoff-Immissionen sein und wie lange ökologische Halbwertszeiten sie besitzen können. Die Untersuchungen des Verhaltens des Radiocäsiums in Ökosystemen ließen erkennen, wo letzten Endes der Hauptteil der in die Luft emittierten persistenten Substanzen verblieb und welche Folgen das für das Ökosystem Wald und die dort lebenden Tiere haben kann.