Introduction
Seasoned equity offering (SEO) has been studied in recent literatures on Vietnamese stock market. Many of these articles use event study as an approach to investigate SEO. Previ-ous studies show that the market was not
ef-ficient during SEO in separate years, 2007 and 2010. Thus, in this research, we try to investi -gate whether the timing factors and the market
condition can influence significantly stock price fluctuations during SEO. The favorable period included the years when the main index, VN Index, had positive growths (2007 and 2009)
while the unfavorable period was the years with
negative VN Index returns (2008 and 2010). The data sample covers 322 seasoned equity
offerings of companies listed on the Ho Chi
Minh Stock Exchange (HOSE). This paper is organized as followed: 1) literature review; 2) research method and data; 3) result and discus
-sion; and 4) conclusion.
Literature Review
Research on (SEO) originates from two theories: Capital Asset Pricing Model (CAPM)
and Efficient Market Hypothesis. CAPM fo -cuses on abnormal return compared to expected
return of market. Efficient Market Hypothesis, on the other hand, requires a study on how an
-nounced information transfers into prices, in this case, how the seasoned equity offering in -formation conveys to price. A market is
consid-ered as an efficient market in semi-strong form when the abnormal returns on event date, such as announcement date or ex-right (XR) date,
are likely to be zero.
SEO is every secondary equity issue after the
company’s initial public offering. The issuers could be listed or non-listed. In this article, the issuers are listed companies on HOSE. There
are two important dates in SEO: announcement date and XR date. A majority of recent study
focuses on announcement date. There are still
Ho Chi Minh Market
Ho Viet Tien and Dinh Thi Thu Ha*
University of Economics, Ho Chi Minh City, VietnamThis paper investigated the impact of seasoned equity offerings (SEO) on stock return of listed companies in Ho Chi Minh City market using the method “event study” which has been basically formed by Campbell, Lo, and MacKinlay (1997). The sample includes 332 SEOs from 2007 to 2010.
The main findings show evidence that the Ho Chi Minh City market was not efficient in terms of the semi-strong form because the price has increased significantly on the ex-right date, day 0. In an op
-posite way, the market also reacted significantly negatively from T-4 to T-2. There are some significant impacts of timing on issue methods – equity right issues were in priority for favorable time and issues as “dividend by stocks” were chosen during unfavorable time.
Keywords: Efficient Market Hypothesis, event study, Seasoned Equity Offerings
some research studies which place the
empha-sis on the XR date (Tsangarakis, 1993). XR
date is the day from which current sharehold-ers do not have any right concerning the issue.
For example, a shareholder who own stocks be
-fore XR date can buy the new stocks at a fixed
price lower than market price. Investors buy the stock on the XR date or after have not any right concerning the issue.
There are many methods of issues but we
classify them into two groups:
1) “Equity right issues” (or equity issue by
right distribution) are the issues where cur-rent investors should pay for having new
stocks;
2) “Equity bonuses” or “dividends by stock”
are issues where current shareholders do not
pay anything for having new stocks. That
can be dividend distributions by stock or
splits of current stock (called “bonus” stock
in Vietnamese).
The HOSE has been established and started its transaction on July 28th 2000. It is the most
important stock market in Vietnam, four times as large as the Ha Noi Stock Exchange in terms of market capitalization. The number of listed
companies of HOSE has been increased from
two in the beginning in 2000 to 304 in the end of 2012. Its main index, VN Index is a compos -ite index which is including capitalization of all
stock listed on the exchange. The HOSE still
has typical characteristics of a thin market: high
fluctuation (average volatility – annualized
standard deviation of monthly returns is about
36%/year), low liquidity, and 5% of companies represent more than 70% of the whole market capitalization. The HOSE applies a system of
transaction T+3, which means the investors can receive money only three days after the stock selling.
During the past 30 years, there have been over 565 studies of SEO appeared on famous economic and finance journals (Khotari et al., 2006). These research studies discuss various
aspects of SEO such as: different issue
meth-ods, different underwriting methmeth-ods, and types
of issued securities. Many research concen-trates on determinant factors that have effect on
abnormal return. Those factors can be macro
-economic conditions, security market scenario, financial health of company, different indus
-tries, and many more.
Empirical studies in developed markets found that the reactions of market to SEO are likely to be negative and average abnormal
re-turns on announcement date are about -2% to -3% (Eckbo and Masulis, 1995). Meanwhile re -search on emerging markets presented complex results: some markets reacted negatively while
others have positive responses, which means that the average abnormal returns are signifi
-cantly greater than zero. There are also some
research studies focusing on abnormal returns
of XR date (Marsh, 1979; Tsangarakis, 1993). Although there are various approaches,
the most common method used in SEO study
is Event Study. In recent years, Event Study method has been changed significantly: first,
daily abnormal returns have been used more
frequently than monthly abnormal returns;
second, the time frame of study has been ex -tended to learn about the long-horizon effects of SEO.
Research Method
Event study is a method in examining the changes in asset prices due to an event. In
par-ticular, this method is studying the behavior of
stock prices around the events of the compa-nies.
According to Campbell, Lo, and MacKinlay (1997), the process of event study consists of
steps as followed.
Event definition
It is a period over which the event occurs
(event window). This window usually has one day which means an announcement date,
however if the information is announced at the
time of stock market closing (after 4:00 PM in HOSE for example), the event window will last
Selection criteria
This step is applied for selecting companies
used as the sample of this research.
Normal and abnormal return measurement
According to Brown and Warner (1980), “a security’s price performance can only be considered ‘abnormal’ relative to a particular benchmark. Thus, it is necessary to specify a model generating ‘normal’ returns before ab-normal return can be measured. The abab-normal return for a given security in any time period is
defined as the difference between its actual ex
post return and that which is predicted under the assumed return-generating process”.
There are three commonly used models con -cerning event study:
- Mean adjusted return: the expected return is equal to the average ex-post returns of the security i and that return is constant.
Math-ematically, the abnormal return is defined as: εit=ARit=rit-E(rit)=rit-μi 1) - Market Adjusted Returns: the expected
return is the return of market benchmark which is considered as the market portfolio representative.
εit=AR
it=rit-E(rit)=rit-rm 2) - Market model:
a. Applying the CAPM where the mar-ket return is estimated from the marmar-ket
benchmark (for example: S&P 500 in US stock market, VN Index in Vietnam Stock
market):
εit=ARit=rit-α
i-
Σ
βij fjt 3) Although there are some differences amongthe three approaches, the results are equivalent. Dyckman et al. (1984) showed that the three
models have similar ability to detect the
pres-ence of abnormal performance. Korajczyk et al. (1990) found that “the basic pattern of ab-normal returns around the announcement of equity issues is similar across all methods of calculating abnormal returns” and “the corre-lations are generally high (0.85 – 0.99)” when comparing the results using different methods
(Korajczyk et al., 1990). Based on their results,
we may use one of the three approaches when calculating the abnormal returns of stock.
How-ever, “sometimes limited data availability may dictate the use of a restricted model such as the market-adjusted-return model” (Campbell, Lo,
and Mackinlay, 1997), and “the market adjust-ed return model can be viewadjust-ed as a restrictadjust-ed
market model with αi constrained to be 0 and
βi constrained to be 1. This model is often used to study the underpricing of initial public of-fering (Ritter,1990). A general recommendation is to use such restricted models only as a last resort, and to keep in mind that bias may arise if the restrictions are false” (Campbell, Lo, and
Mackinlay, 1997).
According to “Market Adjusted Return”, the expected return of a security on a specific date is same for all the securities, but it is different for other dates. On the other hand, in “Mean Adjusted Return”, the expected return of a se -curity i equals to a constant, which can differ across securities.
To calculate the abnormal return in the mar
-ket adjusted return method, the expected return
of the stock i on day t equals the return of the market portfolio and measured by benchmark
index (Chen and Chen, 2007). We use this method in our study, so the benchmark index should be VN Index.
The abnormal returns will be defined as:
ARit=Rit-Rmt 5)
where, ARit is abnormal return of stock i on day t; R
it is actual return of stock i on day t; Rmt is market return on day t which is represented by
market benchmark (e.g. VN Index)
The Average abnormal return AAR at t is
de-fined as:
6)
where N refers to the number of issues in the sample.
Consider day t = 0 is the XR date.
The semi-strong form of market efficiency will
be tested as:
If market is efficient, the average of abnor
-mal returns should significant be zero.
The cumulative average abnormal returns
(CAR) are calculated by summing average ab-normal returns in observed period (T):
7)
Estimation procedure
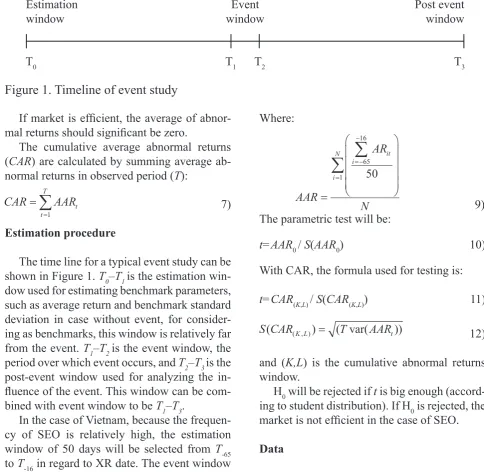
The time line for a typical event study can be shown in Figure 1. T0–T1 is the estimation
win-dow used for estimating benchmark parameters,
such as average return and benchmark standard
deviation in case without event, for consider
-ing as benchmarks, this window is relatively far
from the event. T1–T2 is the event window, the
period over which event occurs, and T
2–T3 is the post-event window used for analyzing the
in-fluence of the event. This window can be com -bined with event window to be T1–T3.
In the case of Vietnam, because the frequen
-cy of SEO is relatively high, the estimation window of 50 days will be selected from T-65 to T-16 in regard to XR date. The event window and post event window will be combined into
30 days, from T-15 to T+14 in which XR date is
T0.
Testing procedure
Assume that stocks of separated companies
are correlated, the standard deviation in estima -tion window will be calculated as:
8)
Where:
9)
The parametric test will be:
t=AAR0 / S(AAR0) 10)
With CAR, the formula used for testing is:
t=CAR
(K,L) / S(CAR(K,L)) 11)
12)
and (K,L) is the cumulative abnormal returns window.
H0 will be rejected if t is big enough (accord-ing to student distribution). If H0 is rejected, the
market is not efficient in the case of SEO.
Data
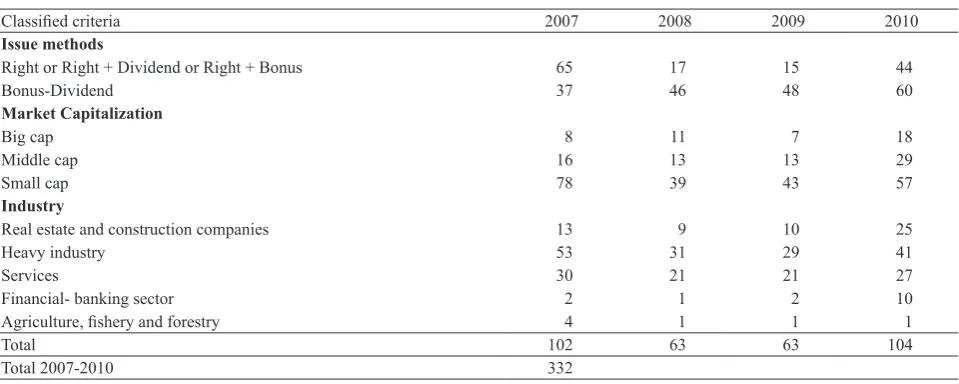
The research covers only companies listed on the HOSE during 2007-2010. The years 2007 and 2009 are representing the period of a favorable market condition with 165 offerings, while 2008 and 2010 are considered as an un
-favorable period of market with 167 offerings. Issuers are classified according to three criteria: market capitalization, issuance method, and in -dustry.
Capitalization value of the company is
di-vided into three groups: companies with big, middle, and small capitalizations based on
standards suggested by Morning Star Corpora-tion. Companies with big market capitalization are the biggest ones whose total stock values
account for 70% of the market capitalization,
middle companies account for the next 20%, and the small ones hold the remaining 10%. The specified results are shown in table 1.
Generally, other research studies choose an
-nouncement dates as event dates. However, in this paper, the event dates are XR dates (XR)
because of following reasons: first, seasoned equity offerings which have been announced are sometimes not implemented as the initial
announcement to shareholders; second, the
event window extending to 15 days before the
XR date includes the announcement date to the
public (95% of announcement dates happen
from T-8 to T-12 in comparison to the XR date,
day 0).
Result and Discussion
Average abnormal return – AAR and
cumu-lative abnormal return – CAR:
Table 2 shows the differences between fa -vorable and unfa-vorable periods. In fa-vorable
years, AAR experienced consecutive increase from T-15 to T-5. The total price increase in this
period was up to +6.3%. The consecutive in
-crease was confirmed by statistic test at the sig
-nificant level of 1% and 5% (except for T-14 and T-13). In the same period, in unfavorable years, prices gained remarkable increases only at T-9
(at a significant level of 10%).
Two to four days before the XR date were
the time to make selling decision when prices
experience significant decrease. During the fa
-vorable period, prices produced greater chang
-es, falling by -1.4% in these 3 days compared to -0.6% in the unfavorable period. The ratio be -tween the number of AR increased to the num-ber of AR decreased produced the same results.
To put it another way, in favorable years, inves -tors are more likely to join the issuance process
and speculate for short-term profits (buy from
T-15 to T-5 and sell from T-4 to T-2). In
unfavora-ble years, the same signs cannot be seen.
On XR date and T+1, stock prices increased
in majority of cases, independently of market conditions. However, in favorable years, pric
-es rose significantly by +3% only in th-ese two
days and were two times higher than the same period in unfavorable years which only gained
+1.3%.
After offerings, in unfavorable period, pric -es fell on T+3 and T+4 while they only decrease remarkably on T+5 and T+6 in favorable years.
In other words, positive reactions of investors
in favorable years last longer than unfavorable ones.
Table 3 indicates CAR in different windows.
The most significant difference was that in fa
-vorable years, CAR tended to be positive and
gained significant levels in most of different windows, except for window [T-3;T-1] and
win-dow [T+3;T+7]. Contrarily, in unfavorable years, prices only increased in windows that lasted to T+5. Whatever the period was favorable or
un-favorable, stock prices adjusted remarkably on
Table 1. SEOs at the HOSE 2007-2010
Classified criteria 2007 2008 2009 2010
Issue methods
Right or Right + Dividend or Right + Bonus 65 17 15 44
Bonus-Dividend 37 46 48 60
Market Capitalization
Big cap 8 11 7 18
Middle cap 16 13 13 29
Small cap 78 39 43 57
Industry
Real estate and construction companies 13 9 10 25
Heavy industry 53 31 29 41
Services 30 21 21 27
Financial- banking sector 2 1 2 10
Agriculture, fishery and forestry 4 1 1 1
Total 102 63 63 104
Total 2007-2010 332
days [T-3;T-1] and [T+3;T+7] which were the win-dows for investors to exit from the market.
Issuance method
Different methods have some significant ef -fects on AAR during favorable time. Table 4
classifies AAR according to issuance method.
In favorable period, investors attempted to buy
shares which were issued as bonus or dividends
so that prices rose nearly 7% during 11 days
from XR date (T-15) to T-5. Effort to purchase eq-uities issued by subscription rights only lasted
in the first week (+3.6% from T-12 to T-8).
The short-term speculation in favorable pe -riod was quite obvious with trading cycle just after the announcement. Investors tried their best to buy stocks in order to have the rights to buy from T-12 to T-8, then sell at any price to avoid issuance procedures from T-3 to T-2
(-1.8%) because the HOSE applies the system
T+3. Regarding to shares issued as bonuses and
dividend distributions, because investors have no rights to transfer their rights, therefore short-term speculation is not so obvious. Tendency to
sell stocks only happened with shares issued as bonuses and dividend distributions in favorable
years (-1.3% from T+5 to T+7) when issuance procedure were completed.
According to the two other classified crite
-ria, capitalization and industry, there were no significant differences between AARs in fa -vorable and unfa-vorable years.
Conclusion
The HOSE market conditions have affected
remarkably seasoned equity offerings. In
fa-vorable years, investors tend to speculate in a short term, “surfing on the stock price waves”
Table 2. AAR during favorable and unfavorable periods
Day Favorable Unfavorable
AAR t(AAR) CAR AR increased/
AR decreased
z(AR increased/
AR decreased) AAR t(AAR) CAR
AR increased/ AR decreased
z(AR increased/ AR decreased)
-15 0.006 2.653*** 0.006 94/71 1.791 0.002 0.874 0.002 73/90 -1.332 -14 0.003 1.619 0.009 86/79 0.545 0.001 0.423 0.002 69/94 -1.958* -13 0.002 0.600 0.010 83/82 0.078 -0.001 -0.451 0.001 72/91 -1.488 -12 0.005 2.474** 0.015 87/78 0.701 -0.003 -1.606 -0.001 67/97 -2.342** -11 0.006 2.953*** 0.022 98/67 2.413** 0.000 -0.219 -0.002 75/90 -1.168 -10 0.006 2.694*** 0.027 91/74 1.323 0.002 1.178 0.000 81/85 -0.310 -9 0.008 4.002*** 0.035 96/69 2.102** 0.003 1.841* 0.004 88/78 0.776 -8 0.007 3.300*** 0.042 92/73 1.479 0.002 0.925 0.005 74/92 -1.397 -7 0.004 1.969* 0.046 88/77 0.856 0.002 1.335 0.008 87/79 0.621 -6 0.009 4.230*** 0.055 96/69 2.102 0.002 0.892 0.009 70/96 -2.018** -5 0.007 3.228*** 0.063 94/71 1.791 0.002 1.178 0.011 80/86 -0.466 -4 -0.001 -0.665 0.062 82/83 -0.078 0.003 1.68* 0.014 80/86 -0.466 -3 -0.008 -3.749*** 0.054 63/102 -3.036*** -0.002 -1.042 0.012 73/94 -1.625 -2 -0.005 -2.473** 0.049 64/101 -2.880*** -0.003 -1.685* 0.009 68/99 -2.399** -1 0.000 0.024 0.049 77/88 -0.856 -0.001 -0.728 0.008 71/96 -1.935*
0 0.022 10.843*** 0.071 123/42 6.306*** 0.009 5.058*** 0.017 95/72 1.779* 1 0.008 3.751*** 0.079 97/68 2.258** 0.004 2.003** 0.020 88/79 0.696 2 0.002 0.763 0.081 87/78 0.701 0.001 0.545 0.021 78/89 -0.851 3 -0.002 -1.262 0.079 70/95 -1.946** -0.002 -1.205 0.019 69/98 -2.244** 4 0.001 0.117 0.080 80/85 -0.389 -0.005 -2.655*** 0.015 68/99 -2.398** 5 -0.002 -1.035 0.078 65/100 -2.725*** 0.003 1.565 0.017 83/84 -0.077 6 -0.006 -2.796*** 0.072 54/111 -4.437*** -0.002 -1.130 0.015 70/97 -2.089** 7 -0.002 -0.982 0.070 71/94 -1.791* 0.000 0.203 0.016 78/89 -0.851 8 0.004 1.613 0.074 86/79 0.545 0.001 0.595 0.017 79/88 -0.696 9 0.001 0.780 0.075 80/85 -0.389 -0.001 -0.554 0.016 72/95 -1.780* 10 -0.003 -1.285 0.072 68/97 -2.258** 0.000 -0.039 0.016 69/98 -2.244** 11 -0.002 -0.782 0.070 67/98 -2.413** 0.000 0.054 0.016 72/95 -1.780* 12 0.000 -0.066 0.070 74/91 -1.323 0.000 -0.163 0.016 79/88 -0.696 13 0.001 0.629 0.071 81/84 -0.234 -0.003 -1.619 0.013 75/92 -1.315 14 0.001 0.561 0.072 79/86 -0.545 0.000 0.157 0.013 74/93 -1.470 Source: data from HOSE and SSC, and authors’ calculations
when companies issue shares, especially by subscription rights. They buy when the infor
-mation of issuing has just been announced, making prices increase during the first week
after announcements and then sell two to three
days before the XR date, inducing prices to
decrease remarkably four to two days before the XR date. Investors also tend to buy stocks which are issued as bonus or dividend distribu-tions in the favorable period and just sell after
Table 3. CAR during favorable and unfavorable periods
Window Favorable Unfavorable
CAR t(test) CAR t(test)
[ -12;-2 ] 0.039 5.666*** 0.008 1.353 [ -5;0 ] 0.016 3.106*** 0.008 1.825* [ -2;+2 ] 0.027 5.803*** 0.009 2.323**
[ -1;+1 ] 0.030 8.371*** 0.011 3.657***
[ 0;+1 ] 0.030 10.268*** 0.012 4.993***
[ 0;+2 ] 0.032 8.9249*** 0.013 4.391***
[ 0;+5 ] 0.028 5.588*** 0.009 2.168** [ 0;+8 ] 0.025 3.968*** 0.009 1.659 [ 0;+11 ] 0.021 2.949*** 0.008 1.282
[ -15;-4 ] 0.062 8.627*** 0.014 2.327**
[+3;+13] -0.010 -1.445 -0.009 -1.492 [ -3;-1 ] -0.013 -3.562*** -0.006 -1.995* [ +3;+7 ] -0.011 -2.370*** -0.006 -1.441 Source: data from HOSE and SSC, and authors’ calculations
Notes: ***, **, * represent statistically significant levels of 1%, 5%, and 10% respectively.
Table 4. AAR by method
Day Subscription right Bonus-dividend
Favorable Unfavorable Favorable Unfavorable
-15 0.003 0.007*** 0.007*** -0.001
-14 0.004* 0.003* 0.002 0.000
-13 0.004* -0.004** -0.001 0.001
-12 0.006*** -0.005*** 0.005** -0.001 -11 0.008*** -0.001 0.005** 0.000
-10 0.007*** -0.003 0.004* 0.005***
-9 0.010*** 0.003* 0.006*** 0.003*
-8 0.005** 0.003 0.008*** 0.001
-7 0.002 -0.002 0.006*** 0.005***
-6 0.003 0.000 0.015*** 0.002
-5 0.003 0.001 0.011*** 0.003
-4 0.001 0.000 -0.002 0.005**
-3 -0.010*** -0.006*** -0.006*** 0.001
-2 -0.008*** -0.009*** -0.002 0.000
-1 0.001 -0.005*** -0.001 0.001
0 0.033*** 0.014*** 0.012*** 0.006***
1 0.010*** 0.008*** 0.003 0.001
2 0.004* 0.008*** 0.000 -0.003*
3 -0.003 -0.001 -0.001 -0.003
4 0.003 -0.004** -0.002 -0.005***
5 0.000 0.005*** -0.004** 0.001
6 -0.005*** -0.002 -0.006*** -0.002
7 0.000 0.001 -0.003* 0.000
8 0.003 0.003 0.004** 0.000
9 0.002 -0.001 0.001 -0.001
10 -0.005** 0.000 -0.002 0.000
11 0.001 0.001 -0.004* -0.001
12 0.003 0.001 -0.003 -0.001
13 0.003 -0.007*** 0.000 0.000
14 0.003 -0.002 -0.001 0.001
Source: data from HOSE and SSC, and authors’ calculations
all the procurements have been done (six to seven days after XR date).
The results of this study are supported by the
research on Malaysia market by Salamudin et
al. (1999). According to their research, during
the window [T-60;T+20] prices increased signifi
-cantly (+15%) if the stocks were issued in fa
-vorable years and decreased by -0.5% (not sig
-nificant at any level) in the unfavorable period.
Table 5. CAR by method in favorable and unfavorable periods
Window
Subscription right Bonus-dividend
Favorable Unfavorable Favorable Unfavorable
[-15;-1] 0.039*** -0.017** 0.059*** 0.022***
[-4;-2] -0.017*** -0.014 -0.010*** 0.005*
[0;+14] 0.051*** 0.024 -0.006 -0.007
Source: data from HoSE and SSC, and authors’ calculations
Notes: ***, **, * represent statistically significant levels of 1%, 5%, and 10% respectively.
References
Brown, S.J. and Warner, J.B. (1980), Measuring Security Price Performance, Journal of Financial Economics, 8, 205-258.
Campbell, J., Lo, A., and MacKinlay, A.C.
(1997), The Econometrics of Financial
Markets, New Jersey: Princeton University Press.
Chen, C. and Chen, X. (2007), The Information Content of Rights Offerings in China, Research in International Business and
Finance, 21, 414-427.
Eckbo, B.E. and Masulis, R.W. (1995), Seasoned Equity Offerings: A Survey, to appear in Jarrow, R., Maksimovic, V., and Ziemba, W.T. (Eds.), Finance (North-Holland, Series of Handbooks in Operations Research and Management Science).
Fama, E. (1991), Efficient Capital Market: II,
Journal of Finance, 46, 1575-1617.
Fama, E., Fisher, L., Jensen, M., and Roll, R. (1969), The Adjustment of Stock Prices to New Information, International Economic
Review, 10, 1-21.
Korajcyzk, R.A., Lucas, D., and McDonald,
R.L. (1990), Understanding Stock Price Behavior around the Time of Equity Issues, in Hubbard, R.G. (Ed.), Asymmetric
Information, Corporate Finance and Investment, Chicago: University of Chicago
Press.
Masulis, R.W., Korwar, and Ashok, N. (1986),
Seasoned Equity Offerings: An Empirical
Investigation, Journal of Financial
Economics, 15, 91-118.
Ritter, J. (1990), Long Run Performance of Initial Public Offering, Journal of Finance.
Salamudin, N., Ariff, M., and Nassir, A.Md. (1999), Economic Influence on Rights Issue Announcement Behavior in Malaysia, Pacific-Basin Finance Journal 7, 405–427. Serra, A. P. (2002), Event Study Tests: a Brief
Survey, Working Paper da FEP, No. 117,
May 2002, at http://www.fep.up.pt.
Tsangarakis, N.V.(1993), Seasoned Equity Issues in the Greek Stock Market, Stock Price Reaction on the Ex-Rights Date: A Test of Semi-Strong Form Market Efficiency,