ANALYSIS OF THE INFLUANCE OF DEBT EQUITY RATIO AND RETURN ON EQUITY TOWARDS STOCK RETURN AND VALUE OF THE COMPANY AS A
MODERATING VARIABLE
(Empirical Study On Food and Baverages Companies Listed in Indonesia Stock Exchange for The Period 2011-2013)
TEXT PUBLICATION
Asked To Meet Tasks and Requirements To Obtain a Bachelor of Economics Department Accounting of Faculty Economics and Business, Muhammadiyah University of Surakarta
Compiled by:
NUR ANDINI ARUM SARI B200112003
FACULTY ECONOMICS AND BUSINESS MUHAMMADIYAH UNIVERSITY OF SURAKARTA
iii
ANALYSIS OF THE INFLUANCE OF DEBT EQUITY RATIO AND RETURN ON EQUITY TOWARDS STOCK RETURN AND VALUE OF THE COMPANY AS A
MODERATING VARIABLE
(Empirical Study On Food and Baverages Companies Listed in Indonesia Stock Exchange for The Period 2011-2013)
NUR ANDINI ARUM SARI B200112003
Accounting Studies Program Faculty of Economics and Business Muhammadiyah University of Surakarta
Email: [email protected] ABSTRACT
The purpose of this research is to analysis of the influance of Debt to Equity Ratio and Return On Equity towards return stock with the value of the company as a moderating variable on food and baverages companies listed in Indonesia Stock Exchange for the period 2011-2013.
The sampling technique used in this research is purposive sampling with criteria as: (1) Consistent incorporated in food and baverages shares in Indonesia Stock Exchange 2011-2013. (2) Always appear annual financial statements during the period 2010-2013. (3) The availability and completeness of data during the research. The necessary data in this research is drawn from the financial statements of 2010-2013 acquired 49 companies sampled. This research uses data analysis techniques to test hypotheses such as t test, F test and R test with kindness test model as well as the classic assumption test in advance using SPSS 17.0
The results of this research are Debt to Equity Ratio (DER) and Return On Equity (ROE) have statistically significant influance on stock returns, while the Price Earning Ratio (PER) is not proven statistically significant as moderating variable in influencing DER and ROE on stock returns.
1 INTRODUCTION
A. Background Of The Research
Return is the rate advantage enjoyed by investors on an investment is doing. Without the level of benefits enjoyed from an investment, of course, investors will not invest. DER reflects the company's ability to meet all obligations indicated by how much of their own capital is used to pay the debt. DER show about the balance between the burden of debt than equity capital.
DER also provide a guarantee on how much debt the company's own capital guaranteed. Return on equity (ROE) is a measure of the ability of companies (listed companies) in making a profit by using their own capital, so that the ROE is often referred to as the profitability of its own capital. ROE is a profitability ratio that can be used to measure how effective equity given by investors and is managed by the management to operating profit. In this study, a proxy is used to measure the value of the company is proxied by price. The selected ratio is Price Earning Ratio (PER). PER shows the ratio of stock price to earnings. This ratio indicates how much investors assess the price of shares on a multiple of earnings. This study examines the food and baverages companies listed on the Indonesian Stock Exchange. The reason the researchers chose food and baverages company as research object because the company is a food and baverages stocks actively traded in the Indonesia Stock Exchange. This study takes the research period of 2011 - 2013 because it has more recent data, so the results of this study are considered to represent all food and baverages companies listed on the Indonesian Stock Exchange (BEI) until 2013.
Based on this background, the researcher are interested in doing research with the title "ANALYSIS OF THE INFLUANCE OF DEBT EQUITY RATIO AND RETURN ON EQUITY TOWARDS STOCK RETURN WITH VALUE OF THE COMPANY AS A MODERATING VARIABLE".
B. Formulation Of The Problem
Based on the background of the problems that have been described, then the problem will be examined in this study are:
1. Does the Debt To Equity Ratio (DER) influance on stock return on Food and baverages company listed on the Indonesia Stock Exchange?
2. Does the Return On Equity (ROE) influance on stock return on Food and baverages company listed on the Indonesia Stock Exchange?
3. Does the Value of the company moderate the relationship between Debt To Equity Ratio (DER) with stock returns in Food and baverages company listed on the Indonesia Stock Exchange?
2 C. Research Purposes
The purpose of this study are as follows:
1. To test and to analyze the influence of Debt To Equity Ratio (DER) to stock return at company Food and baverages listed on the Indonesia Stock Exchange.
2. To test and to analyze the influence of Return On Equity (ROE) to stock return at company Food and baverages listed on the Indonesia Stock Exchange.
3. To test and to analyze the Company Value in moderating the relationship between Debt To Equity Ratio (DER) with stock returns in Food and baverages company listed on the Indonesia Stock Exchange.
4. To test and to analyze the Company Value in moderating the relationship between Return On Equity (ROE) with stock returns in Food and baverages company listed on Indonesia Stock Exchange.
LITERATURE REVIEW A. Signal Theory
Signal theory explains how the investors have the same information about the company's prospects as a manager of this company called asymmetric information. According to the theory of signal activity of the company provide information to investors about the prospects for substantial future returns. Information as a signal that the management announced to the public that the company has good prospects in the future. According Husnan and Pudjiastuti (2003) market response to the company is thus highly dependent on the signal issued by the company.
B. Fundamental Analysis
Fundamental analysis is the study of economics, industry, and the condition of the company to take into account the value of the company. Fundamental analysis focuses on the key data in the financial statements to take into account whether the stock price has appreciated accurately. The purpose of fundamental analysis is to determine whether the value of the shares are in a position underpriced or overpriced. Fundamental analysis is based on the belief that the value of a stock is heavily influenced by the performance of the company that issued these shares (Murtanto and Harkivent, 2000).
C. Financial Ratio Analysis
According to Ang (1997) in Kurnianto (2013), financial ratios grouped into five types based on the scope or objectives to be achieved:
1. Liquidity Ratios
3 2. Activity Ratios
This ratio indicates the company's ability and efficiency in utilizing its treasures. The ratio of this activity consists of: Total Asset Turn Over, Fixed Asset Turnover, Accounts Receivable Turnover, Inventory Turnover, Average Collection Period, Day's Sales In Inventory.
3. Profitability Ratios
Profitability Ratios / Profitability shows the success of the company in generating profits. This ratio is composed of: Gross Profit Margin (GPM), Net Profit Margin (NPM), Operating Return on Assets (OPROA), Return on Assets (ROA), Return on Equity (ROE), Operating Ratio (OPR).
4. Solvency Ratios
Solvency ratio shows the company's ability to meet its long-term obligations. Solvency ratio is also called the Leverage Ratios. This ratio is composed of: Debt Ratio, Debt To Equity Ratio (DER), Long-Term Debt To Equity Ratio, Time Interest Earned, Cash Flow Ratio.
5. Market Ratios
Market Ratios showed important company information disclosed in a per share basis. This ratio is composed of: Dividend Yield (DY), Dividend Pershare (DPS), Earning Per Share (EPS), Per Dividend Payout Ratio (DPR), Price Earning Ratio (PER), Book Value Per Share (BVS), Price To Book Value (PBV).
D. Debt to Equity Ratio (DER)
According to Horne and Wachowicz (in Suharli, 2005) "Debt to Equity Ratio is computed by simply dividing the total debt of the firm (including current liabilities) by its shareholders' equity". Debt to equity ratio is a simple calculation that compares the total debt of the company with shareholder capital. It can be concluded that the DER is a ratio that compares the total debt to total equity from shareholders.DER shows the company's ability to meet its obligations in total, of which equity capital used to pay debts. DER also provide assurance how much debt the company's own capital guaranteed.
Debt to Equity Ratio =
E. Return On Equity (ROE)
Return On Equity is one of the ratios that can be used to measure the company's ability to generate net income based on certain capital. The magnitude of this ratio shows the profitability measure from the perspective of shareholders. While Brigham and Weston (1998) stated that the ROE is a ratio used to measure the rate of return on investment by ordinary shareholders. ROE ratio can be calculated as follows:
4 F. Stock Return
According to Fahmi and Hadi (2009), the return is the profit earned by the companies, individuals and institutions of the results of its investments policy. Meanwhile, according to Hartono (2009), the return is the result obtained from the investment. Return can be either return realisasian (Realized return) or the expected return (expected return. Realisasian return is the return that has occurred is calculated using historical data. Return realisasian important because it is used as one measure of the performance of the company and is also used as the basis for determining the expected returns and future risks. realisasian return multiple measurements are widely used is total return, relative return, cumulative adjusted return and return. Return is the expected return is expected to be acquired by investors in the future. Return the expected can be measured by several methods, namely based on the expected value the future, the value of historical returns and the expected returns of existing models. Return the stock can be calculated using the formula:
Pi: I share closing price at the time to t Pi-t: I share closing price at the time to t-1
According to Usman (2004), the return component is composed of two types: current income (current income), and Capital Gain (gain difference in price). Current income is a benefit that is gained through payment periods such as: the payment of interest on deposits, bond interest, dividends and so forth. Current income is referred to as current income, since the profit received usually in the form of cash, so it can be cashed quickly, such as flowers or current accounts, cash dividends, may also be in the form of a bonus or cash equivalents such as stock dividends are dividends paid in the form of shares and can be converted into cash. The second component of the return is the capital gain, the profit received due to the difference between the selling price and the purchase price of the shares of any investment instrument. Capital gain is highly dependent on the market price of an investment instrument, which means that the investment instruments to be traded on the market. With the trade will give rise to changes in the value of an investment instrument that gives captal gain. The amount of capital gains made by the analysis of historical returns that occurred in the previous period, so it can be determined the magnitude of the rate of return (expected return).
G. Contingency Theory
5
between the two. Steps taken to resolve the differences in the results of these studies can be completed with contingency approach.
Through a contingency approach allows to evaluate other variables that may affect the relationship between DER and ROE to return stock with a price earning ratio as moderating or intervening variables which will give effect to be strong and clear.
Moderating variables are variables that affect the relationship between the two variables and the variables that have the type strengthen or weaken the relationship between the dependent and independent variables. Moderating variables have an influence on the nature or direction of the relationship between variables. The nature or direction of the relationship between these variables allows positive or negative, in accordance with the variable moderatingnya. While the intervening variable is the variable that is influenced by a variable or affect other variables, and other variables is a variable that is located between the independent and dependent variables, so that the independent variables into variables that do not directly affect the dependent variable Sari (2015).
In the context of this study will use one of the variables contained in the contingency theory is moderating variables. Moderating variables used in this study are PER to see its effect on the relationship between DER and ROE with the value of the stock return. PER shows the ratio of stock price to earnings. This ratio indicates how much investors assess the price of shares on a multiple of earnings, Hartono (2010: 146). Generally it is said that a low PER indicates that the stock price is cheap, so it deserves to be bought, Kurnianto (2011). However, there are times when investors are still buying stocks that have a high PER if investors believe in the potential development of a few years later (Cahyono, 2000).
H. Company Value
The value of the company in some of the literature that is calculated based on the share price referred to by several terms of which: Price to Book Value (PBV), Market to Book Value (MBV), Market to Book Assets Ratio (MBA), Market Value of Equity (MVE) Enterprise Value (EV).
Price Earnings Ratio (PER) that the price paid by the buyer is willing if the company is sold. PER can be formulated as PER = Price per Share / Earnings per Share. According Tandelilin (2001) in Sari (2005) that the PER approach is a more popular approach used in the analysis of stock and practitioners. PER approach called multiplier approach in which investors will count how many times the value of earnings is reflected in the stock price.
6
Price Earning Ratio = (Price Per Share) / (Earnings Per Share (EPS))
RESEARCH METHODS
A. Variable Operational Definition 1. Dependent variable
According Indriantoro and Supomo (2002) is the dependent variable (the dependent variable) is a variable which is described / influenced by the independent variable (independent variable). In this study, the dependent variable is the stock return.
a. Stock Return
Is the profit / benefits enjoyed by investors over its investments in a particular company. Stock return is the result of investment securities (shares) in the form of capital gain (loss) is the difference between the current share price (closing price at period t) with the previous period stock price (closing price at period t-1) divided by the stock price period previous (closing price at period t-1). Here's how to calculate the return stock (Jogiyanto, 2000):
Stock Return formula = (Pt- (Pt-1)) / (Pt-1) 2. Variables (independent variables)
The meaning of the independent variables are variables that explain other variables (Indriantoro and Supomo, 2002). In this study, using two independent variables DER and ROE, namely:
a. Debt to Equity Ratio (DER).
DER in this study is used as a tool to measure the company's ability to meet its long-term liabilities based on the comparison between all liabilities (debts) with its own capital owned by the issuer / companies. This ratio can systematically formulated as follows:
Debt to Equity Ratio = (Total debt) / (Total Equity)
According to Robert Ang (1997) Total debt is the total short-term debt and total long-term debt. Whereas total equity is total equity capital consisting of total paid-up share capital and retained earnings of the company.
b. Return On Equity (ROE)
ROE is a tool used to measure the company's ability to generate the level of return the company (the effectiveness of the company) and make a profit by using the equity held by the company. This ratio can be determined by:
Return On Equity = (Net Income) / (Total Equity)
7 3. Moderating variables
Moderating variables are variables that can strengthen or weaken the direct relationship between the dependent and independent variables. Moderating variable in this research is Price Earning Ratio (PER).
Price Earnings Ratio = (Price Per Share) / (Earnings Per Share (EPS))
B. Types and Sources of Data 1. Secondary Data
The data used is secondary data, ie data obtained indirectly or through an intermediary medium. Such data are quantitative, concerning the annual financial statements and the closing share price (closing price) of each company obtained from the share price at year-end period. The source of the data in this study was obtained from the Indonesia Stock Exchange (www.idx.co.id) and Capital Market Directory (ICMD). Meanwhile, according to the classification collected, the data used is a time series (time series data).
The data used in this study relates to the fundamental data of companies including stock returns and data relating to financial ratios. More data used are as follows:
a. Data Debt To Equity Ratio (DER) during the observation period of one year from the year 2011 to 2013.
b. Data Return On Equity (ROE) during the observation period of one year from the year 2011 to 2013.
c. Data Price Earning Ratio (PER) during the observation period of one year from the year 2011 to 2013.
2. Data Source
The data used in this research is quantitative data, so that data needed to support this research is secondary data, data that already exists and does not need to be collected by researcher. Data from the financial statements www.idx.co.id and Indonesia Capital Market Directory (ICMD).
C. Subject Research
Subjects of this study is quantitative research to test the hypothesis. The data used is secondary data to see annual reports the companies that are members of the Food and Beverages shares in the Indonesian Stock Exchange (BEI). The research data obtained from food and baverages stock company during 2011 through 2013.
1. Population
8 2. Samples
The sample selection using purposive sampling technique is sampling technique with particular consideration (Sugiyono, 2007). Criteria for determining the sample are as follows:
a. Companies that consistently incorporated in Food and Beverages stock as the most active shares in the Indonesian Stock Exchange (BEI) in the period 2011 to 2013. b. The Company publishes annual financial statements of the period December 31, 2010
until December 31, 2013.
c. Availability and completeness of data during the study. If there are companies that can not be calculated the ratio, it will be removed.
d. Banking companies not included in the sample because of the differences in the calculation of the ratio.
Based on the above sampling criteria, the number of samples that meet the criteria to be used as a sample of 49 companies.
D. Data Collection Technique
Methods of data collection for the purposes of this study conducted by the method of documentation. Data collection begins with preliminary research phase ie the study of literature by studying books and other readings related to the subject of this study. Moreover, at this stage is also necessary to study the data required, namely regarding the type of data required, the availability of data, how to obtain data, and picture data processing means. Next is the stage of basic research is used to gather all the data needed to answer the question of research and enrich the literature to support the quantitative data obtained.
Methods of data collection in this study is documentation that is by collecting documents related to the ratio that has been published in the Indonesia Stock Exchange.
E. Data Analysis Technique 1. Classic Assumption Testing
This research uses multiple linear regression testing and engineering Moderated Regression Analysis (MRA). Multiple linear regression can be done after the model of research eligible escaped from the classical assumptions. The requisite data should be normally distributed, contains no heteroscedasticity, autocorrelation and multicollinearity.
DATA ANALYSIS AND DISCUSSION A. Object Description Research
9
Based on the sampling criteria that have been determined by researchers derived food and baverages 18 companies listed on the Indonesian Stock Exchange (BEI). The table below presents the determination of the sample is based on predefined criteria.
Table 4.1
Determination of Total Sample
Populasi sebanyak 20
Yang tidak mempublikasikan (2)
18 Yang laporannya tidak lengkap (DER,ROE,PER) (0)
Total sampel pertahun 18
Based on predetermined criteria the author has obtained a total of 18 samples of the GCC meet the criteria. Of the 18 samples multiplied by three years so the sample in this study were 54 and in outlayer much as 5 samples so that the sample in this study as many as 49 samples.
B. Descriptive statistics
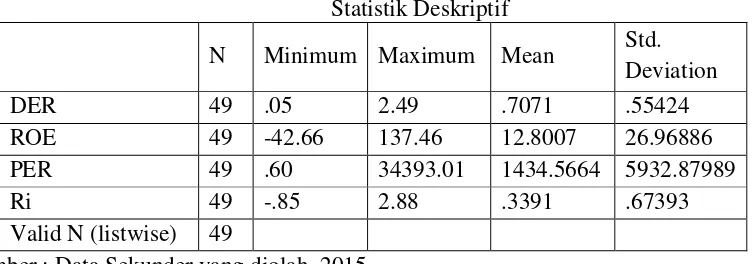
[image:12.595.88.464.457.589.2]Descriptive statistics is a statistical test that is used to describe umun research data. Descriptive statistical tests in the study include minimum value, maximum value, average, and standard deviation. The following descriptive statistics test results can be seen in the attachment and briefly shown in table 4.2 as follows:
Tabel 4.2 Statistik Deskriptif
N Minimum Maximum Mean Std. Deviation
DER 49 .05 2.49 .7071 .55424
ROE 49 -42.66 137.46 12.8007 26.96886 PER 49 .60 34393.01 1434.5664 5932.87989
Ri 49 -.85 2.88 .3391 .67393
Valid N (listwise) 49
Sumber : Data Sekunder yang diolah, 2015
Descriptive statistics of 49 samples used in this study are:
1. Data obtained that DER has a minimum value of 0.05, the maximum value of 2.49, the mean value of 0.7071, and with a standard deviation of 0.55424.
2. Data obtained that ROE has a minimum value of -42.66, the maximum value of 137.46, the mean value of 12.8007, and with a standard deviation of 26.96886.
10
4. Return Shares have a minimum value of -0.85, the maximum value of 2.88, the mean value of 0.3391, and with a standard deviation of 0.67393.
C. Data Analysis
1. Classic Assumption Testing
Regression model in this study can be used to estimate the significant and representative if the regression model does not deviate from the basic assumptions of the classical regression form of normality, multicollinearity, autocorrelation, heteroscedasticity.
a. Normality Test
Based on the results of normality with the Kolmogorov-Smirnov test was 1.219 and the value is above a probability value of 0.05. This means that the null hypothesis is accepted or residual variable αhas normal distribution because the probability value is greater than (0.05).
b. Test Multicollinearity
From the table can be seen that all the independent variables that have a tolerance of more than 0.1 (> 0.1), which means there is no correlation between variables. VIF value calculation result is less than 10 (<10). So it can be concluded that there are no symptoms of multicollinearity in the regression.
c. Test Heteroskidastity
Based on the results table above it is known that none of the independent variables are statistically significant influence absolute residual value. This can be seen from the probability of its significance above 5 percent level of confidence. So we can conclude the regression model did not contain any heteroscedasticity.
d. Test Autocorrelation
The result table by using the degree of error (α) = 5%. Two predictors of the upper limit (U) is equal to 1.62 being the lower limit (L) is equal to 1.46 because the value DW regression result amounted to 2,422 that means more than the lower limit value, then coefisient autocorrelation is greater than zero. It can be concluded that the regression results free from autocorrelation. In other words, the hypothesis that there is no problem of autocorrelation can be accepted, while the null hypothesis that there is autocorrelation can be rejected.
D. Hypothesis Testing
1. Results of Multiple Linear Regression Analysis
11
moderating variable multiple linear regression model. The test results of multiple linear regression with SPSS for Windows version 17 is obtained as follows:
Ri = 0.121 + 0.489 (DER) - 0.019 (ROE) + 8.150 (PER) - 2.899 (DER * PER) + 4.168 (ROE * PER) + e
From the above equation can be interpreted as follows:
a) Constant value is positive 0,121. This shows that if the variable DER, ROE, PER, DER*PER, ROE*PER constant, so the changes of the stock return is 0.121.
b) The value of the variable regression DER is positive 0.489. This shows that the DER has a positive influance toward stock returns. This means that DER increases 1%, so the change on stock returns will increase for 0.489. Conversely, if DER decreases 1%, the change on stock return will decrease for 0.489.
c) The value of the variable regression ROE is negative -0.019. This shows that the ROE has a negative influance toward stock returns. This means that ROE increases 1%, so the change on stock return will decrease 0.019. Conversely, if ROE decreases 1%, the change on stock return will increase 0.019.
d) The value of the variable regression PER is positive 8.150. This shows that PER has a positive influance toward stock returns. This means that PER increases 1%, so the change on stock return will increase 8,150. Conversely, if PER decreases 1%, the change on stock return will decrease 8,150.
e) The value of the variable regression DER*PER is negative -2.899. This shows that DER*PER has a negative influance toward stock returns. This means that DER*PER increases 1%, so the change on stock return will decrease 2,899. Conversely, if DER*PER is decrease 1%, the change on stock return will increase 2.899.
f) The value of the variable regression ROE*PER is positive 4.168. This shows that ROE*PER has a positive influance toward stock returns. This means that ROE*PER increases 1%, so the change on stock returns will increase 4.168. Conversely, if ROE*PER decrease 1%, the change on stock return will decrease 4.168.
E. Accuracy Test Model
1. The coefficient of determination (R2)
Based on the results of data analysis using SPSS for windows then obtained Adjusted R square (R2) of 0.191 or 19.1%. This shows that variation of the profit can be explained by the variable financial ratios of DER, ROE, PER, DER*PER PER, ROE*PER of 19.1%, while the rest is explained 80.9% influenced by other factors outside variables studied.
2. Statistic F test
12 3. Statistics t test
a. Test results of t test about influance DER toward stock returns
From the results of regression is known that the magnitude of the variable tcount DER of 2.537 while the amount ttabel with a confidence level of = 0.05) was 2,000, because tcount α 95% or (> t table with p <0.05 then Ho is rejected (accept Ha), which means DER statistically significant effect on stock returns.
b. ROE
From the results of regression is known that the magnitude of tcount ROE of =α-3.036 while the amount ttabel with a confidence level of 95% or ( 0.05) was 2,000, because tcount> t table with p <0.05 then Ho is rejected (accept Ha), which means ROE statistically significant effect on stock returns.
c. PER
From the results of regression is known that the magnitude of the variable tcount PER of 0.742 while the amount ttabel with a confidence level of = 0.05) was 2,000, because t count α 95% or ( <t table with p> 0.05 then Ho is accepted (refuse Ha), which PER statistically significant mean no effect on stock returns.
d. PER * DER
From the results of regression is known that the magnitude of the variable tcount PER * DER of -0.167 while the amount ttabel with a confidence = 0.05) was 2,000, because t count α level of 95% or ( <t table with p> 0.05 then Ho is accepted (reject Ha ), which means statistically significant PER does not affect the relationship between DER on stock returns.
e. PER * ROE
From the results of regression is known that the magnitude of the variable tcount PER * ROE amounted to 0.106 while the amount ttabel with a = 0.05) was 2,000, because t countαconfidence level of 95% or ( <t table with p> 0.05 then Ho is accepted (reject Ha) , which means statistically significant PER does not affect the relationship between ROE on stock returns.
F. Discussion of Results
1. Influance of Debt to Equity Ratio (DER) and Return On Equity (ROE) toward Stock Return
13
company's own capital. This condition causes the possibility of the development of the company in the future which leads to increased stock returns.
The Return On Equity is a measure of profitability, which the shareholders in general would like to know the level of profitability of the share capital and profits that they have planted back in the form of profit planted. If the company's shares are traded on the stock exchange, the level of return on equity will affect the level of demand for these shares on the stock exchange and its selling price.
2. The value of the company (PER) moderate the relationship between Debt to Equity Ratio’s (DER) and Return On Equity (ROE) influance toward Stock Return
PER does not moderate the relationship between DER and ROE toward stock returns. That is, the Price Earning Ratio (PER), which acts as a moderating variable can not be used as a benchmark in the relationship between DER on stock returns. This is due to PER indicates the ratio between the share price per share prevailing in the capital market but not with the level of net profit available to shareholders. The stock price per share does not affect the company's obligation to return stock. PER is not an indicator of market confidence in the company. The value of PER is sometimes associated with ratios that are often used in companies such as profitability, liquidity, and solvency. Satisfaction invest for one does not affect the return stock or securities.
The Price Earning Ratio (PER), which acts as a moderating variable can not be used as a benchmark in the relationship between return on equity on stock returns. This is due not PER is a ratio that shows how much investors assess the return of the shares to a multiple of earnings. Investors are not looking at the higher price earning ratio, the higher the stock return. Advantages of investing is not determined by PER. There are times when investors are still buying stocks that have a high PER if investors believe in the potential development of a few years later (Cahyono, 2000). So it is said that the PER does not affect the decisions of investors who want to invest.
CLOSING
A. Limitations Research
In the implementation of this study course there are limitations experienced, but it is expected this limitation does not reduce the benefits to be achieved. These limitations include:
1. This study was limited to the use and selection of samples with multiple criteria that only companies manufacturing food and beverage only.
2. The study was limited in observation for three years ie 2011 – 2013 B. Suggestion
14
1. Selection of the sample should use all kinds of companies listed on the Indonesia Stock Exchange, so that samples can be used to represent all of the characteristics in the population.
2. For the next researcher can adds more years peiod, so better research.
DAFTAR PUSTAKA
Ghozali, Imam. (2009). Aplikasi Analisis Multivariate dengan SPSS. UNDIP. Semarang.
Ghozali, Imam. (2011). Ekonometrika Teori Konsep dan Aplikasi dengan SPSS 17. Cetakan Kedua. Badan Penerbit UNDIP. Semarang.
Hanafi, M. Mahmud dan Abdul Halim. (2006). Analisis Laporan Keuangan. UPP AMP YKPN. Yogyakarta.
Harjito, D. Agus dan Rangga Aryayoga. (2009). Analisis Pengaruh Kinerja Keuangan dan
Return Sahamdi Bursa Efek Indonesia.Fenomena, Hal. 13‐21, Vol. 7, No. 1, ISSN
1693‐4296
Harjono Sunardi. (2010). Pengaruh Penilaian Kinerja dengan ROI dan EVA terhadap Return Saham pada Perusahaan yang Tergabung dalam Indeks LQ 45 di Bursa Efek Indonesia. Jurnal Akuntansi, Vol.2 No.1 Hal: 70-92
Hermi, Ary Kurniawan. (2011).Pengaruh Kinerja Keuangan Terhadap Return Saham pada Perusahaan Manufaktur yang Terdaftar di Bursa Efek Indonesia periode 2008-2010. Jurnal Informasi, Perpajakan, Akuntansi dan Keuangan Publik, Vol.6, No.2, Hal. 83-95. Jogiyanto, HM. (2003), Teori Akuntansi dan Analisis Investasi, BPFE, Yogyakarta.
Kurnianto, Ajeng Dewi. (2013). Analisis Pengaruh EPS, ROE, DER, dan CR terhadap Harga Saham dengan PER senagai Variabel Moderating. Skripsi. UNDIP. Semarang.
Kusumo, RM Gian Ismoyo. (2011). Analisis Pengaruh Rasio Keuangan terhadap Return Saham pada perusahaan Non Bank LQ 45. Universitas Diponegoro. Semarang.
Nugroho, Inung Adi. (2009). Analisis Pengaruh Informasi Fundamental terhadap Return Saham. Universitas Diponegoro. Semarang.
Pasaribu, Rowlan Bismark Fernando. (2007). Kinerja Pasar Saham dan Informasi Akuntansi sebagai Pembentuk Portofolio Saham. Jurnal Ekonomi & Bisnis, Vol. 3 No. 3 November 2009 Hal. 203-223.
15
Sari, Nur Fita. (2012). Pengaruh DER, ROE, CR dan TATO terhadap Return Saham. Universitas Diponegoro. Semarang.
Savitri, Dyah Ayu. (2012). Analisis Pengaruh ROA, NPM, EPS, dan PER terhadap return saham. Universitas Diponegoro. Semarang.
Suharli, Michell. (2005). Studi Empiris Terhadap Dua Faktor yang Mempengaruhi Return Saham pada Industri Food and Baverages di Bursa Efek Indonesia. Jurnal Akuntansi & Keuangan, Vol. 7, No. 2, November: 99-116.
Suharli, Michell. (2008). Pengaruh Nilai Perusahaan Terhadap Return Saham dengan Price Earning Ratio (PER) sebagai Variabel Moderate pada Perusahaan Terdaftar Indeks LQ 45. Jurnal Akuntansi & Keuangan.