O R I G I N A L A R T I C L E
Being Honest About Dishonesty: Correlating
Self-Reports and Actual Lying
Rony Halevy1, Shaul Shalvi2, & Bruno Verschuere1
1 Department of Clinical Psychology, University of Amsterdam, Amsterdam, the Netherlands 2 Psychology Department, Ben Gurion University of the Negev, Beer Sheva, Israel
Does everybody lie? A dominant view is that lying is part of everyday social interaction. Recent research, however, has claimed, that robust individual differences exist, with most people reporting that they do not lie, and only a small minority reporting very frequent lying. In this study, we found most people to subjectively report little or no lying. Importantly, we found self-reports of frequent lying to positively correlate with real-life cheating and psychopathic tendencies. Our findings question whether lying is normative and common among most people, and instead suggest that most people are honest most of the time and that a small minority lies frequently.
doi:10.1111/hcre.12019
While condemned by society, lying is claimed to have survival value (King & Ford, 1988) and to be a part of everyday social interaction. In a study based on a daily-diary methodology, students reported telling on average two lies a day (DePaulo, Kirkendol, Kashy, Wyer, & Epstein, 1996). This finding was often replicated and widely cited (for a review see Vrij, 2000), leading to the conclusion ‘‘Everybody lies!’’ (e.g., DePaulo, 2004).
The claim that everybody lies was, however, recently challenged. A mass survey of 1,000 U.S. citizens had shown large individual differences with respect to lying frequency (Serota, Levine, & Boster, 2010). The survey revealed an average number of lies per day that was quite similar to what has been found in previous studies: 1.65. However, the data were heavily skewed—the few people who lied a lot pulled the overall sample mean upwards. The skewed distribution was recently replicated by the same group in a sample of U.S. high school students (Levine, Serota, Carey, & Messer, 2011), and in a large, representative U.K. community sample (Serota, Levine, & Burns, 2012). This line of work led to a competing conclusion ‘‘only some lie—a lot.’’
Everybody lies?
Growing literature, routed in social psychology, decision making, and economics, provides support to the claim that ‘‘everybody lies.’’ This growing literature, focuses
on situational factors which lead people to lie more or less (see Ariely, 2012; Bazerman & Tenbrunsel, 2011). For example, being in a dark room (Zhong, Bohns, & Gino, 2010), benefiting a charitable cause (Lewis et al., 2012) or other people (Gino, Ayal, & Ariely, 2013), reading a text encouraging a deterministic beliefs (Vohs & Schooler, 2008), depleting self-control (Gino, Schweitzer, Mead, & Ariely, 2011), and having no time to think (Shalvi, Eldar, & Bereby-Meyer, 2012), are all claimed to increase lying. By implication, if only situational factors tempt people to lie or be honest, very little room is left for individual difference to explain dishonesty.
Serota et al. (2010) findings, however, challenged this view—some participants in their sample claimed to have lied a lot, others very little. If self-reported dishonesty is somewhat related to actual dishonesty, then the skewed distribution with large variance in people’s tendency to lie suggests individual difference may largely affect human deceptive communications. Indeed, initial recent work revealed that people who chronically tend towards attempting to achieve positive outcomes (rather than to avoid negative ones from happening) are more likely to lie due to their reduced fear of the risks involved in such behaviors (regulatory focus; Gino & Margolis, 2011). Moreover, individual differences in religiousness predict people’s dishonesty: religious people seem to lie less on tasks commonly evoking dishonesty (Fischbacher & Utikal, 2011; Shalvi & Leiser, 2013).
This study advances the debate by assessing the role individual difference play in predicting dishonest behavior. According to Serota et al. (2010), individual differences play a major (but neglected) role in this field, and most lies in our society are told by a small number of prolific liars. Assessing whether individual differences are also predictive of human deceptive communication will help us better understand dishonesty in society. If everybody lies, then lies can be seen as a practical tool of communication. If, however, some individuals lie more than others, while the general population is honest most of the time, understanding the specific characteristics of those individuals who lie frequently would be quite useful. If a small group is responsible for most of the lies told in our society, we want to be able to distinguish these people from the rest of the population.
Importantly, evidences suggesting individual differences in dishonesty are chiefly based on self-reported tools. But to what extent do people respond honestly when asked about their dishonesty? And how reliable are the results of such a large survey? (for a discussion on how response biases can distort survey results see Merckelbach, Giesbrecht, Jelicic, & Smeets, 2010). No work with which we are familiar has assessed the relation between individual’s self-reported dishonesty and their actual dishonest tendencies. The current investigation attempts to fill this void.
The correlates of frequent liars
2012). This raises the question, who are these people? To address this issue, we explored which individual differences predict frequent lying, in both self-report and real-life cheating. The real life deception task we use keeps the likelihood of getting caught and expected punishment constant (and set to zero). Thus, meaningful differences in the amount of dishonesty reflect individual differences in one’s willingness to bend the task’s rules in order to secure personal financial gain.
Although the empirical evidence concerning frequent lying is scarce, we derived predictions from the literature on one condition that is considered an extreme case of frequent lying: pathological lying; individuals who repeatedly and com-pulsively tell false stories (Poletti, Borelli, & Bonuccelli, 2011). Dike, Baranoski, and Griffith (2005) suggested that pathological liars do not need any external motivation in order lie. Although all pathological liars lie frequently, we do not propose all frequent liars to be pathological liars. However, because lying is frequently a defining characteristic of pathological lying, theories regarding patho-logical liars seem to provide valuable insight into the potential profile of frequent liars.
First, Grubin (2005) suggested that pathological liars do not link negative affect to lying. The absence of a negative attitude associated with lying can be seen as a predictor of frequent lying; namely, some people lie more because they do not consider deception to be a negative act. The absence of such a negative attitude can also be interpreted as a way of justifying an existing behavior (Shalvi, Dana, Handgraaf, & Dreu, 2011). Accordingly, we expect frequent liars to show a less negative explicit attitude toward deception.
Further, pathological liars show diminished moral reasoning abilities, which has been thought to lead them to a difficulty in distinguishing right from wrong (Healy & Healy, 1916). We explore the possibility that frequent liars show deficits in moral reasoning. If indeed such deficits in moral reasoning are associated with frequent lying, related personality traits, known to be associated with moral deficits, should also correlate with frequent lying. Such personality traits include psychopathic personality, which was found to be correlated with self-reports of lying in a daily diary paradigm within a normal population (Kashy & DePaulo, 1996). We expect frequent liars to show elevated psychopathic traits.
Study 1
The lying frequency questionnaire was administered as part of a large battery of questionnaires to all first year psychology students at the University of Amsterdam. In this study, we investigated the lying frequency distribution in order to see whether the skewed distribution found by Serota et al. (2010) can be replicated. In addition, we examined the possibility that the skewed distribution on the lying frequency questionnaire is caused by random or deviate responding, namely—that people scoring high on the questionnaire were simply trying to give weird answers, or were answering the questionnaire randomly, without giving attention to the questions. Finally, if indeed the lying frequency questionnaire measures actual lying behavior, we expect it would positively correlate with participants’ Psychopathic tendencies.
Methods
Subjects
First year psychology students (N=527 [372 or 71% female]) from the University
of Amsterdam (Mage=19.7 years;SD=2.56 years). Not all subjects completed all
questionnaires. Hence, a differentN is reported for each measurement, see Table 1.
Measurements
Lying frequency questionnaire. A Dutch translation of the questionnaire used by Serota et al. (2010) was used. The questionnaire started with a short, nonevaluative description of lying as used by Serota and colleagues:
We are interested in truth and lying in everyday communication. A frequently used definition of lying is intentionally misleading anyone. Some lies are big, others are small. Some are totally false claims, others are partial truths with some important details made up or left out. Some lies are obvious, others are subtle. Some lies are told for good reason. Some lies are selfish, other lies are told in order to protect others. We are interested in all these different kinds of lies. To get a better understanding of lying, we ask a lot of people how often they lie. (p. 6)
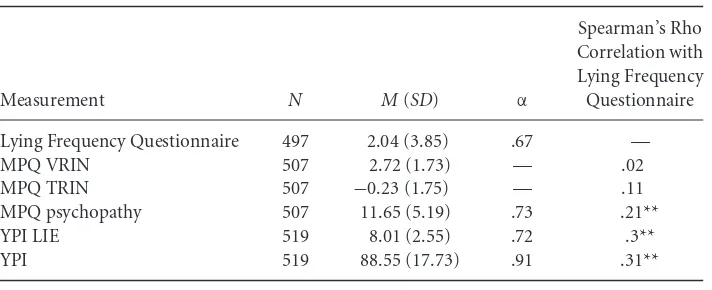
Table 1 Descriptive Statistics and Correlations with Lying Frequency—Study 1
Measurement N M(SD) α
Spearman’s Rho Correlation with Lying Frequency Questionnaire
Lying Frequency Questionnaire 497 2.04 (3.85) .67 —
MPQ VRIN 507 2.72 (1.73) — .02
MPQ TRIN 507 −0.23 (1.75) — .11
MPQ psychopathy 507 11.65 (5.19) .73 .21**
YPI LIE 519 8.01 (2.55) .72 .3**
YPI 519 88.55 (17.73) .91 .31**
After the description, subjects were asked to indicate how many times in the last 24 hours they lied to different people (family members, friends or other people you know, people you work with or know as business contacts, people you do not know but might see occasionally such as store clerks, and total strangers) using different communication types (face-to-face and non-face-to-face). A total of 5 (target of lie)×2 (communication type) estimates were given and summed into one lying
frequency index.
Youth psychopathic trait inventory (YPI). The YPI is a self-reported questionnaire designed to measure traits of psychopathic personality (Andershed, Kerr, Stattin, & Levander, 2002). The YPI consists of 50 items that can be divided into ten subscales: dishonest charm, grandiosity, lying, manipulation, callousness, un-emotionality, remorselessness, impulsiveness, thrill seeking and irresponsibility. Respondents are requested to rate to what degree each of the items apply to them on a 4-point Likert scale ranging from 1 (does not apply at all) to 4 (applies very well). The Dutch version of the YPI was found reliable and valid using a sample of nonreferred Dutch adolescents (Hillege, Das, & de Ruiter, 2010) and a community based sample of adults (Uzieblo, Verschuere, van den Bussche, & Crombez, 2010). In this study, the YPI total score and the YPI lying scale (YPI LIE) were used.
Multidimensional personality questionnaire-brief form (MPQ BF). This is a general self-report measure of personality, measuring a range of discrete trait dispositions (Patrick, Curtin, & Tellegen, 2002; see Eigenhuis, Kamphuis, & Noordhof, 2012, for the Dutch version). In this study, two measurements for inconsistent response patterns were used: the Variable Response Inconsistency scale (VRIN) and the True Response Inconsistency (TRIN). The VRIN scale consists of 21 content-matched item pairs, keyed in the same direction. The VRIN score increases as these item pairs are answered in an opposite directions, and is hence measuring random answering patterns. The TRIN scale consists of 16 content-matched item pairs, keyed in an opposite direction, so that frequent ‘‘true’’ or ‘‘false’’ answers is indicative of ‘‘yea-saying’’ or ‘‘nay-‘‘yea-saying’’, respectively (Patrick et al., 2002), and is hence measuring deviate response patterns. In addition, a selection of MPQ-subscales has been used as a measure of psychopathic traits (Benning, Patrick, Blonigen, Hicks, & Iacono, 2005). Here, we used the Dutch version of the MPQ-based psychopathy scale (Van Schagen, Verschuere, Kamphuis, Eigenhuis, & Gazendam, 2012).
Results
Three subjects were excluded from the lying frequency questionnaire, one from the YPI questionnaire and two from the MPQ questionnaire for submitting their answers too quickly (i.e., the duration was less than 2.5 SD from the mean duration, suggesting lack of attention to the task).
Lying frequency questionnaire
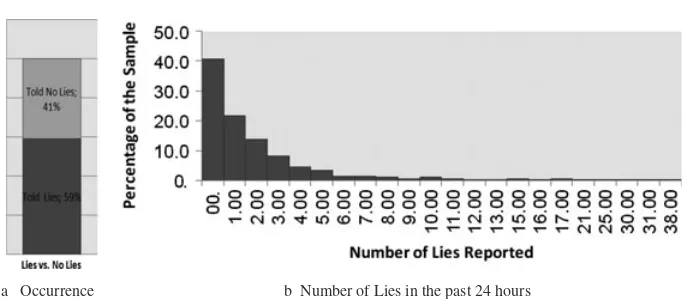
a Occurrence b Number of Lies in the past 24 hours
Figure 1 Lying frequency questionnaire distribution—Study 1. (a) Occurrence, (b) Number
of lies in the past 24 hours.
(SD=3.85) with 41% of the subjects telling no lies, 51% telling 1–5 lies, and 8%
telling 6 lies or more. Together, 5% of the subjects told 40% of all reported lies. Since the variables were not normally distributed, Spearman’s rho tests were used.1 Descriptive statistics and correlation with the lying frequency questionnaire are presented in Table 1.
Psychopathic traits
Positive correlations were found between the lying frequency questionnaire and YPI total score (r=.31,p<.01), YPI LIE scale (r=.30,p<.01), and MPQ psychopathic
trait measure (r=.21,p<.01).
Inconsistence response patterns
We used the VRIN and TRIN scales to test the possibility that random or inconsistent responses are associated with higher levels of reported lying. The cut-offs suggested by Patrick et al. (2002) were used to divide subjects to valid and invalid respondents. Specifically, as suggested by Patrick et al. an invalid respondent is someone who (1) deviates by 3 standard deviations (or more) from the mean on the VRIN score, or (2) deviates by 3.21 standard deviations (or more) from the mean on the TRIN score, or (3) deviates by 2 standard deviations (or more) from the mean on the VRIN scale as well as deviates by 2.28 standard deviations from the mean on the TRIN scale.
Nine subjects were categorized as invalid respondents. An independent t-test was used to compare lying frequency questionnaire score of valid (M=2.06;SD=3.88)
and invalid respondents (M=1.33;SD=1.22). The difference was not significant, t(495)=0.56,p=.58, obtaining no evidence for a link between deviate or random
response patterns and lying frequency.
Discussion
the lies were told by a small part of the population; only 5% of all participants were what we may label ‘‘frequent liars,’’ and were responsible for 40% of all reported lies. Moreover, using two inconsistency scales (MPQ VRIN and MPQ TRIN), we found no indication for a link between lying frequency and random or deviate response patterns. This finding provides tentative support for the validity of a self-report tool for lying frequency.
We would note that the internal consistency of the lying frequency questionnaire was modest (α=0.67). However, given the nature of the questionnaire, measuring
lying to various people, high internal consistency is not necessarily expected. That is, one may lie (a lot) to some (e.g., friends) but not to others (e.g., family). In addition, most people answer most items on this scale with 0 or 1, rendering high internal consistency less relevant.
Results further revealed the expected positive correlation between lying frequency and psychopathic tendencies (e.g., the YPI total score and the MPQ psychopathic trait measurement). Furthermore, as expected, Lying Frequency was associated with a self-reported subscale of lying habits (e.g. the YPI LIE scale). While the correlation between the lying frequency questionnaire and the YPI LIE score was modest (r=.30),
we note that the two measurements are quite different from each other and seem to tap on different kinds of lies. The YPI LIE scale, administered in a context of psychopathic trait measurement, is more tuned to measuring egocentric lies, whereas the lying frequency questionnaire, which starts with a paragraph emphasizing the prevalence of deception in society, captures a larger variety of lies.
Taken together, the results of Study 1 replicated the skewed lying frequency dis-tribution (Levine et al., 2011; Serota et al., 2010, 2012). Moreover, initial information regarding the characteristics of the small minority of frequent liars is provided. We found that frequent lying is associated with psychopathic tendencies. We were not able, however, to address the affective aspect of frequent lying and the relation to moral deficits in the mass survey used in Study 1. In addition, as mentioned above, one of the main goals of the current project was assessing the relation between self-reported lying frequency and real life deception, measured by incentivized behavior. In Study 2, we invited subjects to the lab to address these issues.
Study 2
We further used two different tasks in which subjects had the opportunity to cheat privately for financial profit, allowing us to investigate the relation between self-reported lying frequency and real-life cheating. The first task was an adaptation of the Die Under Cup task (Shalvi et al., 2011 adapted from Fischbacher & Heusi, 2008) in which participants receive a regular die inside a paper cup, with a small hole enabling them to privately roll the die under the cup and see the outcome. Participants are instructed to roll and report the outcome to determine their pay (higher numbers equal higher pay).
Although results of the die rolls are truly private, lying can be analyzed on the aggregate level comparing the empirical distribution of reported die rolls to the theoretic distribution of an honest die roll (Shalvi et al., 2011). Here, we made a first attempt to use this task in order to classify subjects according to their individual (dis)honesty. Subjects were asked to engage in multiple trials of rolling the die and reporting the rolled outcomes. We classified participants as dishonest if their reported average of die rolls was statistically unlikely (see a similar approach using a coin-tossing task in Greene & Paxton, 2009).
The Die Under Cup task was found very useful when investigating real life cheating, because it is very simple to explain, and the subjects can easily understand that no one but them will know if they cheated. However, classifying subjects into honest and dishonest in this task is based solely on statistics, meaning that extremely lucky subjects will be falsely classified as being dishonest.
To address this limitation, we administered a second cheating task, the Words task (Wiltermuth, 2011), in which a clear-cut discrimination between honest and dishonest subjects is possible. In this task, subjects are asked to solve word jumbles in the order in which they are presented, and are paid according to their reported success in a consecutive order. As participants are asked to report only the number of correct answers they had, not their actual answers, they could lie about the number of correct answers and gain more money. Critically, the third word presented was unsolvable, so any subject reporting solving more than two words, can be classified as dishonest.
Method
Sampling
we sampledN=51 (37 female) participants from the University of Amsterdam (M
age=21.1 years;SD=6.16 years). Subjects participated in the experiment for either
money or course credit.
Procedure
The experimenter was blind of the subjects’ lying frequency questionnaire score throughout the scheduling and testing phases. lying frequency questionnaire and YPI were administered again. In addition, the following measures were used2:
Feeling thermometer (FT). (Jung & Lee, 2009). Subjects were presented with six words related to deception and six words related to honesty, and were asked to rate the words as pleasant or unpleasant on an 11-point Likert scale ranging from 1 (unpleasant) to 11 (pleasant). The average score for lie words was subtracted from the average score for truth words. A high score indicates a bigger difference between truth and lie words, for example, a more negative attitude towards deception.
Defining issues test 2 (DIT2). Subjects were presented with three paragraph-long moral dilemmas and were asked what the main character should do (Rest et al., 1999). Next, subjects were asked to rate 10 statements as important/unimportant for the decision on a 5-point Likert scale and then rank these statements. Answers were used to calculate an index score of moral development (known as N2 index; higher score indicate higher moral development; for details regarding the computing procedure see Rest, Thoma, Narvaez, & Bebeau, 1997).
Die Under Cup. A modification of the paradigm by Shalvi et al. (2011) was used. Subjects received a covered cup with a die inside it, and a small hole in the lid. They were informed that they would be paid according to their reported scores,¤0.02 for each point they rolled in each of the trials, meaning¤0.02 when rolling ‘‘1,’’¤0.04 when rolling ‘‘2,’’ and so on. In each trial, subjects were requested to roll the dice three times, check the outcome every time, but to report only the outcome of the first roll by typing the outcome into the computer. The task included 60 trials, so in total each subject rolled the dice 180 times but only reported and were paid for the 60 rolls they reported. A participant who wishes to maximize profit (or a very lucky honest one) may thus report rolling six in all 60 trials earning¤7.20 in total, which is well above the expected value if reporting honestly.
Words task. Subjects were presented with nine scrambled words in Dutch, and had 5 minutes to solve them (the solutions were potlood [pencil], bloem [flower], taguan [taguan], sokken [socks], steen [stone], kleur [color], rusten [rest], koekje [cookie], and ijsberg [iceberg]) (Wiltermuth, 2011).3 Subjects were paid an extra ¤0.5 for each word they solved, but the instructions indicated that the words should
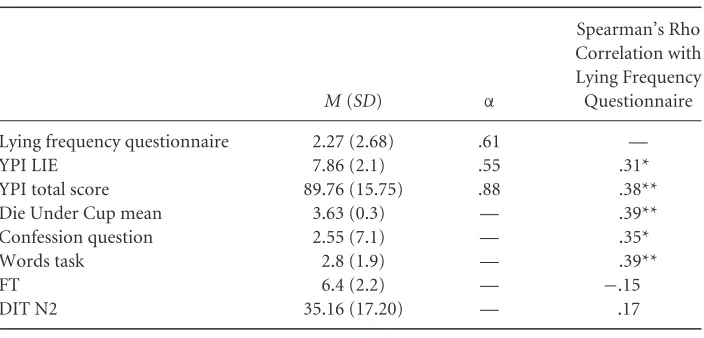
Table 2 Descriptive Statistics and Correlations with lying Frequency—Study 2
M(SD) α
Spearman’s Rho Correlation with Lying Frequency Questionnaire
Lying frequency questionnaire 2.27 (2.68) .61 —
YPI LIE 7.86 (2.1) .55 .31*
YPI total score 89.76 (15.75) .88 .38**
Die Under Cup mean 3.63 (0.3) — .39**
Confession question 2.55 (7.1) — .35*
Words task 2.8 (1.9) — .39**
FT 6.4 (2.2) — −.15
DIT N2 35.16 (17.20) — .17
(*p<.05. **p<0.01).
the payment. After reading the instructions, the experimenter verified that subjects understood the instructions. Crucially, and unknown to the participants, the third word was extremely rare and difficult to solve. This word could only be unscrambled to spell ‘‘taguan,’’ a large nocturnal flying squirrel. Given this design, any reported score of three and above could be considered as cheating, enabling a clear cut between honest and dishonest subjects.
Confession question. After receiving their payment, subjects were asked to answer the following question on a small piece of paper and put it in a sealed box: ‘‘We are interested in the way people perform in the Die Under Cup task. The money you earned is yours and will not be taken away. We want to ask you a short question regarding your performance in this task. Out of the 60 times you had to report your score, how many times did you report a higher score than you actually rolled?’’ Any report of above zero was considered as a confession of dishonesty.
Results
The different measurements’ descriptive statistics and correlations with lying fre-quency questionnaire are presented in Table 2.
Lying frequency questionnaire
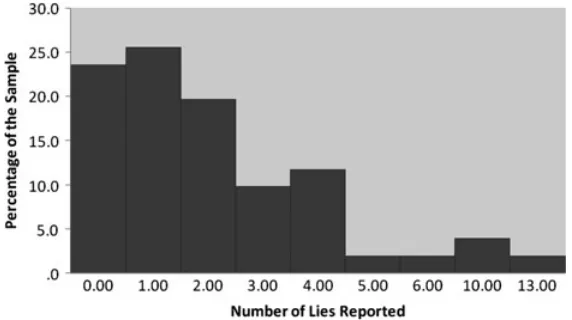
Results distribution is presented in Figure 2.
Youth psychopathic trait inventory. As predicted, and replicating the results of study 1, a positive correlation was found between the lying frequency questionnaire and both YPI total score,r=.38,p<.01, and the YPI LIE score,r=.31,p<.05.
Figure 2 Lying frequency questionnaire distribution—Study 2.
Feeling thermometer. Subjects generally rated words related to truth (M=8.87, SD=1.19) as more pleasant than words related to deception (M=2.47,SD=1.23), t(49)=20.55,p<.001,d=3.05. A difference score (average for truth words minus
average for lie words) was calculated for each subject and correlated with the lying frequency questionnaire score. A nonsignificant negative trend was found in the predicted direction; frequent liars showed a slightly less negative attitude towards deception (r= −.15,ns).
Die Under Cup. The average score in the Die Under Cup task was 3.63 (SD=1.67)
and the distribution of responses deviated from the theoretical symmetric (honest) distribution, χ2=23.73, p<.001, indicating that in general, some cheating took place. As expected, the average die roll score was positively correlated with the lying frequency questionnaire, (r=.39,p<.01). The more people self-reported lying, the
more they earned in the Die Under Cup task.
We further classified subjects as Honest and Dishonest according to the likelihood that their reported scores were honest. Taking an alpha of 10%, 15 subjects (29% of the sample) showed a score which was higher than the score predicted by chance. A one way ANOVA was used to compare the scores of the two groups (honest [n=36] and
dishonest [n=15] subjects). For the lying frequency questionnaire and the YPI total
score, results revealed a significant difference between males and females, with males scoring higher on both measurements. Hence, gender was entered as a covariate.
A significant difference was found for the lying frequency score,F(1, 49)=9.45, p<.005,η2=0.14, with dishonest subjects scoring higher (M=3.93,SD=3.49) than honest subjects (M=1.58,SD=1.93). A significant difference was also found for the
confession question, with dishonest subjects scoring higher (M=7.00,SD=11.92)
(M=6.74,SD=2.10),F(1, 49)=2.85,p=.09,η2=0.06. No difference was found for the Words score,F(1, 49)=2.68,p=.11, YPI total score,F(1, 49)=1.07,p=.31,
YPI LIE score,F(1, 49)=0.54,p=.46 or DIT score,F(1, 49)=0.64,p=.42.
Confession question. Twelve out of 51 subjects (23.5 %) confessed to some degree of over-reporting (e.g., dishonesty). Confessions were positively correlated with the Die Under Cup score, r=.49, p<.001, validating that high scores on
the Die Under Cup task are related to deception. Furthermore, confessions were also positively correlated with the lying frequency questionnaire (r=.35,p<.05).
We used the confession question to divide subjects to honest and dishonest. One Way ANOVA’s were used to compare self-proclaimed honest vs. dishonest subjects. For the lying frequency questionnaire and the YPI total score, males scored higher than females; hence, gender was entered as a covariate. Dishonest subjects scored higher (M=3.75, SD=3.19) than honest subjects (M=1.82, SD=2.87) in the
lying frequency questionnaire, F(1, 49)=6.82, p<.05, η2=0.12. No significant differences were detected between honest and dishonest subjects in the YPI total score,F(1, 49)=1.4,p=.244, YPI LIE score,F(1, 49)=1.46,p=.23, DIT score,F(1,
49)=1.31,p=.72 or FT score,F(1, 49)=2.07,p=.16.
Words task. Twelve out of 51 subjects (23 %) reported solving more than two words, and were classified as dishonest. Six of them were also classified as dishonest based on the Die Under Cup total score. A positive correlation was found between the Words task score and the lying frequency questionnaire (r=.39,p<.01). One way
ANOVA’s were used to compare the scores of the honest vs. dishonest subjects. For the lying frequency questionnaire and the YPI total score, a significant difference was found between males and females, with males scoring higher in both measurements. Hence, gender was entered as a covariate.
A nonsignificant difference in the expected direction was found in the lying fre-quency questionnaire between dishonest (M=3.58,SD=2.47) and honest subjects
(M=1.87,SD=2.65) subjects, F(1, 49)=3.7,p=.06. A significant difference was
found in the Die Under Cup task between dishonest (M=3.82, SD=0.33) and
honest subjects (M=3.58,SD=0.27),F(1, 49)=6.08,p<.05,η2=0.12. Dishonest subjects also scored higher in the YPI LIE scale (M=8.92,SD=2.58, as opposed to M=7.54,SD=1.80),F(1, 49)=4.2,p<.05,η2=0.08. Finally, dishonest subjects scored higher on the YPI total score (M=98.17,SD=15.88, as oppose toM=87.18, SD=14.97),F(1, 49)=4.7,p<.05,η2=0.07. No significant difference was found in the FT score,F(1, 49)=2.31,p=.13 and the DIT score,F(1, 49)=0.68,p=.41.
Discussion
Importantly, people who reported to lie more often were also more likely to cheat in tasks allowing them to make a quick profit. Dishonest subjects in both Die Under Cup and Words tasks showed higher scores on the lying frequency questionnaire. These tasks are good proxies to lies in real life, since the participant makes the decision to lie, and a (financial) reward is attached to lying.
An additional interesting finding was that in the Words (but not the Die Under Cup) task, dishonest subjects also scored higher in the YPI total score and YPI LIE score. Perhaps the clear cut difference between honest and dishonest subjects in the Words task also affects the way subjects conceive the task. In the Die Under Cup task, subjects can over report occasionally, or by just a bit. On the Words task, on the other hand, subjects have one moment in which they make the decision to cheat. Levine et al. (2002) found that a violation of quantity is the most common form of deception, perhaps because it requires less effort. Over-reporting on the Die Under Cup task can be considered as a violation of quantity, while cheating in the Words task is more of a quality violation. Hence we find it reasonable that psychopathic tendencies are related to deception in the Words task, a more effortful form of deception.
No correlation was found between lying frequency and the DIT score, and dishonest subjects according to all the classifications did not score lower on the DIT task. These findings indicate that frequent lying is not related to a deficiency in moral judgment, as suggested for pathological liars (Healy & Healy, 1916). Frequent liars in this study seemingly displayed normal moral judgment and were capable of discriminating right from wrong, but simply made the decision to lie. A similar claim, of being able to discriminate right from wrong and yet choosing wrong, was recently made for psychopathic inmates (Cima, Tonnaer, & Hauser, 2010).
Finally, a strong correlation was found between the confession question and results on the Die Under Cup task. First, this finding validates the idea that a high score on the Die Under Cup task is generally related to dishonesty and not luck. Second, this questionnaire enabled another classification of honest and dishonest subjects. Using this classification as well revealed that dishonest subjects scored higher on the lying frequency questionnaire. It seems like frequent liars do not only cheat more, they are also more willing to admit it.
One limitation of the study is the fact that as opposed to the results of study 1 and previous studies (Andershed et al., 2002; Hillege et al., 2010), the internal consistency of the YPI Lie scale was modest (.55). This may be due to the combination of the small number of items in this scale (see Streiner, 2003) with the smaller sample used in Study 2.
General Discussion
between lying frequency and psychopathic tendencies and a trend of a less negative attitude towards deception.
Replication
We found a skewed lying frequency distribution, replicating the findings of Serota et al. (2010). While the claim that everybody lies is becoming widely accepted, with some claiming all people lie between 10 and 200 times a day (see Meyer, 2011), the findings presented here provide a somewhat different picture—many people report not lying at all.
Results further support the validity of the lying frequency questionnaire: We did not find a relation between the lying frequency questionnaire and random answering pattern or a tendency for deviate responses. Given the large sample size in Study 1, it is not likely that the lack of findings is due to power issues. Using G*Power 3 (Faul, Erdfelder, Lang, & Buchner, 2007), we calculated the magnitude of effect that could be detected with this sample size and the conventional value of .80 for minimal statistical power. This analysis showed that our sample was large enough to detect an effect size of only .07.
Positive relation between self-reports and actual dishonesty
Additional support for the validity of the questionnaire was found by the correlation between self-reported frequent lying and real life deception in the lab in two separate tasks enabling profitable deception: the Die Under Cup and the Words tasks. We further used these tasks to classify subjects as honest and dishonest, and found that dishonest subjects score higher on the lying frequency questionnaire.
Correlates of frequent liars
Finally, the data enabled a better understanding of the different correlates of frequent lying. With respect to the personality correlates of frequent lying, a correlation between lying frequency and psychopathic tendencies was found. This correlation was of medium strength, 0.2–0.3, and significant in both studies using two different measures. Hence, at least part of the variance in lying frequency is explained by psychopathic tendencies. Dike et al. (2005) claimed that antisocial individuals are inclined to lying frequently, and psychopathy, as seen from the subscales of the YPI, is partially defined by lying habits. In addition, Kashy and Depaulo (1996) found that manipulative individuals (another personality trait that characterize people with psychopathic tendencies) tend to lie more. The stable correlation between psychopathic tendencies and lying habits therefore corroborates clinical observations and theoretical claims about psychopathy.
1999). With respect to deception, implicit but not explicit attitude was claimed to predict behavior (Jung & Lee, 2009). Given this claim, the trend found here is quite interesting. This finding is coherent with the finding of Serota et al. (2012) that prolific liars find lying to be a more acceptable behavior. A less negative attitude towards lying might predispose some individuals to frequent lying. Another possibility is that people who find lying less negative are the ones who will admit lying frequently in a questionnaire, while others who lie just as much but consider lying to be a negative act, choose to under-report their lying rates.
However, frequent liars do not seem to have a moral deficit; no correlation was found between the lying frequency questionnaire or the Die Under Cup task and the DIT2. We investigated the possibility that the lack of findings is due to power issues. According to G*Power 3 (Faul et al., 2007), in order to find a correlation of .17 (the correlation found between DIT2 and the lying frequency questionnaire) as significant, a sample ofN=212 was needed (withα=.05). While our sample size does not allow completely ruling out the possibility, moral deficiency is unlikely to be an important factor.
Implications of the current findings
Taken together, our findings contribute to the developing debate regarding the role of individual differences in lying behavior. We provide solid evidence showing that both self-reports regarding lying frequency and cheating in the lab are correlated and associated with certain individual characteristics. This evidence strengthens the need to continue investigating the role of individual differences in deceptive communication, as clearly such differences matter. While situational factors are likely to play a role in the decision to lie or cheat, as lying or cheating is easier or more appealing in some situations, certain personality traits seemingly make some of us more prone to deceptive behavior than others.
The fact that individual differences play a role in deceptive behavior is of great interest to economic and (ethical) decision-making research. The small minority of frequent liars may be less susceptible to manipulations used in this line of work. For example, recent work revealed that people lie more when they can secure opportunities to win positive outcomes. Yet, some individuals cheat to the maximum extent possible regardless of such situational considerations (Shalvi, 2012). Mazar, Amir, and Ariely (2008) suggested that self-concept maintenance can explain the extent to which people lie. According to this theory, ‘‘people behave dishonestly enough to profit, but honestly enough to delude themselves of their integrity’’ (Mazar et al., 2008, p. 633). Perhaps the desire to maintain an honest self-concept explains decision making only in nonfrequent liars. Simply put, frequent liars may be less concerned with maintaining an honest self image.
reliability of every claim we come across is ineffective, and we are hence prone to believe to what we hear. This bias is thought to provide a useful tool in most social interactions (as most social interactions are claimed to be honest). However, the usefulness of this heuristic obviously depends on the chance that the individual in front of us is telling the truth. If we are all liars—the truth bias will be a nonadaptive mechanism. If a small group in the population is prone to very frequent lying, the truth bias could be misleading only when communicating with these specific individuals, but adaptive when communicating with others.
Our research may also provide a new motivation for research on pathological lying. The knowledge regarding pathological lying is mostly limited to theory, clinical observation, and anecdotal evidence. Our study provides the much needed tools to start the empirical investigation of pathological lying and how they are qualitatively and quantitatively different from frequent liars. The study of frequent liars seems valuable for shaping new hypotheses concerning the nature and development of pathological lying.
Conclusions
The current research reveals individual differences play a role in deceptive commu-nication, and provide a better understanding of the elements distinguishing frequent liars from the rest of the population. The emerging profile of a frequent liar is of a person who has higher scores on psychopathic traits measures and is more prone to cheating in a lab task. Future research should further craft the characteristics of this interesting population and investigate the causal directionality of the uncovered correlations. A further promising direction is to gain better understanding of the developmental pathway that may lead some individuals to become frequent liars, or even pathological liars. Gaining such knowledge may help identify the frequent liars among us. It may also be valuable to craft interventions aimed at these populations to help them stop lying and begin telling the truth.
Acknowledgments
The research leading to these results received funding from the People Program (Marie Curie Actions) of the European Union’s Seventh Framework Program (FP7/2007–2013) under REA grant agreement number 333745, awarded to Shaul Shalvi.
Notes
1 An additional analysis computing Pearson correlations while controlling for gender effects revealed the same pattern of results. Gender is thus not discussed further.
3 These words were selected from a larger sample of words, after piloting the words with 10 native Dutch speakers. The unsolvable word was not solved by any of the subjects, and the solvable words were solved by all 10 subjects.
References
Andershed, H., Kerr, M., Stattin, H., & Levander, S. (2002). Psychopathic traits in non-referred youths: A new assessment tool. In E. Blaauw & L. Sheridan (Eds.), Psychopaths—current international perspectives(pp. 131–158). The Hague, The Netherlands: Elsevier.
Ariely, D. (2012).The honest truth about dishonesty: How we lie to everyone, especially ourselves. New York, NY: HarperCollins.
Bazerman, M. H., & Tenbrunsel, A. E. (2011).Blind spots: Why we fail to do what’s right and what to do about it. Princeton, NJ: Princeton University Press.
Benning, S. D., Patrick, C. J., Blonigen, D. M., Hicks, B. M., & Iacono, W. G. (2005). Estimating facets of psychopathy from normal range personality traits: A step towards community epidemiological investigations.Assessment,12, 3–18.
doi: 10.1177/1073191104271223.
Chen, M., & Bargh, J. A. (1999). Consequences of automatic evaluation: Immediate behavioral predispositions to approach or avoid the stimulus.Personality and Social Psychology Bulletin,25, 215–224. doi: 10.1177/0146167299025002007.
Cima, M., Tonnaer, F., & Hauser, M. D. (2010). Psychopaths know right from wrong but don’t care.Social Cognitive and Affective Neuroscience,5, 59–67.
doi: 10.1093/scan/nsp051.
DePaulo, B. M. (2004). The many faces of lies. In A. G. Miller (Ed.),The social psychology of good and evil(pp. 303–236). New York, NY: Guilford Press.
DePaulo, B. M., Kirkendol, S. E., Kashy, D. A., Wyer, M. M., & Epstein, J. A. (1996). Lying in everyday life.Journal of Personality and Social Psychology,70, 979–995.
doi: 10.1037//0022-3514.70.5.979.
Derogatis, L. R. (1975).How to use the System Distress Checklist (SCL-90) in clinical evalu ations, psychiatric rating scale, self-report rating scale. Nutley, NJ: Hoffmann-La Roche. Dike, C. C., Baranoski, M., & Griffith, E. E. H. (2005). Pathological lying revisited.Journal of
the American Academy of Psychiatry and the Law,33, 342–349.
Eigenhuis, A., Kamphuis, J. H., & Noordhof, A. (2012). Development and validation of the Dutch brief form of the multidimensional personality questionnaire (MPQ-BF-NL). Assessment. doi: 10.1177/1073191112444920 Advance online publication.
Faul, F., Erdfelder, E., Lang, A. G., & Buchner, A. (2007). G*Power 3: A flexible statistical power analysis program for the social, behavioral, and biomedical sciences.Behavior Research Methods,39, 175–191. doi: 10.3758/BF03193146.
Fischbacher, U. & Heusi, F. (2008).Lies in disguise: an experimental study on cheating. Working Paper Series No. 40. Germany, Thurgau Institute of Economics, University of Konstanz.
Fischbacher, U. & Utikal, V. (2011).Disadvantageous lies. Thurgau Institute of Economics, Research paper series,71, 6.
Gino, F., Ayal, S., & Ariely, D. (2013). Self-serving altruism? The lure of unethical actions that benefit others.Journal of Economic Behavior and Organization. Advance online
publication. doi:10.1016/j.jebo.2013.04.005
Gino, F., Schweitzer, M. E., Mead, N. L., & Ariely, D. (2011). Unable to resist temptation: How self-control depletion promotes unethical behavior.Organizational Behavior and Human Decision Processes,115, 191–203. doi: 10.1016/j.obhdp.2011.03.001.
Greene, J. D., & Paxton, J. M. (2009). Patterns of neural activity associated with honest and dishonest moral decisions.PNAS,106, 12506–12511. doi: 10.1073/pnas.0900152106. Grubin, D. (2005). Getting at the truth about pathological lying.The Journal of the American
Academy of Psychiatry and the Law,33, 350–353.
Healy, W., & Healy, M. T. (1916). Pathological lying, accusation, and swindling.The Yale Law Journal,25, 252–293. doi: 10.2307/786422.
Hillege, S., Das, J., & de Ruiter, C. (2010). The youth psychopathic traits inventory: Psycho-metric properties and its relation to substance use and interpersonal style in a Dutch sample of non-referred adolescents.Journal of Adolescence,33, 83–91. doi: 10.1016/j. adolescence.2009.05.006.
Jung, K. H., & Lee, J. (2009). Implicit and explicit attitude dissociation in spontaneous deceptive behavior.Acta Psychological,132, 62–67. doi: 10.1016/j.actpsy.2009.06.004. Kashy, D. A., & DePaulo, B. M. (1996). Who lies?Journal of Personality and Social Psychology,
70, 1037–1051. doi: 10.1037//0022-3514.70.5.1037.
King, B. H., & Ford, C. V. (1988). Psaudologia fantastica.Acta Psychiatry,77, 1–6. doi: 10.1111/j.1600-0447.1988.tb05068.x.
Levine, T. R., Lapinski, M. K., Banas, J., Wong, N. C. H., Hu, A. D. S., Endo, K., et al. (2002). Self-construal, self and other benefit and the generation of deceptive messages.Journal of Intercultural Communication Research,31, 29–47.
Levine, T. R., Park, H. S., & McCornack, S. A. (1999). Accuracy in detecting truths and lies: Documenting the ’veracity effect.Communication Monographs,66, 125–144. doi: 10.1080/03637759909376468.
Levine, T. R., Serota, K. B., Carey, F., & Messer, D. (2011). Teenagers lie a lot. Proceedings from the 61stAnnual International Communication Association Conference Boston, Massachusetts.
Lewis, A., Bardis, A., Flint, C., Mason, C., Smith, N., Tickle, C., et al. (2012). Drawing the line somewhere: An experimental study of moral compromise.Journal of Economic
Psychology,33, 718–725. doi: 10.1016/j.joep.2012.01.005.
Mazar, N., Amir, O., & Ariely, D. (2008). The dishonesty of honest people: A theory of self-concept maintenance.Journal of Marketing Research,45, 633–644.
doi: 10.1509/jmkr.45.6.633.
Merckelbach, H., Giesbrecht, T., Jelicic, M., & Smeets, T. (2010). Kretenzers in surveys: het problem van onzorgvuldige respondenten [Cretans in surveys: the problem of careless responders].Tijdschrift voor Psychiatrie,52, 663–669.
Meyer, P. (2011, October). Pamela Meyer: How to spot a liar [video file]. Retrieved from http://www.ted.com/talks/pamela_meyer_how_to_spot_a_liar.html
Patrick, C. J., Curtin, J. J., & Tellegen, A. (2002). Development and validation of a brief form of the multidimensional personality questionnaire.Psychological Assessment,14,
Poletti, M., Borelli, P., & Bonuccelli, U. (2011). The neuropsychological correlates of pathological lying: Evidence from behavioral variant frontotemporal dementia.Journal of Neurology,258, 2009–2013. doi: 10.1007/s00415-011-6058-1.
Rest, R. J., Narvaes, D., Thoma, S. J., & Babeau, M. J. (1999). DIT2: Devising and testing a revised instrument of moral judgment.Journal of Educational Psychology,91, 644–659. doi: 10.1037//0022-0663.91.4.644.
Rest, R. J., Thoma, S. J., Narvaes, D., & Babeau, M. J. (1997). Alchemy and beyond: Indexing the defining issues test.Journal of Educational Psychology,89, 498–507. doi:
10.1037//0022-0663.89.3.498.
Serota, K. B., Levine, T. R., & Boster, F. J. (2010). The prevalence of lying in America: Three studies of self-reported lies.Human Communication Research,36, 2–25. doi:
10.1111/j.1468-2958.2009.01366.x.
Serota, K. B., Levine, T. R., & Burns, A. (2012). A few prolific liars: Variation in the prevalence of lying. Proceedings from the 98th Annual Convention of the National Communication Association. Orlando, Florida.
Shalvi, S. (2012). Dishonestly increasing the likelihood of winning.Judgment and Decision Making,7, 292–303.
Shalvi, S., & Leiser, D. (2013). Moral firmness.Journal of Economics, Behavior and OrganizationAdvance online publication. doi: 10.1016/j.jebo.2013.03.014.
Shalvi, S., Dana, J., Handgraaf, M. J. J., & Dreu, C. K. W. (2011). Justified ethicality: Observing desired counterfactuals modifies ethical perceptions and behavior.Organizational Behavior and Human Decision Processes,115, 181–190. doi: 10.1016/j.obhdp.2011.02.001. Shalvi, S., Eldar, O., & Bereby-Meyer, Y. (2012). Honesty requires time (and lack of
justifications).Psychological Science,23, 1264–1270. doi: 10.1177/0956797612443835. Streiner, D. L. (2003). Starting at the beginning: An introduction to coefficient alpha and
internal consistency.Journal of Personality Assessment,80, 99–103. doi: 10.1207/S15327752JPA8001_18.
Uzieblo, K., Verschuere, B., Van den Bussche, E., & Crombez, G. (2010). The validity of the Psychopathic Personality Inventory-Revised in a community sample.Assessment,17, 334–346. doi: 10.1177/1073191109356544.
Van Goethem, A. A. J., van Hoof, A., van Aken, M. A. G., Raaijmakers, Q. A. W., Boom, J., & Orobio de Castro, B. (2012). The role of adolescents’ morality and identity in
volunteering: Age and gender differences in a process model.Journal of Adolescence,35, 509–521. doi: 10.1016/j.adolescence.2011.08.012.
Van Schagen, S., Verschuere, B. J., Kamphuis, J. H., Eigenhuis, A., & Gazendam, F. (2012). The Multidimensional Personality Questionnaire (MPQ) as a measure of psychopathic traits. Unpublished manuscript, University of Amsterdam.
Vohs, K. D., & Schooler, J. W. (2008). The value of believing in free will: Encouraging a belief in determinism increases cheating.Psychological Science,19, 49–54. doi:
10.1111/j.1467-9280.2008.02045.x.
Vrij, A. (2000).Detecting Lies and Deceit. Chichester, England: Wiley.
Wiltermuth, S. S. (2011). Cheating more when the spoils are split.Organizational Behavior and Human Decision Processes,115, 157–168. doi: 10.1016/j.obhdp.2010.10.001. Zhong, C., Bohns, V. K., & Gino, F. (2010). A good lamp is the best police: Darkness