ASSESSMENT OF THE IMPACTS OF LAND USE ON WATER QUALITY OF
BRANTAS UPSTREAM, BATU CITY, INDONESIA
Bambang Rahadi1, Fajri Anugroho1, Euis Elih Nurlaelih2, Novia Lusiana1, Akhmad Adi Sulianto1 1Faculty of Agricultural Technology, University of Brawijaya
2Faculty of Agriculture, University of Brawijaya Email: [email protected]
ABSTRACT
Unsuitability land uses have significant impact on conditions of many river basins along line from upstream to downstream through the cities in Indonesia. Water of Brantas upstream running along line through Batu City from Bumiaji Sub-District to Junrejo Sub-District may show varied concentrations of contaminants. The objective studies are (i) to evaluate the land use at existing-condition; (ii) to monitor the water quality parameters; (iii) to assess the water quality index and water pollution index of the Brantas upstream water. In this study, Pearson correlation of BOD and COD shown a very high positive correlations (r) of 0.8779. Meanwhile, high positive correlations were shown in TSS vs T-PO4 and
T-NO3 vs T-PO4, whereas DO vs TDS, DO vs
T-NO3, and DO vs T-PO4 have high negative
correlations. Based on the four river water quality classifications in Indonesia, all stations shown the status of water pollution index at moderate level (Class I and II). Meanwhile, the water pollution index status of Class III were dominated by moderate level. In contrast, the status of water pollution index in Class IV was dominated by good level. Water pollution index in Category IV was relatively similar result to NSF-WQI status rather than other categories.
Keywords: Brantas upstream watershed, land use, water pollution index, water quality parameters
1. INTRODUCTION
River water quality has become an environmental problem in recent years especially in developing countries. The problem occurs due to land use changes in river basin area. The water resources was potentially affected by land use changes (Stonestrom et al., 2009). Uncontrolled land use changes from forest to agriculture field and from agricultural
to settlement uses have significant impact on conditions of many river basins along line from upstream to downstream through the cities in Indonesia. In our previous research on land suitability in Batu Municipality, the unsuitable land use on existing and spatial planning conditions were 25.7% and 32.1% of the total area, respectively (Rahadi et al., 2014). The increase numbers of the land use changes, that is not suitable with a land capability, throughout a river basin can decrease their water quality. Wastes from domestic dan agricultural activities can enter to the river and increase concentration and variation of contaminants.
Brantas Upstream is used as the source of water supply for industry, domestic and agricultural activity and mainly as the buffer area of avalaible-water for human living and activity in Brantas Downstream. However, intensive activity of agricultural sector at rural landscapes of Bumiaji District in Batu City affected the condition of a river basin of Brantas Upstream has gotten worse. A large amount of highly suitable land for forest in hillside of the Arjuno Mountain has been converted to agricultural and settlement uses. The agriculture activity in hillside is predominantly increase soil erosion and sedimentation along line the river. A frequently applied fertilizer and pesticide in high dose in the agriculture field affect high concentration of contaminants in watershed. Similarly, settlement use for living or recreation places increase domestic wastes that is put in river basin for years. Researcher from Live-Environmental Board of East Java (2011) had reported that condition of Brantas Downstream particularly Surabaya River and Porong river was highly polluted. Therefore, a quality of the Brantas Upstream waters should be maintained and managed in order to continuously keep water drinking supply.
contaminants. Also, a different amount of water quality parameters may describe different water pollution index. The distribution concentration of the parameters and water pollution index may help the local government to manage the quality of the river water to supply several purposes, particular supply for drinking water treatment. Therefore, it is important to assess the water quality in upstream area of the Brantas River. The aims of this study are to analyze concentration of contaminant in Brantas upstream river, and to identify their water quality and water pollution indexes.
2. MATERIALS AND METHODS
2.1. Study Site
Area study is Brantas Upstream water running through Batu City started from Bumiaji Sub-District to Junrejo Sub-District, where they geographically located between 127°17' - 120°56' East Longitude and 7°44' - 8°26' South Latitude. Batu City is composed of three sub districts namely: Bumiaji, Batu and Junrejo with an area of 12,798 Ha, 4,546 Ha and 2,565 Ha, respectively.
2.2. Land Evaluation
In our previous study, both land capability and land suitability of Batu Municipality has been observed. The land assessment was rely on the description of primary attributes for map units. These attributes are converted into land use. Land capability assessment is applied to
land classification and land use maps (≥1:250
000 scale), whereas land suitability assessment is applied to detailed soil mapping (1:100 000 scale). This matches the detail of the land evaluation to the detail of the available land resource data.
2.3. Water Sampling Points and Procedures
Each place of sampling and discharge measurements was pointed with GPS. In this study, 12 points were observed, by sampling and analysis of some parameters to determine the quality of the water. Water samples from the specified locations were collected in May 2015 (rainy season). The water samples were taken according to standard method (APHA, 1992.). The water samples were collected from the number of distribution sites and selection of the sample was performed depending on stream
characteristics, study objectives and availability of equipments. The samples were taken from left, middle and right sides of the Brantas upstream at mid-depth throughout the study area.
At each sampling point, the river water was fully put to 1.5-L bottle and discharge measured at three different locations (two edge, one central) from the river. Discharge streams and rivers wide were measured. The collected samples were put in cool box during sampling and transported to the Laboratory and stored in freezer until the time a chemical analysis done. The samples were chemically analysed at the Water Analysis Laboratory of Jasa Tirta Co., in Malang, East Java, Indonesia. All chemical analyses were achieved according to standard methods (APHA, 1992).
Table 1. Selected parameters of water quality standard for river water in Indonesia according to Government Regulation no
82/2001.
Class I
Class
II Class III Class IV
pH Dev 3 Dev 3 Dev 3 Dev 5
DO 6,0 4,0 3,0 0,0
BOD 2,0 3,0 6,0 6,0
COD 10,0 25,0 50,0 100,0 TSS 50,0 50,0 400,0 400,0 TDS 1000,0 1000,0 1000,0 2000,0
T-NO3 10,0 10,0 20,0 20,0
T-PO4 0,2 0,2 1,0 5,0
DET 0,2 0,2 0,2 None
FC 100,0 1000,0 2000,0 2000,0 Unit measurement of all parameters is mg/L, except for Fecal Coliform (FC) using MPN/100mL. Dev: deviation.; pH value in the range of 6.5 – 9.0, Class I is for drinking water or any other use with the similar requirements; Class II is for service water, recreational, aquaculture or any other use with the similar requirements; Class III is for fresh water agriculture, farming and any other use with the similar requirements; Class IV is for irrigation and any other use with the similar requirements
2.4. Water Sample Analysis
oxygen (DO), biological oxygen demand (BOD), chemical oxygen demand (COD) and total suspended solid (TSS), total dissolved solid (TDS), total of nitrate (T-NO3), phosphate
(T-PO4), detergent (DET) and Faecal coliform
(FC) were analyzed using appropriate methods. The parameters of pH determined by pH meter, DO by Winkler method, BOD by oxygen consumed in five days by calculation of the first DO reading (it was taken just after collecting the samples) and the second one (it was taken after 5 days preservation in incubator at 20oC
temperature), COD by Open Reflux method, TDS by Digital conductivity meter (LT-51), TSS using methods developed by APHA (1995), T-NO3 by Spectrophotometric method,
T-PO4 by Ammonium molybdate ascorbic acid
reduction method, Detergent by measurement of linear alkylbenzene sulfonate/LAS (Hanan, 2014), Fecal coliform by MPN method (Shafi, 2013).
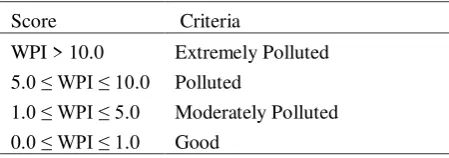
Table 2. Classification of water pollution index*
Score Criteria
WPI > 10.0 Extremely Polluted 5.0 ≤ WPI ≤ 10.0 Polluted
1.0 ≤ WPI ≤ 5.0 Moderately Polluted 0.0 ≤ WPI ≤ 1.0 Good
*Minister of Environment Decree No. 115/2003
2.5. Water Quality Index
Water quality index (WQI) that was calculated based on the comparison of water quality parameters with their respective regulatory standards. WQI was calculated by sum values of multiplying Q-value and weighing factor for all parameters (Equation 1). Q-value (Qi) is indication of water quality relative to 100 of each parameter. Weight score is a value of each parameter relative importance to overall water quality parameters. Weight scores (Wi) of pH, DO, BOD, TSS, T-PO4,
T-NO3 and FC of the Brantas upstream water in
the study area were 0.13, 0.20, 0.13, 0.12, 0.11 and 0.19, respectively. WQI numerically summarizes the information from multiple water quality parameters into a single value (Table 2), can be used to compare data from several sites.
WQI = ∑𝑛𝑖=1𝑄𝑖 𝑥 𝑊𝑖 ……….. (1)
2.6. Water Pollution Index
Water pollution index (WPI) is one of the method to assess water quality in a river ecosystem (Nemerow and Sumitomo, 1970). Later, it was implemented by the Indonesia Ministry of Environment in the Ministerial Decree No.115/2003. The WPI is a function of maximum and average ratios (Ci/Li), where Ci
represents the concentration of parameter i and Li represents the concentration permissible
value of parameter i. The WPI is intended to point out contamination level for each parameter as described in Equation 2. Determination of criteria is based on the score at Table 3.
Table 3. Classification of water quality status
Index range Rating 90 ≤ WQI ≤ 100 Excellent 70 ≤ WQI ≤ 89 Good
50 ≤ WQI ≤ 69 Medium
25 ≤ WQI ≤ 49 Bad WQI < 24 Very Bad
𝑊𝑃𝐼 = √(Ci/Li )2M+(Ci/Li )2R
2 ……….. (2)
3. RESULTS AND DISCUSSION
3.1. Land Evaluation
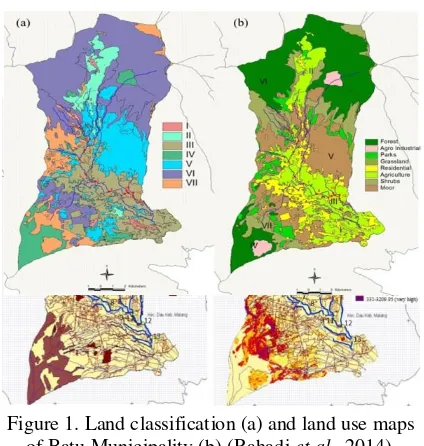
class V, unsuitable land use for settlements, irrigated field, and garden, it should be used for non agriculture, grassing, and perennial. Land class VI is directed for perennial and animal husbandry, therefore this land is unsuitable for settlements and garden. Land class VII is directed for production forest and meadow, therefore such land is unsuitable for unirrigated field, irrigated field, bushes, and garden.
Figure 1. Land classification (a) and land use maps of Batu Municipality (b) (Rahadi et al., 2014).
Figure 2. Soil type (a) and Erosion (b) Maps of Batu City (Rahadi et al., 2014)
The land use within the watershed has great impacts on the water quality of rivers. The water quality of rivers may degrade due to the changes in the land cover patterns within the watershed as human activities increase (Ngoye and Michiwa, 2004). Changes in the land cover and land management practices have been regarded as the key influencing factors behind the alteration of the hydrological system, which lead to the change in runoff as well as the water quality (Yong and Chen, 2002). Figure 2 shown soil type and soil erosion in Batu City. Soil types in Batu City were consisted of Alfisols, Andosols, Entisols, Inceptisols and Mollisols. Andosols and Inceptisols are dominantly distributed in Batu City rather than other type of soils. Alfisol has higher clay fraction and hard soil texture, distributed in Junrejo and
Sumberejo at total area of 211,68 Ha. Alfisols form in semiarid to humid areas, typically under a hardwood forest cover. They have a clay-enriched subsoil and relatively high native fertility. Because of their productivity and abundance, the Alfisols represent one of the more important soil orders for food and fiber production. They are widely used both in agriculture and forestry, and are generally easier to keep fertile than other humid-climate soils. Andisols are soils formed in volcanic ash and defined as soils containing high proportions of glass and amorphous colloidal materials, including allophane, imogolite and ferrihydrite. Because they are generally quite young, andisols typically are very fertile except in cases where phosphorus is easily fixed (this sometimes occurs in the tropics). They can usually support intensive cropping, with areas used for wet rice in Java supporting some of the densest populations. An entisol has no diagnostic horizons, and most are basically unaltered from their parent material, which can be unconsolidated sediment or rock. Entisols are the second most abundant soil order (after inceptisols). Meanwhile, inceptisols are formed quickly through alteration of parent material. They are more developed than entisols. They have no accumulation of clays, iron oxide, aluminium oxide or organic matter. They have an ochric or umbric horizon and a cambic subsurface horizon. Mollisols form in semi-arid to semi-humid areas, typically under a grassland cover. Each soil group does not only contain landuse types, such as forest, bush, grassland, shifting cultivation, upland, and wetland rice, but also types of vegetation. One mapping unit may contain more than one land use types.
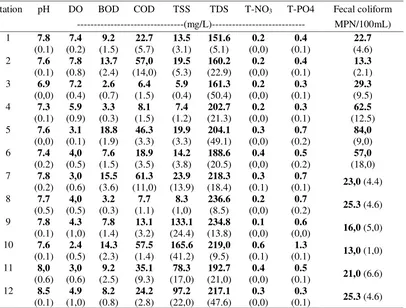
Table 4. Water quality parameter of Brantas upstream watershed Numbers are average, numbers in the bracket shown as standard deviations
3.2. Water Quality Parameters
Some parameters of river water qualities such as pH, DO, BOD, COD, TSS, TDS T-NO3,
T-PO4 and total fecal coliform observed among
12 stations were analyzed by each parameter (Table 4). Water pH of Brantas upstream was vary in the range of 6.9 (at Station 3) to 8.5 (at Station 12) with an average of 7.7. Based on pH data, the water conditions of the river at any stations were slightly alkaline. Among 12 sampling stations, the varied pH were still in the range of water quality standard of pH 6 to 9. DO values for 12 sampling stations along Brantas upstream river were higher average DO in the range between 7.2 and 7.8 mg/L at Station 1, 2 and 3, whereas their DO levels were more than 6 mg/L as a minimum level for drinking purposes regarding to government policy. DO value at Station 4 was a medium level of 5.9 mg/L compared to the other stations that have
law less than 400 mg/L. TDS levels were varied in the range of 151.6 – 236.6 mg/L, but it less than 1000 mg/L as a maximum TDS level for drinking purposes. Total Kjeldahl Nitrogen levels were also lower between 1.0 and 6.0 mg/L, and less than 10 mg/L as a maximum level for drinking purposes. The levels of T-PO4
were in the range of 0.3 – 0.7 mg/L, where the maximum level of 1.0 mg/L for freshwater aquaculture, animal husbandry and agriculture, but only Station 10 had T-PO4 level at 1.3 mg/L
or less than 5.0 mg/L as the maximum level for agriculture purposes. Fecal coliform was found in the range of 13.0 – 84.0 MPN /100 mL in all stations shown lower levels in comparation with the levels regarding to maximum levels of 100 MPN/100mL as a standard level for drinking purposes.
Pearson correlations between several parameters observed among 12 sampling stations shown a positive-negative and strength-weakness correlations (Table 4). Those correlations of between several parameters were significantly different at p<0.01, except for the correlation between pH and BOD was significantly different at p<0.05, and some correlations of COD vs TSS, COD vs Fecal Coliform, and TSS vs Fecal Coliform were found no significant different at p<0.05.
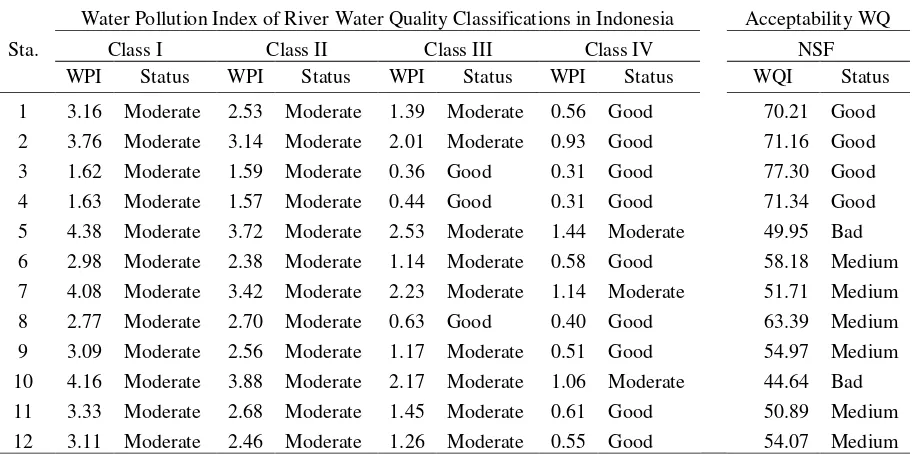
Table 6. Water quality of 12 observed-stations of Brantas upstream watershed
Water Pollution Index of River Water Quality Classifications in Indonesia Acceptability WQ
Sta. Class I Class II Class III Class IV NSF
WPI Status WPI Status WPI Status WPI Status WQI Status 1 3.16 Moderate 2.53 Moderate 1.39 Moderate 0.56 Good 70.21 Good 2 3.76 Moderate 3.14 Moderate 2.01 Moderate 0.93 Good 71.16 Good 3 1.62 Moderate 1.59 Moderate 0.36 Good 0.31 Good 77.30 Good 4 1.63 Moderate 1.57 Moderate 0.44 Good 0.31 Good 71.34 Good 5 4.38 Moderate 3.72 Moderate 2.53 Moderate 1.44 Moderate 49.95 Bad 6 2.98 Moderate 2.38 Moderate 1.14 Moderate 0.58 Good 58.18 Medium 7 4.08 Moderate 3.42 Moderate 2.23 Moderate 1.14 Moderate 51.71 Medium 8 2.77 Moderate 2.70 Moderate 0.63 Good 0.40 Good 63.39 Medium 9 3.09 Moderate 2.56 Moderate 1.17 Moderate 0.51 Good 54.97 Medium 10 4.16 Moderate 3.88 Moderate 2.17 Moderate 1.06 Moderate 44.64 Bad 11 3.33 Moderate 2.68 Moderate 1.45 Moderate 0.61 Good 50.89 Medium 12 3.11 Moderate 2.46 Moderate 1.26 Moderate 0.55 Good 54.07 Medium Class I is for drinking water or any other use with the similar requirements; Class II is for service water, recreational, aquaculture or any other use with the similar requirements; Class III is for fresh water agricultural, farming and any other use with the similar requirements; Class IV is for irrigation and any other use with the similar requirements
Gerstman (2016) classified correlation of two parameters became four classes such as very high correlation (r is equal or higher than 0.7), high correlation (r is equal or higher than 0.5 and less than 0.7), moderate correlation (r is equal or higher than 0.3 and less than 0.5), and low correlation (r is less than 0.3). In this study,
Pearson correlation of BOD and COD shown a very high positive correlations (r) of 0.8779. Meanwhile, high positive correlations were shown in TSS vs T-PO4 and T-NO3 vs T-PO4,
whereas DO vs TDS, DO vs T-NO3, and DO vs
T-PO4 have high negative correlations.
TDS, and COD vs TDS have no correlation. Fecal coliform has low correlation to other parameters, except for TSS was found in negative moderate correlation. It meant that a higher level of TSS was correlated to a lower level of fecal coliform, and a lower level of TSS was correlated to higher level of fecal coliform. Detergent shown low correlation with other parameters, except for pH, DO and TDS given moderate correlations. Correlations of Detergent vs pH and Detergent vs TDS shown a positive, but that of Detergen vs DO was a negative. T-PO4 has a moderate positive
correlation with parameters of BOD, COD and TDS. T-NO3 shown moderate positive
correlation with parameters of BOD, COD and TSS. Moderate correlations were also found in TDS vs pH, TDS vs TSS, TSS vs pH, TSS vs DO, DO vs BOD and DO vs COD.
3.3. Pollution and Quality Indexes of river water
The WPI is applied for evaluating water quality of 12 locations along line of river at different water level (Table 6). The results demonstrated that waters in the floodplain area in four classifications were good to moderate polluted water. In the Class I and II. all stations shown the status of water pollution index at moderate level. Meanwhile. water pollution index status of class III were dominated by moderate level. In contrast. the status of water pollution index in class IV was dominated by good level. Water pollution index in class IV was relatively similar result to NSF-WQI status rather than other classes.
4. REFFERENCES
AMERICAN PUBLIC HEALTH
ASSOCIATION (APHA), American Water Works Association (AWWA), and Water Environment Federation (WEF) (1995). In A. D. Eaton, L.S. Clesceri, and A. E. Greenberg (Eds.), Standard Methods for the Examination of Water and Wastewater, 19th Edition, Washington, D.C.
BAI, J., OUYANG, H., XIAO R. 2010. Spatial variability of soil carbon, nitrogen, and phosphorus content and storage in an
alpine wetland in the Qinghai-Tibet Plateau, China. Australian Journal of Soil Research, vol. 48, no. 8, pp. 730– 736.
GERSTMAN, B.B. 2016. Stat Primer (Version
7.0): Correlation.
http://www.sjsu.edu/faculty/
gerstman/StatPrimer/correlation.pdf. San Jose State University, San Jose, USA.
HANAN, S.A.E. 2014. Aquatic environmental monitoring and removal efficiency of detergents. Water Science, vol. 28, pp. 51-64.
NGOYE E., and MACHIWA, J.F. 2004. The influence of land-use patterns in the Ruvu river watershed onwater quality in the river system. Physics and Chemistry of the Earth, vol. 29, no. 15– 18, pp.1161–1166.
RAHADI, B., NURLAELI, E.E., LUSIANA, N. 2014. Evaluation of carrying capacity layout based on as endorsing human activities in Batu, Indonesia. Project report of Management Model of fpengelolaan daerah aliran sungai berbasis daya dukung lingkungan untuk penataan ruang dan wilayah dalam pemanfaatan sumberdaya alam yang optimal. Unpublished.
SHAFI, S. KAMILI, A.N., SHAH, M.A., AND BANDH, S.A. 2013. Coliform bacterial estimation: A tool for assessing water quality of Manasbal Lake of Kashmir, Himalaya. African Journal of Microbiology Research, Vol. 7(31), pp. 3996-4000.
SLIVA, L. AND WILLIAMS, D.D. 2001. Buffer zone versus whole catchment approaches to studying land use impact on river water quality. Water Research, vol. 35, no. 14, pp. 3462–3472.