Article
http://ijfac.unsri.ac.id
DOI: 1024845/ijfac.v3.i2.54 54
Article Info
Received 21 April 2018 Received in revised 26 May 2018
Accepted 30 May 2018 Available online 08 June 2018
Assessment of Ogan River Water Quality Kabupaten OKU South
Sumatera by NSF-WQI Method
Eriyana Yulistia1, Fauziyah2*, Hermansyah3
1Student at Environmental Management Program, Graduate Program, Universitas Sriwijaya, Bukit Besar Palembang 30139 2Marine Science Department, Faculty of Mathematics and Natural Sciences, Universitas Sriwijaya, Inderalaya, Ogan Ilir,
30662
3Chemistry Department, Faculty of Mathematics and Natural Sciences, Universitas Sriwijaya, Inderalaya, Ogan Ilir, 30662
*Corresponding Author: [email protected]
Abstract
A Study of physicochemical and microbiology analysis in Ogan River Kabupaten Ogan Komering Ulu was carried out in Mei-June 2016. The purpose of this study was to determine the water quality status of Ogan River in Kabupaten OKU South Sumatra. There are several methods can be used in doing the assessment for water quality of a river. The National Sanitation Foundation Water Quality Index (NSF-WQI) will be used in this study. Water quality status was studied at six selected stations to represent different localities with varying anthropogenic discharge. Water samples were taken by purposive sampling method. Physicochemical and microbiology parameters of samples were measured pH, temperature, Turbidity, Total Suspended Solids, Dissolved Oxygen, Biochemical Oxygen Demand, nitrate, Phosphate, and Fecal Coliform following standard method. The result is the river water quality status is medium; the value ranged 56-57. Based on these indices it is concluded that the anthropogenic activities along Ogan River affected the quality of water Ogan River.
Keywords: Ogan River, Water Quality, NSF-WQI
Abstrak (Indonesian)
Penelitian mengenai kualitas air Sungai Ogan, Kabupaten Ogan Komering Ulu dengan cara menganalisis faktor fisika, kimia dan biologi air sungai Ogan telah dilakukan pada bulan Mei-Juni 2016. Tujuan penelitian ini adalah menentukan status kualitas air Sungai Ogan di Kabupaten OKU Sumatera Selatan. Ada beberapa metode yang dapat dipakai untuk mengetahui kualitas air suatu perairan. Dalam penelitian ini, metode yang akan dipakai adalah metode National Sanitation Foundation-Water Quality Index (NSF-WQI). Ada enam lokasi titik sampling yang dipilih dengan metode purposive sampling. Ada sembilan parameter fisika, kimia dan biologi yang diukur, yaitu suhu, kekeruhan, TSS, pH, DO, BOD, Nitrat, fosfat dan coliform. Hasilnya untuk status kualitas air Sungai Ogan adalah medium atau tercemar sedang dengan nilai berkisar 56-57. Berdasarkan hasil yang didapat, disimpulkan bahwa aktivitas masyarakat di sepanjang sungai Ogan memberikan pengaruh pada kualitas air sungai Ogan.
Kata Kunci: Sungai Ogan, Kualitas Air, NSF-WQI
INTRODUCTION
A clean river without contamination is a vital thing for life. Since along ago, river has an important role in human life, for drinking water, irrigation, etc. The river deserves attention, to keep its water quality, so it can be used properly and continuously, as discussed by Marganingrum [8]. In many develop and
under develop countries, the river is used as a station of waste, either domestic or industries waste. The waste contains many pollutants that contribute to the degradation of river’s water quality, as discussed by Effendi [5].
DOI: 1024845/ijfac.v3.i2.54 55 Baturaja City into Baturaja Barat and Baturaja Timur.
Ogan river flows through many villages, which are Pasar, Kebun Jati, Kemalaraja, Air Gading, Pangeran Hajib, Sukajadi, and some other villages in Kabupaten OKU. Ogan river water is used for drinking water, household activities, irrigation and fishing plantation. Even more become water intake for Perusahaan Air Minum Baturaja. Along DAS Ogan river, there are many farming land activities, Rumah Sakit Umum Daerah Ibnu Sutowo, home industries such as tahu and tempe, car washing, and big industries such as PT Minanga Ogan and PT Pertamina Geothermal Energi. Waste water from these industries and domestic sewage along Ogan River will affect the water quality of Ogan river. Because of this reason, an assessment to verify water quality of Ogan river is needed. The aim of this study is to assess status of Ogan river water quality based on the National Sanitation Foundation-Water Quality Index method, whether Ogan river water is acceptable for various purposes as domestic use, agriculture, and even drinking.
MATERIALS AND METHODS
Sampling Activity
Water samples were taken from Ogan river, Kabupaten OKU INDUK, South Sumatra. Samples were taken from six different stations. The stations were selected due to purposive sampling method. Then the geographical location of the sampling stations was determined by GPS. Table 1 and 2 show the geographical coordinates of the selected stations. The positions of the sampling stations are also shown in Figure 1.
Table 1. Sampling Location Coordinates in Ogan River
Stations Latitude Longitude
station 1 04o 14' 53.1" 104o 16' 04.4" station 2 04o 14' 50.9" 104o 16' 13.6" station 3 04o 13' 06.7" 104o 16' 50.8" station 4 04o 12' 33.0" 104o 16' 68.2" station 5 04o 11' 30.2" 104o 17' 07.3" station 6 04o 10' 13.6" 104o 17' 44.0"
Sampling activities were done twice at low tide
and high tide. Water samples were collected on
May – June 2016. Samples were collected by grab sampling method and measured both in-situ and
ex-situ (BTKL Laboratory Palembang) with standard prosedures
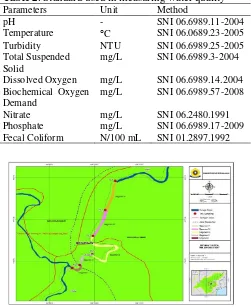
Table 2. Standard used in measuring water quality
Parameters Unit Method
pH - SNI 06.6989.11-2004
Temperature C SNI 06.0689.23-2005 Turbidity NTU SNI 06.6989.25-2005 Total Suspended
Solid
mg/L SNI 06.6989.3-2004
Dissolved Oxygen mg/L SNI 06.6989.14.2004 Biochemical Oxygen
Demand
mg/L SNI 06.6989.57-2008
Nitrate mg/L SNI 06.2480.1991
Phosphate mg/L SNI 06.6989.17-2009 Fecal Coliform N/100 mL SNI 01.2897.1992
Figure 1. The Position of Sampling Station
Calculating the Index
In this study, calculation of NSFWQI index used the online NSFWQI Calculator Software
(http://www.water-research.net/watrqualityindex/index.htm). Then it will be summed with the following equation:
WQI = Σ_(i=1)^n Qi Wi (1)
Whereas:
WQI = Water Quality Index Qi = Index Quality
Wi = Weight or degree of priority of the factor n = Total Parameter
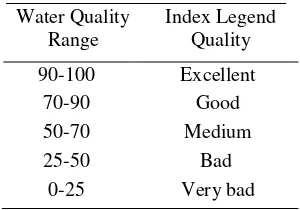
Then the NSF Water Quality Index of samples were confirmed according to NSF WQI Legend Table as shown in Table 3.
DOI: 1024845/ijfac.v3.i2.54 56 Table 3. NSF-Water Quality Index Legend
Water Quality significant influence on the aquatic ecosystem. Most of the aquatic animals and plants survive in a certain range of temperatures but not tolerate extreme changes [10].
The Temperature in Ogan River is ranging from 26 0C to 28 0C during low tide and high tide, and it was considered in a good condition. Sunlight exposure is probably the main factor that holds big effect that influences water temperature. According to South Sumatra Governor Regulation no 16/2005, defines temperature deviation is 3 C. So, the temperature in Ogan River’s water in six stations still meet the quality standard, both in low tide and high tide.
Turbidity
Turbidity caused by impurities may include: clay and silt (runoff), organic and inorganic matter (by discharged waste), microorganism and other organic lives [11]. High level of turbidity has a bad influence on the aquatic ecosystem. High level of turbidity will make sunlight exposure cannot penetrate the water. Turbidity is calculated by using light scattering in water column due to suspended solids. High turbidity will cause more water darkness. If water became very dull, it’s ability in maintaining most of plants and organisms will be removed [4].
Turbidity of water in Ogan River ranged 11-26 NTU. Turbidity in upstream of Ogan River is higher than turbidity in downstream. This is affected by cultivation activity that contributes to soil loss runoff, thus increase turbidity of the water in upstream area of Ogan River. But, in downstream area, these soil
articles sedimentation. Turbidity is one of an abiotic factor that related to sedimentation [2].
Total Suspended Solids
TSS in Ogan River ranged from 10-19 mg/L. The highest TSS is found in upstream and the lowest is found in downstream area. TSS is followed by turbidity linearly. There exists a little relationship between the value of turbidity and total solid [2]. According to the South Sumatra Governor Regulation no 16/2005, TSS in Ogan River still met the quality absorbance by organism. pH under 4.8 and above 9.2 is lethal to many aquatic organisms [3]. pH of water in Ogan River ranged 6.8-7.7. According to South Sumatra Governor Regulation no 16/2005, the quality standard for pH is 6-9 (Class I), that means pH in Ogan River water still fulfilled the standard.
Dissolved Oxygen
Oxygen is needed by aquatic organisms for respiration. Unpolluted river DO level is ranged between 80%-100% [5]. DO concentration below 5 mg/L may adversely affect the performance and survival of biological communities, and below 2mg/L may lead to fish mortality. Water without adequate DO may consider wastewater [1].
The highest DO level is found in station 2. Station 2 is an area which its substance is rock and the stream flow higher. Water turbulence in upstream has been effective increasing DO level [6]. According to Governor’s provision, the minimum threshold value for DO is 6 mg/L. Station 3,4,5,6 didn’t reach the quality standard.
Biochemical Oxygen Demand
DOI: 1024845/ijfac.v3.i2.54 57 Table 4. Water Quality of Ogan River in High Tide
No Parameters Unit Stations
1 2 3 4 5 6
1. Temperature 0C 26 27 26 27 27 26
2. Turbidity NTU 26.7 24.7 22.3 18.3 16.2 17.1
3. TSS mg/L 19.3 19.3 19.7 16.3 12.0 13.7
4. pH - 7.6 7.0 7.1 7.3 7.5 7.7
5. DO mg/L 6.2 6.9 5.7 4.6 5.2 5.5
6. BOD mg/L 1.18 1.48 1.64 1.47 1.62 1.62
7. Nitrate mg/L 0.06 0.03 0.12 0.09 0.12 0.17
8. Phosphate mg/L 0.06 0.08 0.16 0.2 0.16 0.1
9. Coliform N/100 mL 940 933 900 1433 1400 1500
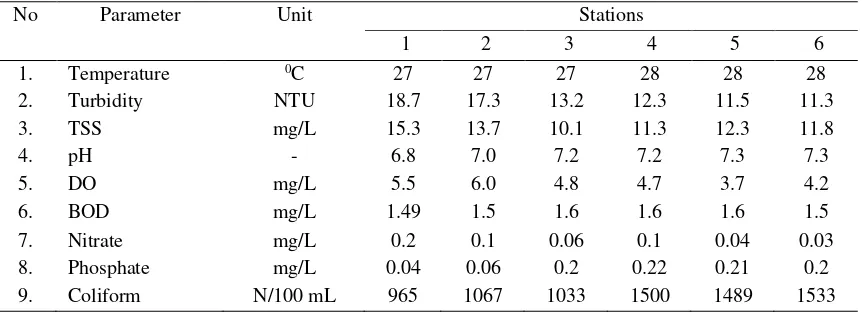
Table 5. Water Quality of Ogan River in Low Tide
No Parameter Unit Stations
1 2 3 4 5 6
1. Temperature 0C 27 27 27 28 28 28
2. Turbidity NTU 18.7 17.3 13.2 12.3 11.5 11.3
3. TSS mg/L 15.3 13.7 10.1 11.3 12.3 11.8
4. pH - 6.8 7.0 7.2 7.2 7.3 7.3
5. DO mg/L 5.5 6.0 4.8 4.7 3.7 4.2
6. BOD mg/L 1.49 1.5 1.6 1.6 1.6 1.5
7. Nitrate mg/L 0.2 0.1 0.06 0.1 0.04 0.03
8. Phosphate mg/L 0.04 0.06 0.2 0.22 0.21 0.2
9. Coliform N/100 mL 965 1067 1033 1500 1489 1533
Nitrate
Nitrate concentration in Ogan River ranged 0.03-0.2 mg/L. The highest nitrate concentration is found in station 1. In this area, there is tofu industry, carwash and agriculture. Diffuse pollution might occur by domestic wastewater and agricultural landscape drainage water, causing an increase of nitrate and organic matters in water [12]. As more land converted to agricultural site, pollution of nitrate was expected to be increased in recent years [7]. According to South Sumatra Governor Regulation no 16/2005, standard quality threshold for nitrate is 0.5 mg/L maximum. Hence, the water still meets the criteria required.
Phosphate
Phosphorus is a component of sewage, as the element is essential in metabolism, and it is always present in the animal metabolic waste. Phosphorus occurs in its fully oxidized (phosphate) state in water [2]. Phosphate concentration in Ogan River is ranged between 0.04-0.22 mg/L. The highest concentration is found in station 4. Station 4 is dominated by urban
residence. According to South Sumatra Governor Provision no 16/2005, quality standard for phosphate is 0.2 mg/L (class I). So, phosphate concentration in station 4 have reached the limit (high tide). In low tide, station 3, 4, 5, 6 has reached the limit.
Fecal coliform
Coliform bacteria are indicator organism for the presence of pathogens in the water samples. The result from laboratory showed that all water samples from Ogan River have covered the standard quality in South Sumatra Governor Provision no 16/2005. The highest concentration of coliform was found in station 6, which reached 150/ml in high tide. While in low tide, coliform reached 153/ml. The high levels of fecal coliforms indicated the entry of sewage water [6].
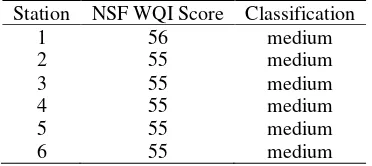
Ogan River Quality Status According to NSF QWI
DOI: 1024845/ijfac.v3.i2.54 58 almost the same. The NSF WQI score ranged 55-56
and can be classified as medium.
Table 6. NSF WQI classification for Ogan River A. Ogan River NSF WQI classification in high tide
Station NSF WQI Score Classification
1 56 medium
B. Ogan River NSF WQI classification in low tide Station NSF WQI Score Classification
1 55 medium
Parameters which are out of South Sumatra Governor provision no 16/2005 (class I) were DO, Phosphate and Fecal Coliform. That might due to anthropogenic activities, especially habits of people who lives along Ogan River using Ogan River as drainage.
CONCLUSION
Based on NSF WQI, water quality in Ogan River has been classified as medium. There are some parameters reaching out the South Sumatra Governor Provision no 16/2005 (class I). Those parameters were DO at station 3, 4, 5, 6; Phosphate at station 3, 4, 5, 6; Fecal Coliform at all sampling stations. This condition shows that the anthropogenic activities along Ogan River have affected the quality of water in Ogan River.
REFERENCES
1. A. Behmanesh, Y. Feizaabadi, “Water Quality Index of Babolrood River in Mazandaran, Iran,”
Int, J. Agric. Corp Sci., vol. 5, no. 19, pp. 2285-European Union water Framework Directive,”
Asian J. Chem., 26 (14):4219-4223, 2014.
4. G. Darvishi, M. Dadashpour, M. Rokni, G. Kootenaei, “Investigation of Qualitative Condition of Nekarud River and Tajan River by NSFQWI Index,” Eur. Online J. Nat. Soc. Sci.,
vol. 4, no. 1, pp. 85-90, 2015.
5. H. Effendi, A.A., Kristianiarso, E.M. Adiwilaga, “Karakteristik Kualitas Air Sungai Cihideung, Kabupaten Bogor, Jawa Barat,” Ecolab Jurnal. vol. 7, no. 2, pp. 81-92, 2013.
6. A.G. Habib, S.H. Khatami, “Survey of the water quality of Bahar County Stream (Iran) by NSFWQI,”Environ. Conserv. J., 16 (1):395-403, 2015.
7. M. Khalik, P. Abdullah, A. Ameruddin, N. Padli, “Physicochemical Analysis on Water Quality Status of Bertam River in Cameron Highlands Malaysia,” J. Water Environ. Sci., vol. 4, no. 4, pp. 488-495, 2013
8. D. Marganingrum, “Penilaian Mutu Air Sungai dengan Pendekatan Perbedaan Hasil dari Dua Metode Indeks,” Bul. Geo. Tata Lingk., vol. 23, no. 3, pp. 105-114, 2013.
9. A.H. Millah, C. Retnaningdyah, “Pemantauan Kualitas Fisika Kimia Air di Mata Air Nyolo Curah Glogo dan Curah Langlang Desa Ngenep Kecamatan Karangploso Kabupaten Malang,” J. Biotrop., vo. 3, no. 2, pp. 60-64, 2015.
10. J. Noorbakhsh, E. Seyedmahalleh, G. Darvishi, N. Merhdadi, “An Evaluation of Water Quality from Siahrod River, Haraz River, and Babolrood River by NSFWQI Index,” Current World Environ., vol. 9, no. 1, pp. 59-64, 2014.
11. S. Parastar, A. Jalilzadeh, Y. Poureshg, A. Hashemi, H. Hossini, “Assessment of National Sanitation Foundation Water Quality Index and Other Characterization of Mamloo Dam and Supporting Streams,” Inter. J. Environ. Health Eng., vol. 4, no. 3, pp. 1-7, 2015.