In 1993 the World Health Organization (WHO) undertook a
comprehensive review of the uses and interpretation of
anthropometric references. The review concluded that the
NCHS/WHO growth reference, which had been recommended for
international use since the late 1970s, did not adequately represent
early childhood growth and that new growth curves were necessary.
The World Health Assembly endorsed this recommendation in 1994.
The WHO Multicentre Growth Reference Study (MGRS) was
undertaken in response to that endorsement and implemented between
1997 and 2003 to generate new curves for assessing the growth and
development of children the world over. The MGRS collected
primary growth data and related information from 8440 healthy
breastfed infants and young children from diverse ethnic backgrounds
and cultural settings (Brazil, Ghana, India, Norway, Oman and USA).
The growth standards developed based on these data and presented in
this report provide a technically robust tool that represents the best
description of physiological growth for children under five years of
age. The standards depict normal early childhood growth under
optimal environmental conditions and can be used to assess children
everywhere, regardless of ethnicity, socioeconomic status and type of
feeding.
WHO Child Growth Standards
WHO Child Growth Standards
1 year
2 years
3 years
4 years
5 years
Head circumference-for-age, arm circumference-for-age,
triceps skinfold-for-age and subscapular skinfold-for-age
Methods and development
Department of Nutrition for
Health and Development
W
WH
HO
O C
C
hi
h
i
l
l
d
d
Gr
G
r
o
o
w
w
t
t
h
h
St
S
t
a
a
nd
n
da
a
r
r
ds
d
s
Head circumference-for-age, arm circumference-for-age,
triceps skinfold-for-age and subscapular skinfold-for-age
WHO Library Cataloguing-in-Publication Data
WHO child growth standards : head age, arm
circumference-for-age, triceps skinfold-for-age and subscapular skinfold-for-age : methods and
development.
Coordinating team: Mercedes de Onis ... [et al.].
1.Anthropometry. 2.Anthropometry - methods. 3.Body size - standards. 4.Child
development. 5.Growth. 6.Reference standards. 7.Nutrition assessment. I.de Onis,
Mercedes. II.World Health Organization. III.Title: World Health Organization child
growth standards.
ISBN 978 92 4 154718 5
(NLM classification: WS 103)
© World Health Organization 2007
All rights reserved. Publications of the World Health Organization can be obtained from WHO Press, World Health Organization, 20 Avenue Appia, 1211 Geneva 27, Switzerland (tel.: +41 22 791 3264; fax: +41 22 791 4857; e-mail: [email protected]). Requests for permission to reproduce or translate WHO publications – whether for sale or for noncommercial distribution – should be addressed to WHO Press, at the above address (fax: +41 22 791 4806; e-mail: [email protected]).
The designations employed and the presentation of the material in this publication do not imply the expression of any opinion whatsoever on the part of the World Health Organization concerning the legal status of any country, territory, city or area or of its authorities, or concerning the delimitation of its frontiers or boundaries. Dotted lines on maps represent approximate border lines for which there may not yet be full agreement.
The mention of specific companies or of certain manufacturers’ products does not imply that they are endorsed or recommended by the World Health Organization in preference to others of a similar nature that are not mentioned. Errors and omissions excepted, the names of proprietary products are distinguished by initial capital letters.
All reasonable precautions have been taken by the World Health Organization to verify the information contained in this publication. However, the published material is being distributed without warranty of any kind, either expressed or implied. The responsibility for the
interpretation and use of the material lies with the reader. In no event shall the World Health Organization be liable for damages arising from its use.
-
iii
-Members of the WHO Multicentre Growth Reference Study Group
Coordinating Team
Mercedes de Onis [Study Coordinator], Adelheid Onyango, Elaine Borghi, Amani Siyam, Alain Pinol (Department of Nutrition for Health and Development, World Health Organization).
Executive Committee
Cutberto Garza [Chair], Mercedes de Onis, Jose Martines, Reynaldo Martorell, Cesar G. Victora (up to October 2002), Maharaj K. Bhan (from November 2002).
Steering Committee
Coordinating Centre (WHO, Geneva): Mercedes de Onis, Jose Martines, Adelheid Onyango, Alain Pinol.
Investigators (by country): Cesar G. Victora and Cora Luiza Araújo (Brazil), Anna Lartey and William B. Owusu (Ghana), Maharaj K. Bhan and Nita Bhandari (India), Kaare R. Norum and Gunn-Elin Aa. Bjoerneboe (Norway), Ali Jaffer Mohamed (Oman), Kathryn G. Dewey (USA).
United Nations Agency Representatives: Cutberto Garza (UNU), Krishna Belbase (UNICEF).
Advisory Group
Maureen Black, Wm. Cameron Chumlea, Tim Cole, Edward Frongillo, Laurence Grummer-Strawn, Reynaldo Martorell, Roger Shrimpton, Jan Van den Broeck. For the work presented in this document, Huiqi Pan, Robert Rigby, Mikis Stasinopoulos and Stef van Buuren, participated in an advisory capacity.
Participating countries and investigators
Brazil: Cora Luiza Araújo, Cesar G. Victora, Elaine Albernaz, Elaine Tomasi, Rita de Cássia Fossati da Silveira, Gisele Nader (Departamento de Nutrição and Departamento de Medicina Social, Universidade Federal de Pelotas; and Núcleo de Pediatria and Escola de Psicologia, Universidade Católica de Pelotas).
Ghana: Anna Lartey, William B. Owusu, Isabella Moses, Veronica Gomez, Charles Sagoe-Moses (Department of Nutrition and Food Science, University of Ghana; and Ghana Health Service). India: Nita Bhandari, Maharaj K. Bhan, Sunita Taneja, Temsunaro Rongsen, Jyotsna Chetia, Pooja Sharma, Rajiv Bahl (All India Institute of Medical Sciences).
Norway: Gunn-Elin Aa. Bjoerneboe, Anne Baerug, Elisabeth Tufte, Kaare R. Norum, Karin Rudvin, Hilde Nysaether (Directorate of Health and Social Affairs; National Breastfeeding Centre, Rikshospitalet University Hospital; and Institute for Nutrition Research, University of Oslo).
Oman: Ali Jaffer Mohamed, Deena Alasfoor, Nitya S. Prakash, Ruth M. Mabry, Hanadi Jamaan Al Rajab, Sahar Abdou Helmi (Ministry of Health).
- iv -
Acknowledgements
The WHO Child Growth Standards were constructed by the Coordinating Team in the Department of Nutrition for Health and Development of the World Health Organization.
The Study Group is indebted to the parents, children and more than 200 field staff that participated in the WHO Multicentre Growth Reference Study. The generous contribution of many individuals that provided expertise and advice was also crucial to the development of the growth standards.
-
v
-Contents
Executive summary...xv
1. Introduction...1
2. Methodology ...3
2.1 Design of the WHO Multicentre Growth Reference Study...3
2.2 Anthropometry methods...3
2.3 Sample description ...4
2.4 Data cleaning procedures and exclusions...5
2.5 Statistical methods for constructing the growth curves...6
3. Construction of the head circumference-for-age standards ...7
3.1 Indicator-specific methodology...7
3.3 Head circumference-for-age for girls ...31
3.3.1 Sample size ...31
3.3.2 Model selection and results...31
3.3.3 WHO standards ...43
Charts ...44
Tables...46
3.4 Comparisons between boys and girls ...54
3.4.1 WHO ...55
4. Construction of the arm circumference-for-age standards...57
4.1 Indicator-specific methodology...57
4.3 Arm circumference-for-age for girls ...81
4.3.1 Sample size ...81
4.3.2 Model selection and results...81
4.3.3 WHO standards ...96
Charts ...97
Tables...99
4.4 Comparisons between boys and girls ...105
4.4.1 WHO ...106
5. Construction of the triceps skinfold-for-age standards ...107
5.1 Indicator-specific methodology...107
5.3 Triceps skinfold-for-age for girls ...131
- vi -
5.3.2 Model selection and results ... 131
5.3.3 WHO standards ... 145
Charts ... 146
Tables ... 148
5.4 Comparisons between boys and girls ... 154
5.4.1 WHO ... 155
6. Construction of the subscapular skinfold-for-age standards ... 157
6.1 Indicator-specific methodology... 157
6.2 Subscapular skinfold-for-age for boys ... 157
6.2.1 Sample size... 157
6.2.2 Model selection and results ... 157
6.2.3 WHO standards ... 172
Charts ... 173
Tables ... 175
6.3 Subscapular skinfold-for-age for girls ... 181
6.3.1 Sample size... 181
6.3.2 Model selection and results ... 181
6.3.3 WHO standards ... 198
Charts ... 199
Tables ... 201
6.4 Comparisons between boys and girls ... 207
6.4.1 WHO ... 208
7. Computation of centiles and z-scores for head circumference-for-age, arm circumference -for-age, triceps skinfold-for-age, subscapular skinfold-for-age... 209
8. Conclusion... 213
9. Bibliography... 215
-
vii
-Figures
Figure 1 Fitting of µ and σ curves of Model 1 for head circumference-for-age for boys
(dotted line) and their respective sample estimates (points with solid line) ...9
Figure 2 Centile residuals from fitting Model 1 for head circumference-for-age from 0 to 24 months for boys...10
Figure 3 Centile residuals from fitting Model 1 for head circumference-for-age from 24 to 71 months for boys...10
Figure 4 Worm plots of z-scores for Model 1 for head circumference-for-age for boys ...11
Figure 5 3rd, 10th, 50th, 90th, 97th smoothed centile curves and empirical values: head circumference-for-age for boys from birth to 24 months...16
Figure 6 5th, 25th, 50th, 75th, 95th smoothed centile curves and empirical values: head circumference-for-age for boys from birth to 24 months...17
Figure 7 3rd, 10th, 50th, 90th, 97th smoothed centile curves and empirical values: head circumference-for-age for boys from 24 to 71 months ...18
Figure 8 5th, 25th, 50th, 75th, 95th smoothed centile curves and empirical values: head circumference-for-age for boys from 24 to 71 months ...19
Figure 9 WHO head circumference-for-age z-scores for boys from birth to 60 months...21
Figure 10 WHO head circumference -for-age percentiles for boys from birth to 60 months ...22
Figure 11 Fitting of the µ and σ curves of Model 1 for head circumference-for-age for girls (dotted line) and their respective sample estimates (points with solid line) ...33
Figure 12 Centile residuals from fitting Model 1 for head circumference-for-age from 0 to 24 months for girls ...34
Figure 13 Centile residuals from fitting Model 1 for head circumference-for-age from 24 to 71 months for girls ...34
Figure 14 Worm plots of z-scores for Model 1 for head circumference-for-age for girls...37
Figure 15 3rd, 10th, 50th, 90th, 97th smoothed centile curves and empirical values: head circumference-for-age for girls from birth to 24 months ...39
Figure 16 5th, 25th, 50th, 75th, 95th smoothed centile curves and empirical values: head circumference-for-age for girls from birth to 24 months ...40
Figure 17 3rd, 10th, 50th, 90th, 97th smoothed centile curves and empirical values: head circumference-for-age for girls from 24 to 71 months...41
Figure 18 5th, 25th, 50th, 75th, 95th smoothed centile curves and empirical values: head circumference-for-age for girls from 24 to 71 months...42
Figure 19 WHO head circumference-for-age z-scores for girls from birth to 60 months ...44
Figure 20 WHO head circumference-for-age percentiles for girls from birth to 60 months...45
Figure 21 Comparison of boys' and girls' head circumference-for-age z-scores...55
Figure 22 Worm plots of z-scores for Model 1 for arm circumference-for-age for boys...59
Figure 23 Fitting of the µ, σ, and ν curves of Model 2 for arm circumference-for-age for boys from 3 to 71 months (dotted line) and their respective sample estimates (points with solid line) ...62
- viii -
Figure 25 Centile residuals from fitting Model 2 for arm circumference-for-age from 24 to 71
months for boys ... 63
Figure 26 Worm plots of z-scores for Model 2 for arm circumference-for-age for boys ... 64
Figure 27 3rd, 10th, 50th, 90th, 97th smoothed centile curves and empirical values: arm circumference-for-age for boys from 3 to 24 months... 68
Figure 28 5th, 25th, 50th, 75th, 95th smoothed centile curves and empirical values: arm circumference-for-age for boys from 3 to 24 months... 69
Figure 29 3rd, 10th, 50th, 90th, 97th smoothed centile curves and empirical values: arm circumference-for-age for boys from 24 to 71 months... 70
Figure 30 5th, 25th, 50th, 75th, 95th smoothed centile curves and empirical values: arm circumference-for-age for boys from 24 to 71 months... 71
Figure 31 WHO arm circumference-for-age z-scores for boys from 3 to 60 months... 73
Figure 32 WHO arm circumference-for-age percentiles for boys from 3 to 60 months... 74
Figure 33 Worm plots of z-scores for Model 1 for arm circumference-for-age for girls ... 83
Figure 34 Fitting of the µ, σ, and ν curves of Model 2 for arm circumference-for-age for girls from 3 to 71 months (dotted line) and their respective sample estimates (points with solid line)... 86
Figure 35 Centile residuals from fitting Model 2 for arm circumference-for-age from 3 to 24 months for girls ... 87
Figure 36 Centile residuals from fitting Model 2 for arm circumference-for-age from 24 to 71 months for girls ... 87
Figure 37 Worm plots of z-scores for Model 2 for arm circumference-for-age for girls ... 88
Figure 38 3rd, 10th, 50th, 90th, 97th smoothed centile curves and empirical values: arm circumference-for-age for girls from 3 to 24 months ... 92
Figure 39 5th, 25th, 50th, 75th, 95th smoothed centile curves and empirical values: arm circumference-for-age for girls from 3 to 24 months ... 93
Figure 40 3rd, 10th, 50th, 90th, 97th smoothed centile curves and empirical values: arm circumference-for-age for girls from 24 to 71 months ... 94
Figure 41 5th, 25th, 50th, 75th, 95th smoothed centile curves and empirical values: arm circumference-for-age for girls from 24 to 71 months ... 95
Figure 42 WHO arm circumference-for-age z-scores for girls from 3 to 60 months ... 97
Figure 43 WHO arm circumference-for-age percentiles for girls from 3 to 60 months ... 98
Figure 44 Comparison of boys' and girls' arm circumference-for-age z-scores ... 106
Figure 45 Worm plots of z-scores for Model 1 for triceps skinfold-for-age for boys ... 109
Figure 46 Fitting of the µ, σ, and ν curves of Model 2 for triceps skinfold-for-age for boys from 3 to 71 months (dotted line) and their respective sample estimates (points with solid line)... 112
Figure 47 Centile residuals from fitting Model 2 for triceps skinfold-for-age from 3 to 24 months for boys ... 113
Figure 48 Centile residuals from fitting Model 2 for triceps skinfold-for-age from 24 to 71 months for boys ... 113
-
ix
-Figure 50 3rd, 10th, 50th, 90th, 97th smoothed centile curves and empirical values: triceps
skinfold-for-age for boys from 3 to 24 months ...118
Figure 51 5th, 25th, 50th, 75th, 95th smoothed centile curves and empirical values: triceps skinfold-for-age for boys from 3 to 24 months ...119
Figure 52 3rd, 10th, 50th, 90th, 97th smoothed centile curves and empirical values: triceps skinfold-for-age for boys from 24 to 71 months ...120
Figure 53 5th, 25th, 50th, 75th, 95th smoothed centile curves and empirical values: triceps skinfold-for-age for boys from 24 to 71 months ...121
Figure 54 WHO triceps skinfold-for-age z-scores for boys from 3 to 60 months...123
Figure 55 WHO triceps skinfold-for-age percentiles for boys from 3 to 60 months...124
Figure 56 Worm plots of z-scores for Model 1 for triceps skinfold-for-age for girls ...133
Figure 57 Fitting of the µ, σ, and ν curves of Model 2 for triceps skinfold-for-age for girls from 3 to 71 months (dotted line) and their respective sample estimates (points with solid line) ...135
Figure 58 Centile residuals from fitting Model 2 for triceps skinfold-for-age from 3 to 24 months for girls ...136
Figure 59 Centile residuals from fitting Model 2 for triceps skinfold-for-age from 24 to 71 months for girls ...136
Figure 60 Worm plots of z-scores for Model 2 for triceps skinfold-for-age for girls ...137
Figure 61 3rd, 10th, 50th, 90th, 97th smoothed centile curves and empirical values: triceps skinfold-for-age for girls from 3 to 24 months ...141
Figure 62 5th, 25th, 50th, 75th, 95th smoothed centile curves and empirical values: triceps skinfold-for-age for girls from 3 to 24 months ...142
Figure 63 3rd, 10th, 50th, 90th, 97th smoothed centile curves and empirical values: triceps skinfold-for-age for girls from 24 to 71 months ...143
Figure 64 5th, 25th, 50th, 75th, 95th smoothed centile curves and empirical values: triceps skinfold-for-age for girls from 24 to 71 months ...144
Figure 65 WHO triceps skinfold-for-age z-scores for girls from 3 to 60 months ...146
Figure 66 WHO triceps skinfold-for-age percentiles for girls from 3 to 60 months ...147
Figure 67 Comparison of boys' and girls' triceps skinfold-for-age z-scores ...155
Figure 68 Worm plots of z-scores for Model 1 for subscapular skinfold-for-age for boys...159
Figure 69 Fitting of the µ, σ, and ν curves of Model 2 for subscapular skinfold-for-age for boys from 3 to 71 months (dotted line) and their respective sample estimates (points with solid line) ...162
Figure 70 Centile residuals from fitting Model 2 for subscapular skinfold-for-age from 3 to 24 months for boys...163
Figure 71 Centile residuals from fitting Model 2 for subscapular skinfold-for-age from 24 to 71 months for boys...163
Figure 72 Worm plots of z-scores for Model 2 for subscapular skinfold-for-age for boys...164
Figure 73 3rd, 10th, 50th, 90th, 97th smoothed centile curves and empirical values: subscapular skinfold-for-age for boys from 3 to 24 months ...168
- x -
Figure 75 3rd, 10th, 50th, 90th, 97th smoothed centile curves and empirical values: subscapular
skinfold-for-age for boys from 24 to 71 months ... 170
Figure 76 5th, 25th, 50th, 75th, 95th smoothed centile curves and empirical values: subscapular skinfold-for-age for boys from 24 to 71 months ... 171
Figure 77 WHO subscapular skinfold-for-age z-scores for boys from 3 to 60 months ... 173
Figure 78 WHO subscapular skinfold-for-age percentiles for boys from 3 to 60 months... 174
Figure 79 Worm plots of z-scores for Model 1 for subscapular skinfold-for-age for girls ... 183
Figure 80 Fitting of the µ, σ, and ν curves of Model 2 for subscapular skinfold-for-age for girls from 3 to 71 months (dotted line) and their respective sample estimates (points with solid line)... 186
Figure 81 Centile residuals from fitting Model 2 for subscapular skinfold-for-age from 3 to 24 months for girls ... 187
Figure 82 Centile residuals from fitting Model 2 for subscapular skinfold-for-age from 24 to 71 months for girls ... 187
Figure 83 Worm plots of z-scores for Model 2 for subscapular skinfold-for-age for girls ... 188
Figure 84 Comparison of the fitted growth curves using Model 2 (solid line) with the model adjusting for kurtosis (dashed line) ... 191
Figure 85 3rd, 10th, 50th, 90th, 97th smoothed centile curves and empirical values: subscapular skinfold-for-age for girls from 3 to 24 months... 194
Figure 86 5th, 25th, 50th, 75th, 95th smoothed centile curves and empirical values: subscapular skinfold-for-age for girls from 3 to 24 months... 195
Figure 87 3rd, 10th, 50th, 90th, 97th smoothed centile curves and empirical values: subscapular skinfold-for-age for girls from 24 to 71 months... 196
Figure 88 5th, 25th, 50th, 75th, 95th smoothed centile curves and empirical values: subscapular skinfold-for-age for girls from 24 to 71 months... 197
Figure 89 WHO subscapular skinfold-for-age z-scores for girls from 3 to 60 months ... 199
Figure 90 WHO subscapular skinfold-for-age percentiles for girls from 3 to 60 months ... 200
Figure 91 Comparison of boys' and girls' subscapular skinfold-for-age z-score ... 208
-
xi
-Tables
Table 1 Number of observations used in the construction of the WHO child growth standards
by sex and anthropometric indicator ...5
Table 2 Longitudinal sample sizes for head circumference-for-age for boys ...7
Table 3 Cross-sectional sample sizes for head circumference-for-age for boys ...7
Table 4 Global deviance (GD) for models within the class BCPE(x=ageλ, df(µ)=9, df(σ)=4, ν=1, τ=2) for head circumference-for-age for boys ...8
Table 5 Goodness-of-fit summary for models using the BCPE distribution with fixed ν=1 and τ=2 for head circumference-for-age for boys...8
Table 6 Observed proportions of children with measurements below the fitted centiles from Model 1, head circumference-for-age for boys...12
Table 7 Q-test for z-scores from Model 1 [BCPE(x=age0.20, df(µ)=9, df(σ)=5, ν=1, τ=2)] for head circumference-for-age for boys ...14
Table 8 Head circumference-for-age for boys, age in weeks...23
Table 9 Head circumference-for-age for boys, age in years and months ...25
Table 10 Longitudinal sample sizes for head circumference-for-age for girls ...31
Table 11 Cross-sectional sample sizes for head circumference-for-age for girls ...31
Table 12 Global deviance (GD) for models within the class BCPE(x=ageλ, df(µ)=9, df(σ)=4, ν=1, τ=2) for head circumference-for-age for girls...32
Table 13 Goodness-of-fit summary for models using the BCPE distribution with fixed ν=1 and τ=2 for head circumference-for-age for girls ...32
Table 14 Observed proportions of children with measurements below the fitted centiles from Model 1, head circumference-for-age for girls ...35
Table 15 Q-test for z-scores from Model 1 [BCPE(x=age0.20, df(µ)=9, df(σ)=2, ν=1, τ=2)] for head circumference-for-age for girls...38
Table 16 Head circumference-for-age for girls, age in weeks ...46
Table 17 Head circumference-for-age for girls, age in years and months ...48
Table 18 Longitudinal sample sizes for arm circumference-for-age for boys ...57
Table 19 Cross-sectional sample sizes for arm circumference-for-age for boys ...57
Table 20 Global deviance (GD) for models within the class BCPE(x=ageλ, df(µ)=9, df(σ)=4, df(ν)=4, τ=2) for arm circumference-for-age for boys...58
Table 21 Goodness-of-fit summary for models using the BCPE distribution with fixed ν=1 and τ=2 for arm circumference-for-age for boys ...58
Table 22 Q-test for z-scores from Model 1 [BCPE(x=age0.35, df(µ)=8, df(σ)=4, ν=1, τ=2)] for arm circumference-for-age for boys...60
Table 23 Goodness-of-fit summary for models BCPE(x=age0.35, df(µ)=8, df(σ)=4, df(ν)=?, τ=2) for arm circumference-for-age for boys ...61
Table 24 Q-test for z-scores from Model 2 [BCPE(x=age0.35, df(µ)=7, df(σ)=4, df(ν)=2, τ=2)] for arm circumference-for-age for boys ...65
Table 25 Observed proportions of children with measurements below the fitted centiles from Model 2, arm circumference-for-age for boys ...66
- xii -
Table 27 Longitudinal sample sizes for arm circumference-for-age for girls ... 81
Table 28 Cross-sectional sample sizes for arm circumference-for-age for girls ... 81
Table 29 Global deviance (GD) for models within the class BCPE(x=ageλ, df(µ)=9, df(σ)=4, df(ν)=4, τ=2) for arm circumference-for-age for girls ... 82
Table 30 Goodness-of-fit summary for models using the BCPE distribution with fixed ν=1 and τ=2 for arm circumference-for-age for girls... 82
Table 31 Q-test for z-scores from Model 1 [BCPE(x=age0.35, df(µ)=8, df(σ)=4, ν=1, τ=2)] for arm circumference-for-age for girls ... 84
Table 32 Goodness-of-fit summary for models BCPE(x=age0.35, df(µ)=8, df(σ)=4, df(ν)=?, τ=2) for arm circumference-for-age for girls... 85
Table 33 Q-test for z-scores from Model 2 [BCPE(x=age0.35, df(µ)=8, df(σ)=4, df(ν)=1, τ=2)] for arm circumference-for-age for girls... 89
Table 34 Observed proportions of children with measurements below the fitted centiles from Model 2, arm circumference-for-age for girls ... 90
Table 35 Arm circumference-for-age for girls, age in years and months... 99
Table 36 Longitudinal sample sizes for triceps skinfold-for-age for boys ... 107
Table 37 Cross-sectional sample sizes for triceps skinfold-for-age for boys ... 107
Table 38 Global deviance (GD) for models within the class BCPE(x=ageλ, df(µ)=9, df(σ)=4, df(ν)=4, τ=2) for triceps skinfold-for-age for boys ... 108
Table 39 Goodness-of-fit summary for models using the BCPE distribution with fixed ν=1 and τ=2 for triceps skinfold-for-age for boys... 108
Table 40 Q-test for z-scores from Model 1 [BCPE(x=age0.30, df(µ)=7, df(σ)=5, ν=1, τ=2)] for triceps skinfold-for-age for boys ... 110
Table 41 Goodness-of-fit summary for models BCPE(x=age0.30, df(µ)=7, df(σ)=5, df(ν)=?, τ=2) for triceps skinfold-for-age for boys... 111
Table 42 Q-test for z-scores from Model 2 [BCPE(x=age0.30, df(µ)=7, df(σ)=5, df(ν)=2, τ=2)] for triceps skinfold-for-age for boys... 115
Table 43 Observed proportions of children with measurements below the fitted centiles from Model 2, triceps skinfold-for-age for boys... 116
Table 44 Triceps skinfold-for-age for boys, age in years and months ... 125
Table 45 Longitudinal sample sizes for triceps skinfold-for-age for girls ... 131
Table 46 Cross-sectional sample sizes for triceps skinfold-for-age for girls ... 131
Table 47 Global deviance (GD) for models within the class BCPE(x=ageλ, df(µ)=9, df(σ)=4, df(ν)=4, τ=2) for triceps skinfold-for-age for girls... 132
Table 48 Goodness-of-fit summary for models using the BCPE distribution with fixed ν=1 and τ=2 for triceps skinfold-for-age for girls ... 132
Table 49 Q-test for z-scores from Model 1 [BCPE(x=age0.15, df(µ)=7, df(σ)=5, ν=1, τ=2)] for triceps skinfold-for-age for girls... 134
Table 50 Goodness-of-fit summary for models BCPE(x=age0.15, df(µ)=7, df(σ)=5 df(ν)=?, τ=2) for triceps skinfold-for-age for girls ... 134
-
xiii
-Table 52 Observed proportions of children with measurements below the fitted centiles from
Model 2, triceps skinfold-for-age for girls ...139
Table 53 Triceps skinfold-for-age for girls, age in years and months...148
Table 54 Longitudinal sample sizes for subscapular skinfold-for-age for boys ...157
Table 55 Cross-sectional sample sizes for subscapular skinfold-for-age for boys ...157
Table 56 Global deviance (GD) for models within the class BCPE(x=ageλ, df(µ)=9, df(σ)=4, df(ν)=4, τ=2) for subscapular skinfold-for-age for boys ...158
Table 57 Goodness-of-fit summary for models using the BCPE distribution with fixed ν=1 and τ=2 for subscapular skinfold-for-age for boys ...158
Table 58 Q-test for z-scores from Model 1 [BCPE(x=age0.65, df(µ)=6, df(σ)=3, ν=1, τ=2)] for subscapular skinfold-for-age for boys ...160
Table 59 Goodness-of-fit summary for models BCPE(x=age0.65, df(µ)=6, df(σ)=3, df(ν)=?, τ=2) for subscapular skinfold-for-age for boys ...161
Table 60 Goodness-of-fit summary for models using the BCPE distribution with df(ν)=2 and τ=2 for subscapular skinfold-for-age for boys ...161
Table 61 Q-test for z-scores from Model 2 [BCPE(x=age0.65, df(µ)=6, df(σ)=2, df(ν)=2, τ=2)] for subscapular skinfold-for-age for boys ...165
Table 62 Observed proportions of children with measurements below the fitted centiles from Model 2, subscapular skinfold-for-age for boys ...166
Table 63 Subscapular skinfold-for-age for boys, age in years and months...175
Table 64 Longitudinal sample sizes for subscapular skinfold-for-age for girls ...181
Table 65 Cross-sectional sample sizes for subscapular skinfold-for-age for girls ...181
Table 66 Global deviance (GD) for models within the class BCPE(x=ageλ, df(µ)=9, df(σ)=4, df(ν)=4, τ=2) for subscapular skinfold-for-age for girls ...182
Table 67 Goodness-of-fit summary for models using the BCPE distribution with fixed ν=1 and τ=2 for subscapular skinfold-for-age for girls ...182
Table 68 Q-test for z-scores from Model 1 [BCPE(x=age0.50, df(µ)=5, df(σ)=4, ν=1, τ=2)] for subscapular skinfold-for-age for girls ...184
Table 69 Goodness-of-fit summary for models BCPE(x=age0.50, df(µ)=5, df(σ)=4, df(ν)=?, τ=2) for subscapular skinfold-for-age for girls ...184
Table 70 Goodness-of-fit summary for models using the BCPE distribution with λ=0.15, df(ν)=2 and τ=2 for subscapular skinfold-for-age for girls ...185
Table 71 Q-test for z-scores from Model 2 [BCPE(x=age0.15, df(µ)=5 df(σ)=4, df(ν)=2, τ=2)] for subscapular skinfold-for-age for girls ...189
Table 72 Goodness-of-fit summary for models BCPE(x=age0.15, df(µ)=5, df(σ)=4, df(ν)=2, df(τ)=?) for subscapular skinfold-for-age for girls...189
Table 73 Observed proportions of children with measurements below the fitted centiles from Model 2, subscapular skinfold-for-age for girls...192
- xiv -
Glossary
BCPE The Box-Cox power exponential distribution.
µ The median of the Box-Cox power exponential distribution. σ The approximate coefficient of variation of the Box-Cox power
exponential distribution — related to the variance.
ν The power of the Box-Cox transformation (to the normal distribution) of the Box-Cox power exponential distribution — related to the skewness.
τ The power exponential parameter of the Box-Cox power exponential distribution — related to the kurtosis.
λ The power of the age (or length/height) transformation.
Body mass index (BMI) The ratio weight (in kg) / recumbent length or standing height (in m2).
Box-Cox transformation A power transformation to the normal distribution. Coefficient of variation The ratio of the standard deviation to the mean.
Cubic spline A piecewise third-order polynomial function that passes through a set of m (or degrees of freedom) control points; it can have a very simple form locally, yet be globally flexible and smooth. Cut-off A designated limit beyond which a subject or observation is
classified according to a pre-set condition.
Degrees of freedom (df) The number of control points used to fit the cubic splines. Kurtosis An attribute of a distribution describing "peakedness". A high
kurtosis portrays a distribution with fat tails in contrast to a low kurtosis, which portrays a distribution with skinny tails.
P-value The probability of falsely rejecting the hypothesis being tested. In this report all p-values were compared to a level of significance set to 0.05.
Q-test A statistical test which combines overall and local tests assessing departures from the normal distribution with respect to median, variance, skewness and kurtosis.
Skewness A statistical term used to describe a distribution's asymmetry in relation to a normal distribution.
Standard deviation score (SD) See z-score.
Worm plots A set of detrended Q-Q plots — plots that compare the distribution of a given set of observations to the normal distribution.
- xv -
Executive summary
In 1993 the World Health Organization (WHO) undertook a comprehensive review of the uses and interpretation of anthropometric references. The review concluded that the NCHS/WHO growth reference, which had been recommended for international use since the late 1970s, did not adequately represent early childhood growth and that new growth curves were necessary. The World Health Assembly endorsed this recommendation in 1994. In response WHO undertook the Multicentre Growth Reference Study (MGRS) between 1997 and 2003 to generate new curves for assessing the growth and development of children the world over.
The MGRS combined a longitudinal follow-up from birth to 24 months and a cross-sectional survey of children aged 18 to 71 months. Primary growth data and related information were gathered from 8440 healthy breastfed infants and young children from widely diverse ethnic backgrounds and cultural settings (Brazil, Ghana, India, Norway, Oman and USA). The MGRS is unique in that it was purposely designed to produce a standard by selecting healthy children living under conditions likely to favour the achievement of their full genetic growth potential. Furthermore, the mothers of the children selected for the construction of the standards engaged in fundamental health-promoting practices, namely breastfeeding and not smoking.
This report presents the second set of WHO Child Growth Standards (i.e. head circumference-for-age, arm circumference-for-age, triceps skinfold-for-age and subscapular skinfold-for-age) and describes the methodical process followed in their development. The first step in this process was a consultative expert review of some 30 growth curve construction methods, including types of distributions and smoothing techniques to identify the best approach to constructing the standards. Next was the selection of a software package flexible enough to allow the comparative testing of the alternative methods used to generate the growth curves. Then the selected approach was applied systematically to search for the best models to fit the data for each indicator.
The Box-Cox-power-exponential (BCPE) method, with curve smoothing by cubic splines was selected for constructing the WHO child growth curves. The BCPE accommodates various kinds of distributions, from normal to skewed or kurtotic. The age-based indicators originating at birth required a power-transformation to stretch the age scale (x-axis) as a preliminary step to fitting the curves. For each set of curves, the search for the best model specification began by examining various combinations of degrees of freedom to fit the median and variance estimator curves. When data had a non-normal distribution, degrees of freedom for parameters to model skewness and kurtosis were added to the initial model and adequacy of fit evaluated. Apart from head circumference-for-age, which followed a normal distribution, the other standards in the second set required the modelling of skewness, but not kurtosis. The diagnostic tools used iteratively to detect possible model misfits and biases in the fitted curves included various tests of local and global goodness of fit, worm plots and residual plots. Patterns of differences between empirical and fitted percentiles were also examined, as were proportions of observed versus expected percentages of children with measurements below selected percentiles.
The sample used for the construction of the second set of growth standards was the same one used for the construction of the first set of standards. The methodology described above was followed to generate ─ for boys and girls ─ percentile and z-score curves for head circumference-for-age (0 to 60 months), arm circumference-for-age (3 to 60 months), triceps skinfold-for-age (3 to 60 months) and subscapular skinfold-for-age (3 to 60 months).
- xvi -
Head circumference followed a normal distribution. The data for arm circumference and skinfold thicknesses were skewed, so in specifying the model, the parameter related to skewness was fitted in addition to the median and the coefficient of variation. Results from the final model for girls' subscapular skinfold suggested the need to investigate potential improvements in the curves by modelling kurtosis. Adjustment for kurtosis, however had a negligible impact on the final centiles. Therefore, considering that modelling the fourth parameter would increase complexity in application of the standards and create inconsistency between the sexes, the final curves were generated without adjusting for kurtosis.
The power transformation of age was applied to stretch the age scale for each of the sexes before fitting cubic splines to generate the growth curves. The same power transformation of age was applied to both boys' and girls' head and arm circumferences. For the skinfold thicknesses, boys required a higher power transformation than did girls.
Cubic spline fitting was achieved with variable degrees of freedom for each indicator and sex. For the median curves, different degrees of freedom were required for boys and girls for arm circumference and subscapular skinfold. For the coefficient of variation curves, the degrees of freedom varied between sexes for head circumference and subscapular skinfold. For the indicators that required fitting skewness, all but the subscapular skinfold required different degrees of freedom for the parameter modelling skewness.
Overall, concordance between smoothed curves and empirical centiles was free of bias in both the median range and the tails, indicating that the resulting curves provide an adequate description of the true growth of healthy children.
The method used to construct the WHO standards generally relied on the Box-Cox power exponential distribution and the final selected models simplified to the LMS model. As a result, the computation of percentiles and z-scores for these standards uses formulae based on the LMS method. However, as was done for the construction of the first set of growth standards, a restriction was imposed on all indicators to enable the derivation of percentiles only within the interval corresponding to z-scores between -3 and 3. The underlying reasoning is that percentiles beyond ±3 SD are invariant to changes in equivalent z-scores. The loss accruing to this restriction is small since the inclusion range corresponds to the 0.135th to 99.865th percentiles.
The arm circumference and skinfold thicknesses presented right-skewed distributions. When modelled correctly, right skewness has the effect of making distances between positive z-scores increase progressively the farther away they are from the median, while distances between negative z-scores decrease progressively. The LMS method fits skewed data adequately by using a Box-Cox normal distribution, which follows the empirical data closely. The drawback, however, is that the outer tails of the distribution are highly affected by extreme data points even if only very few. A restricted application of the LMS method was thus used for the construction of the indicators with skewed distributions, limiting the Box-Cox normal distribution to the interval corresponding to z-scores where empirical data were available (i.e. between -3 SD and 3 SD). Beyond these limits, the standard deviation at each age was fixed to the distance between ±2 SD and ±3 SD, respectively. This approach avoids making assumptions about the distribution of data beyond the limits of the observed values.
- xvii -
thickness of subcutaneous tissue and reflect fatness primarily. The skinfold indicators are thus a useful addition to the battery of growth standards for assessing childhood obesity.
- 1 -
1.
INTRODUCTION
Growth charts are an essential component of the paediatric toolkit. Their value resides in helping to determine the degree to which physiological needs for growth and development are met during the important childhood period. Beyond their usefulness in assessing children's nutritional status, many governmental and United Nations agencies rely on growth charts to measure the general well-being of populations, formulate health and related policies, and plan interventions and monitor their effectiveness.
The origin of the WHO Child Growth Standards dates back to the early 1990s when a group of experts was appointed to conduct a meticulous evaluation of the National Center for Health Statistics/World Health Organization (NCHS/WHO) growth reference that had been recommended for international use since the late 1970s (WHO, 1995). The limitations of the NCHS/WHO reference have been documented (WHO Working Group on Infant Growth, 1994; de Onis and Habicht, 1996; de Onis and Yip, 1996). The data used to construct the reference covering birth to three years of age came from a longitudinal study of children of European ancestry from a single community in the USA. These children were measured every three months, which is inadequate to describe the rapid and changing rate of growth in early infancy. Also, the statistical methods available at the time the NCHS/WHO growth curves were constructed were too limited to correctly model the pattern and variability of growth. As a result, the NCHS/WHO curves do not adequately represent early childhood growth.
The initial phase of the expert group's work documented the deficiencies of the reference and led to a plan for developing new growth charts that would show how children should grow in all countries rather than merely describing how they grew at a particular time and place. The experts underscored the importance of ensuring that the new growth charts were consistent with "best" health practices (Garza and de Onis, 2004).
A logical outcome of this plan was the WHO Multicentre Growth Reference Study (MGRS), which was implemented between 1997 and 2003 (de Onis et al., 2004a). The MGRS is unique in that it was purposely designed to produce a standard rather than a reference. Although standards and references both serve as a basis for comparison, each enables a different interpretation. Since a standard defines how children should grow, deviations from the pattern it describes are evidence of abnormal growth. A reference, on the other hand, does not provide as sound a basis for such value judgments, although in practice references often are mistakenly used as standards.
The MGRS data provide a solid foundation for developing a standard because they are based on healthy children living under conditions likely to favour achievement of their full genetic growth potential. Furthermore, the mothers of the children selected for the construction of the standards engaged in fundamental health-promoting practices, namely breastfeeding and not smoking (de Onis et al., 2004b).
2 Introduction
- 3 -
2.
METHODOLOGY
2.1
Design of the WHO Multicentre Growth Reference Study
The Multicentre Growth Reference Study (MGRS) (July 1997–December 2003) was a population-based study that took place in the cities of Davis, California, USA; Muscat, Oman; Oslo, Norway; and Pelotas, Brazil; and in selected affluent neighbourhoods of Accra, Ghana and South Delhi, India. The MGRS protocol and its implementation in the six sites are described in detail elsewhere (de Onis et al., 2004a). Briefly, the MGRS combined a longitudinal component from birth to 24 months with a cross-sectional component of children aged 18–71 months. In the longitudinal component, mothers and newborns were screened and enrolled at birth and visited at home a total of 21 times on weeks 1, 2, 4 and 6; monthly from 2–12 months; and bimonthly in the second year. In the cross-sectional component, children aged 18–71 months were measured once, except in the two sites (Brazil and USA) that used a mixed-longitudinal design in which some children were measured two or three times at three-month intervals. Both recumbent length and standing height were measured for all children aged 18–30 months. Data were collected on anthropometry, motor development, feeding practices, child morbidity, perinatal factors, and socioeconomic, demographic and environmental characteristics (de Onis et al., 2004b).
The study populations lived in socioeconomic conditions favourable to growth and where mobility was low, ≥20% of mothers followed WHO feeding recommendations and breastfeeding support was available(de Onis et al., 2004b). Individual inclusion criteria were: no known health or environmental constraints to growth, mothers willing to follow MGRS feeding recommendations (i.e. exclusive or predominant breastfeeding for at least 4 months, introduction of complementary foods by the age of 6 months, and continued partial breastfeeding up to at least 12 months), no maternal smoking before and after delivery, single term birth, and absence of significant morbidity (de Onis et al., 2004b). As part of the site-selection process in Ghana, India and Oman, surveys were conducted to identify socioeconomic characteristics that could be used to select groups whose growth was not environmentally constrained (Owusu et al., 2004; Bhandari et al., 2002; Mohamed et al., 2004). Local criteria for screening newborns, based on parental education and/or income levels, were developed from those surveys. Pre-existing survey data for this purpose were available from Brazil, Norway and the USA. Of the 13 741 mother-infant pairs screened for the longitudinal component, about 83% were ineligible (WHO Multicentre Growth Reference Study Group, 2006e). Families’ low socioeconomic status was the most common reason for ineligibility in Brazil, Ghana, India and Oman, whereas parental refusal was the main reason for non-participation in Norway and the USA (WHO Multicentre Growth Reference Study Group, 2006e). For the cross-sectional component, 69% of the 21 510 subjects screened were excluded for reasons similar to those observed in the longitudinal component. Term low-birth-weight (<2500 g) infants (2.3%) were not excluded. Since it is likely that in well-off populations such infants represent small but normal children, their exclusion would have artificially distorted the standards’ lower percentiles. Eligibility criteria for the cross-sectional component were the same as those for the longitudinal component with the exception of infant feeding practices. A minimum of three months of any breastfeeding was required for participants in the study’s cross-sectional component.
2.2
Anthropometry methods
4 Methodology
Growth Reference Study Group, 2006f). For the longitudinal component of the study, screening teams measured newborns within 24 hours of delivery, and follow-up teams conducted home visits until 24 months of age. The follow-up teams were also responsible for taking measurements in the cross-sectional component involving children aged 18–71 months (de Onis et al., 2004b). The MGRS data included weight and head circumference at all ages, recumbent length (longitudinal component), height (cross-sectional component), and arm circumference, triceps and subscapular skinfolds (all children aged ≥3 months). This report presents only the standards based on head circumference, arm circumference and skinfolds. The standards based on length or height and weight are presented in an earlier publication (WHO Multicentre Growth Reference Study Group, 2006d; web site http://www.who.int/childgrowth/publications/technical_report_pub/en/index.html).
Observers working in pairs collected anthropometric data. Each observer independently measured and recorded a complete set of measurements, after which the two compared their readings. If any pair of readings exceeded the maximum allowable difference for a given variable (e.g. head circumference, 5 mm; arm circumference, 5 mm; skinfold thickness, 2 mm), both observers once again independently measured and recorded a second and, if necessary, a third set of readings for the variable(s) in question (de Onis et al., 2004c).
All study sites used identical measuring equipment. Instruments needed to be highly accurate and precise. A self-retracting, 0.7 cm-wide, flat metal tape with blank lead-in strip (range, 0–200 cm, calibrated to 1 mm), was used to measure circumferences. Metal tapes were chosen because they are more robust and accurate, and stay in a single plane around the head. They were replaced on a regular basis when the grading marks faded. The Holtain/Tanner-Whitehouse skinfold caliper (jaw face area, 35 mm2; pressure between the jaws, 10 ± 2 g/mm2; range, 0–40 mm; calibrated to 0.2 mm) was used to measure skinfolds. The skinfold calipers, being particularly fragile, were checked before each use with calibration blocks of various widths for accuracy and to ensure that the needle moved smoothly and continuously with the opening of the caliper jaws. Full details of the instruments used and how measurements were taken are provided elsewhere (de Onis et al., 2004c).
2.3
Sample description
The total sample size for the longitudinal and cross-sectional components from all six sites was 8440 children. A total of 1743 children were enrolled in the longitudinal sample, six of whom were excluded for morbidities affecting growth (4 cases of repeated episodes of diarrhoea, 1 case of repeated episodes of malaria, and 1 case of protein-energy malnutrition) leaving a sample of 1737 children (894 boys and 843 girls). Of these, the mothers of 882 children (428 boys and 454 girls) complied fully with the MGRS infant-feeding and no-smoking criteria and completed the follow-up period of 24 months (96% of compliant children completed the 24-month follow-up). The other 855 either failed to comply with the study's infant-feeding and no-smoking criteria or dropped out before 24 months. These children, whose size at birth was similar to that of the compliant sample, contributed only birth measurements. The increased sample size at birth served to minimize the left-edge effect in the head circumference-for-age curves. For arm circumference and the skinfolds, which were measured starting at age 3 months, the data did not allow for this correction in the corresponding standards. The total number of records for the longitudinal component was 19 900.
Methodology 5
recruitment, sample attrition and compliance, as well as the baseline characteristics of the study sample is provided elsewhere (WHO Multicentre Growth Reference Study Group, 2006e).
2.4
Data cleaning procedures and exclusions
Data cleaning
The MGRS data management protocol (Onyango et al., 2004) was designed to create and manage a large databank of information collected from multiple sites over a period of several years. Data collection and processing instruments were prepared centrally and used in a standardized fashion across sites. The data management system contained internal validation features for timely detection of data errors and its standard operating procedures stipulated a method of master file updating and correction that maintained a clear trail for data-auditing purposes. Each site was responsible for collecting, entering, verifying and validating data, and for creating site-level master files. Data from the sites were sent to WHO/HQ every month for master file consolidation and more extensive quality control checking. All errors identified were communicated to the site for correction at source.
After data collection was completed at a given site, a period of about 6 months was dedicated to in-depth data quality checking and master file cleaning. Detailed validation reports, descriptive statistics and plots were produced from the site’s master files. For the longitudinal component, each anthropometric measurement was plotted for every child from birth to the end of his/her participation. These plots were examined individually for any questionable patterns. Query lists from these analyses were sent to the site for investigation and correction, or confirmation, as required. As with the data collection process, the site data manager prepared correction batches to update the master files. The updated master files were then sent to WHO/HQ and this iterative quality assurance process continued until all identifiable problems had been detected and corrected. The rigorous implementation of what was a highly demanding protocol yielded very high-quality data.
Data exclusions
In addition to exclusions of data based on weight-for-height (WHO Multicentre Growth Reference Study Group, 2006d), a few influential observations outside ±4 SD were excluded when constructing the individual standards included in this report. These were, for head circumference-for-age: boys, all 21 observations belonging to one boy in the longitudinal sample (0.15%) and one single observation (0.01%) among girls; for triceps skinfold-for-age: boys, 7 (0.06%) and girls, 9 (0.08%); for subscapular skinfold-for-age: boys, 17 (0.16%) and girls, 19 (0.17%) observations. These observations were set to missing in the final data set and therefore did not contribute to the construction of the corresponding standards. The final number of observations used in the construction of the WHO child growth standards is shown in Table 1.
Table 1 Number of observations used in the construction of the WHO child growth standards by sex and anthropometric indicator
Indicator Girls Boys Total
6 Methodology
2.5
Statistical methods for constructing the growth curves
The underlying methodology used for constructing the head circumference-for-age, arm circumference -for-age, triceps skinfold-for-age and subscapular skinfold-for-age standards was the same used to construct the standards for length/height-for-age, weight-for-age, weight-for-length, weight-for-height and body mass index-for-age. The growth curve fitting method and diagnostic tools used to select the best models for each of the indicators are described in detail in the report of the first set of standards (WHO Multicentre Growth Reference Study Group, 2006d, 2006g).
The Box-Cox-power-exponential (BCPE) method (Rigby and Stasinopoulos, 2004), with curve smoothing by cubic splines was selected for constructing the WHO child growth curves. The BCPE accommodates various kinds of distributions, from normal to skewed or kurtotic. All the indicators in this second set standards required a power-transformation to stretch the age scale (x-axis) as a preliminary step to fitting the curves. For each set of curves, the search for the best model specification began by examining various combinations of degrees of freedom to fit the median and variance estimator curves. When data had a non-normal distribution, degrees of freedom for parameters to model skewness and kurtosis were added to the initial model and adequacy of fit was evaluated. Apart from head circumference-for-age, which followed a normal distribution, the other standards required the modelling of skewness, but not kurtosis. The diagnostic tools used iteratively to detect possible model misfits and biases in the fitted curves included various tests of local and global goodness of fit, like Q-tests (Royston and Wright, 2000), worm plots (van Buuren and Fredriks, 2001) and residual plots. Patterns of differences between empirical and fitted percentiles were also examined, as were proportions of observed versus expected percentages of children with measurements below selected percentiles. The curves were constructed using all available data (i.e. from birth to 71 months) but the final standards were truncated at 60 completed months to avoid the right-edge effect (Borghi et al., 2006).
- 7 -
3.
CONSTRUCTION OF THE HEAD CIRCUMFERENCE-FOR-AGE STANDARDS
3.1
Indicator-specific methodology
The same approach as that described to select the best model for the length/height-for-age growth curves (WHO Multicentre Growth Reference Study Group, 2006d) was followed to select the best model to construct the head circumference-for-age growth standards. The BCPE method was used and, starting from the simplest model (i.e. with the normal distribution), the best model was sought and its goodness of fit evaluated. The diagnostic tools applied to evaluate and compare candidate models were the same as those used for constructing the first set of indicators. All data up to 71 months were used for modelling the head circumference-for-age growth curves and the standards afterwards truncated at 60 completed months to correct for the right-edge effect (Borghi et al., 2006).
3.2
Head circumference-for-age for boys
3.2.1 Sample size
There were 13 541 head circumference observations for boys. The longitudinal and cross-sectional sample sizes by visit and age are shown in Tables 2 and 3.
Table 2 Longitudinal sample sizes for head circumference-for-age for boys
Visit Birth 1 2 3 4 5 6
Age 0 2 wk 4 wk 6 wk 2 mo 3 mo 4 mo
N 893 424 423 423 422 418 417
Visit 7 8 9 10 11 12 13 Age 5 mo 6 mo 7 mo 8 mo 9 mo 10 mo 11 mo
N 419 422 418 418 413 409 420
Visit 14 15 16 17 18 19 20 Age 12 mo 14 mo 16 mo 18 mo 20 mo 22 mo 24 mo
N 420 418 417 416 422 416 421
Table 3 Cross-sectional sample sizes for head circumference-for-age for boys
Age (mo) <18 18–20 21–23 24–26 27–29 30–32 33–35
N 3 184 191 244 267 229 261
Age (mo) 36–38 39–41 42–44 45–47 48–50 51–53 54–56
N 274 254 263 244 245 229 233
Age (mo) 57–59 60–62 63–65 66–68 69–71 >71
N 245 236 221 224 221 4
3.2.2 Model selection and results
8 Head circumference-for-age, boys
Table 4 Global deviance (GD) for models within the class BCPE(x=ageλ, df(µ)=9, df(σ)=4, ν=1, τ=2) for head circumference-for-age for boys
λ 0.05 0.10 0.15 0.20 0.25 0.30 0.35 0.40 0.45 0.50 GDa 735.7 735.9 735.8 735.5 735.9 738.6 744.9 755.6 769.6 783.6 λ 0.55 0.60 0.65 0.70 0.75 0.80 0.85 0.90 0.95 1.00 GDa 793.4 795.7 791.3 786.9 795.4 835.5 929.0 NA NA NA a
In excess of 45 000; NA: not available (method did not converge with this power).
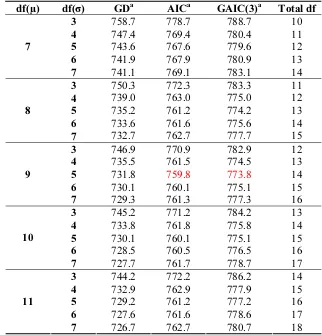
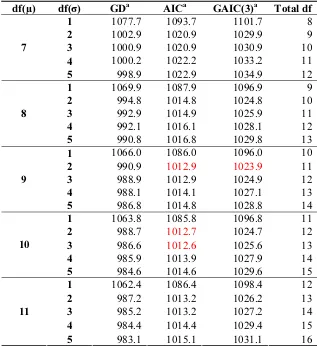
Having chosen the age-transformation power λ=0.20, the search for the best df(µ) and df(σ) followed, comparing models in which the parameters ν and τ had the fixed values 1 and 2, respectively, i.e. adjusting neither for skewness nor for kurtosis. For this, all possible combinations of df(µ) ranging from 5 to 15 and df(σ) from 2 to 10 were considered. Partial results are presented in Table 5.
Table 5 Goodness-of-fit summary for models using the BCPE distribution with fixed ν=1 and τ=2 for head circumference-for-age for boys
df(µ) df(σ) GDa AICa GAIC(3)a Total df
GD, Global Deviance; AIC, Akaike Information Criterion; GAIC(3), Generalized AIC with penalty equal to 3; a
In excess of 45 000.
Head circumference-for-age, boys 9
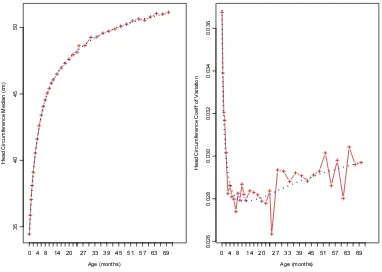
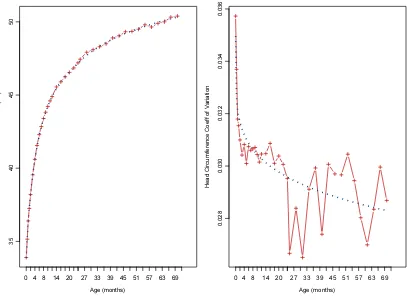
Model 1: BCPE(x=age0.20, df(µ)=9, df(σ)=5, ν=1, τ=2)
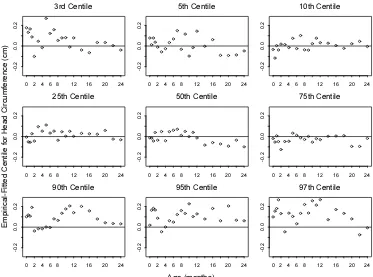
The fitted parameter curves showed adequate smoothing despite an erratic coefficient of variation in the cross-sectional sample (Figure 1). The residual plots of the fitted centiles for the period 0 to 24 months (Figure 2) showed some bias at the upper centiles (90th, 95th and 97th), but the underestimation represents only 1 mm on average, which was considered negligible in practical terms. The lower centiles (3rd, 5th, 10th) showed no biased pattern. For the age range 24 to 71 months, residuals of the fitted centiles showed a non-random pattern only for the 3rd centile, the average bias was about 2 mm (Figure 3).
Table 6 shows the proportions of children with head circumference below the fitted centiles. Age group labels correspond to the same age intervals provided in Table 7. There was indication of underestimation at the upper percentiles (90th and above) as well as the 1st percentile for some age groups. For the other percentiles, no biases were observed.
Age (months)
10 Head circumference-for-age, boys
Figure 2 Centile residuals from fitting Model 1 for head circumference-for-age from 0 to 24 months for boys
Head circumference-for-age, boys 11
The worm plots for Model 1 are shown in Figure 4. There are only three groups for which worms present slight upward or downward shifts (40 mo, 52 mo and 58 mo), but overall, the fit of the median is adequate. Groups at birth and 42 d present U-shaped worms, indicating residual skewness to the left. There are no worms with a slope, which would indicate misfit in the variance curve. S-shaped worms indicate a misfit in the curve of the parameter related to kurtosis as is the case in the 40 mo age group only. Despite the slight deviances present in a few groups, overall, the worms fitted to the points (solid red line) are all contained within the 95% confidence interval (dotted curves).
Birth 14 d 28 d 42 d 2 mo 3 mo 4 mo 5 mo 6 mo 7 mo 8 mo 9 mo 10 mo 11 mo 12 mo 14 mo 16 mo 18 mo 20 mo 22 mo 24 mo 28 mo 34 mo 40 mo 46 mo 52 mo 58 mo 64 mo 70 mo
Birth 14 d 28 d 42 d 2 mo 3 mo 4 mo 5 mo 6 mo 7 mo 8 mo 9 mo 10 mo 11 mo 12 mo 14 mo 16 mo 18 mo 20 mo 22 mo 24 mo 28 mo 34 mo 40 mo 46 mo 52 mo 58 mo 64 mo 70 mo
Birth 14 d 28 d 42 d 2 mo 3 mo 4 mo 5 mo 6 mo 7 mo 8 mo 9 mo 10 mo 11 mo 12 mo 14 mo 16 mo 18 mo 20 mo 22 mo 24 mo 28 mo 34 mo 40 mo 46 mo 52 mo 58 mo 64 mo 70 mo
Table 6 Observed proportions of children with measurements below the fitted centiles from Model 1, head circumference-for-age for boys (continued) Expected 24 mo 28 mo 34 mo 40 mo 46 mo 52 mo 58 mo 64 mo 70 mo Overall
1 0.8 1.2 0.9 0.6 0.6 0.6 1.2 0.6 1.0 0.7
3 3.0 2.0 2.1 2.7 2.1 2.0 3.0 2.7 2.0 2.6
5 5.2 4.1 3.6 5.7 3.6 4.2 6.1 4.2 4.7 4.9
10 10.4 9.4 9.4 12.6 9.4 9.3 13.6 12.4 9.2 10.4
25 26.3 25.8 24.3 28.2 25.2 23.7 27.1 27.6 24.4 25.2
50 51.9 49.9 46.9 51.5 48.2 47.8 50.6 48.9 48.8 50.4
75 76.0 74.2 74.0 75.8 73.2 72.5 78.5 75.7 75.6 75.6
90 89.4 91.2 88.9 89.3 88.9 88.3 92.1 91.1 89.2 89.3
95 94.1 95.3 94.0 95.4 94.5 95.8 95.7 95.8 94.9 94.5
97 97.0 97.8 95.9 98.1 97.5 96.6 97.4 97.7 98.3 96.6
99 99.5 99.0 98.1 99.2 99.2 99.4 99.0 99.2 99.3 99.0
Note: Group labels correspond to the age intervals in Table 7.
H
ea
d
c
ir
cu
m
fe
re
n
ce
-f
o
r-ag
e,
b
o
y
s
1
14 Head circumference-for-age, boys
The Q-test was performed to assess the overall significance of deviations that were noted based on the worm plots (Table 7). Absolute values of z3 larger than 2 were observed only in the age groups birth and 42 d, and for z4 in 40 mo. The overall tests (p-values shown for each statistic in the last row of the table) did not suggest any significant departures of the fitted model z-scores from normality at the 5% level of significance.
Note: Absolute values of z1, z2, z3 or z4 larger than 2 indicate misfit of, respectively, mean, variance, skewness or kurtosis.
Head circumference-for-age, boys 15
Age (months)
Figure 5 3rd, 10th, 50th, 90th, 97th smoothed centile curves and empirical values: head circumference-for-age for boys from birth to 24 months
Age (months)
Figure 6 5th, 25th, 50th, 75th, 95th smoothed centile curves and empirical values: head circumference-for-age for boys from birth to 24 months
Age (months)
Age (months)
20 Head circumference-for-age, boys
3.2.3 WHO standards
Charts
Figure 9 WHO head circumference-for-age z-scores for boys from birth to 60 months
Age (months)
Figure 10 WHO head circumference -for-age percentiles for boys from birth to 60 months
Tables
Table 8 Head circumference-for-age for boys, age in weeks
Percentiles (head circumference in cm)
Week L M S SD 1st 3rd 5th 15th 25th 50th 75th 85th 95th 97th 99th
0 1 34.4618 0.03686 1.2703 31.5 32.1 32.4 33.1 33.6 34.5 35.3 35.8 36.6 36.9 37.4
1 1 35.1634 0.03472 1.2209 32.3 32.9 33.2 33.9 34.3 35.2 36.0 36.4 37.2 37.5 38.0
2 1 35.8649 0.03258 1.1685 33.1 33.7 33.9 34.7 35.1 35.9 36.7 37.1 37.8 38.1 38.6
3 1 36.5216 0.03197 1.1676 33.8 34.3 34.6 35.3 35.7 36.5 37.3 37.7 38.4 38.7 39.2
4 1 37.0926 0.03148 1.1677 34.4 34.9 35.2 35.9 36.3 37.1 37.9 38.3 39.0 39.3 39.8
5 1 37.6010 0.03107 1.1683 34.9 35.4 35.7 36.4 36.8 37.6 38.4 38.8 39.5 39.8 40.3
6 1 38.0609 0.03072 1.1692 35.3 35.9 36.1 36.8 37.3 38.1 38.8 39.3 40.0 40.3 40.8
7 1 38.4824 0.03041 1.1703 35.8 36.3 36.6 37.3 37.7 38.5 39.3 39.7 40.4 40.7 41.2
8 1 38.8724 0.03014 1.1716 36.1 36.7 36.9 37.7 38.1 38.9 39.7 40.1 40.8 41.1 41.6
9 1 39.2368 0.02990 1.1732 36.5 37.0 37.3 38.0 38.4 39.2 40.0 40.5 41.2 41.4 42.0
10 1 39.5797 0.02969 1.1751 36.8 37.4 37.6 38.4 38.8 39.6 40.4 40.8 41.5 41.8 42.3
11 1 39.9033 0.02950 1.1772 37.2 37.7 38.0 38.7 39.1 39.9 40.7 41.1 41.8 42.1 42.6
12 1 40.2096 0.02933 1.1794 37.5 38.0 38.3 39.0 39.4 40.2 41.0 41.4 42.1 42.4 43.0
13 1 40.5008 0.02918 1.1818 37.8 38.3 38.6 39.3 39.7 40.5 41.3 41.7 42.4 42.7 43.3
H
ea
d
c
ir
cu
m
fe
re
n
ce
-f
o
r-ag
e,
b
o
y
s
2
Table 8 Head circumference-for-age for boys, age in weeks (continued)
Z-scores (head circumference in cm)
Week L M S SD -3 SD -2 SD -1 SD Median 1 SD 2 SD 3 SD
0 1 34.4618 0.03686 1.2703 30.7 31.9 33.2 34.5 35.7 37.0 38.3
1 1 35.1634 0.03472 1.2209 31.5 32.7 33.9 35.2 36.4 37.6 38.8
2 1 35.8649 0.03258 1.1685 32.4 33.5 34.7 35.9 37.0 38.2 39.4
3 1 36.5216 0.03197 1.1676 33.0 34.2 35.4 36.5 37.7 38.9 40.0
4 1 37.0926 0.03148 1.1677 33.6 34.8 35.9 37.1 38.3 39.4 40.6
5 1 37.6010 0.03107 1.1683 34.1 35.3 36.4 37.6 38.8 39.9 41.1
6 1 38.0609 0.03072 1.1692 34.6 35.7 36.9 38.1 39.2 40.4 41.6
7 1 38.4824 0.03041 1.1703 35.0 36.1 37.3 38.5 39.7 40.8 42.0
8 1 38.8724 0.03014 1.1716 35.4 36.5 37.7 38.9 40.0 41.2 42.4
9 1 39.2368 0.02990 1.1732 35.7 36.9 38.1 39.2 40.4 41.6 42.8
10 1 39.5797 0.02969 1.1751 36.1 37.2 38.4 39.6 40.8 41.9 43.1
11 1 39.9033 0.02950 1.1772 36.4 37.5 38.7 39.9 41.1 42.3 43.4
12 1 40.2096 0.02933 1.1794 36.7 37.9 39.0 40.2 41.4 42.6 43.7
13 1 40.5008 0.02918 1.1818 37.0 38.1 39.3 40.5 41.7 42.9 44.0
2
4
H
ea
d
c
ir
cu
m
fe
re
n
ce
-f
o
r-ag
e,
b
o
y
Table 9 Head circumference-for-age for boys, age in years and months
Percentiles (head circumference in cm)
Table 9 Head circumference-for-age for boys, age in years and months (continued)
Percentiles (head circumference in cm)
Table 9 Head circumference-for-age for boys, age in years and months (continued)
Percentiles (head circumference in cm)
Year: Month Month L M S SD 1st 3rd 5th 15th 25th 50th 75th 85th 95th 97th 99th
4: 1 49 1 50.2617 0.02915 1.4651 46.9 47.5 47.9 48.7 49.3 50.3 51.2 51.8 52.7 53.0 53.7
4: 2 50 1 50.3105 0.02918 1.4681 46.9 47.5 47.9 48.8 49.3 50.3 51.3 51.8 52.7 53.1 53.7
4: 3 51 1 50.3578 0.02921 1.4710 46.9 47.6 47.9 48.8 49.4 50.4 51.3 51.9 52.8 53.1 53.8
4: 4 52 1 50.4039 0.02924 1.4738 47.0 47.6 48.0 48.9 49.4 50.4 51.4 51.9 52.8 53.2 53.8
4: 5 53 1 50.4488 0.02927 1.4766 47.0 47.7 48.0 48.9 49.5 50.4 51.4 52.0 52.9 53.2 53.9
4: 6 54 1 50.4926 0.02929 1.4789 47.1 47.7 48.1 49.0 49.5 50.5 51.5 52.0 52.9 53.3 53.9
4: 7 55 1 50.5354 0.02932 1.4817 47.1 47.7 48.1 49.0 49.5 50.5 51.5 52.1 53.0 53.3 54.0
4: 8 56 1 50.5772 0.02935 1.4844 47.1 47.8 48.1 49.0 49.6 50.6 51.6 52.1 53.0 53.4 54.0
4: 9 57 1 50.6183 0.02938 1.4872 47.2 47.8 48.2 49.1 49.6 50.6 51.6 52.2 53.1 53.4 54.1
4:10 58 1 50.6587 0.02940 1.4894 47.2 47.9 48.2 49.1 49.7 50.7 51.7 52.2 53.1 53.5 54.1
4:11 59 1 50.6984 0.02943 1.4921 47.2 47.9 48.2 49.2 49.7 50.7 51.7 52.2 53.2 53.5 54.2
5: 0 60 1 50.7375 0.02946 1.4947 47.3 47.9 48.3 49.2 49.7 50.7 51.7 52.3 53.2 53.5 54.2
H
ea
d
c
ir
cu
m
fe
re
n
ce
-f
o
r-ag
e,
b
o
y
s
2
Table 9 Head circumference-for-age for boys, age in years and months (continued)
Z-scores (head circumference in cm)
Table 9 Head circumference-for-age for boys, age in years and months (continued)
Z-scores (head circumference in cm)
Table 9 Head circumference-for-age for boys, age in years and months (continued)
Z-scores (head circumference in cm)
Year: Month Month L M S SD -3 SD -2 SD -1 SD Median 1 SD 2 SD 3 SD
4: 1 49 1 50.2617 0.02915 1.4651 45.9 47.3 48.8 50.3 51.7 53.2 54.7
4: 2 50 1 50.3105 0.02918 1.4681 45.9 47.4 48.8 50.3 51.8 53.2 54.7
4: 3 51 1 50.3578 0.02921 1.4710 45.9 47.4 48.9 50.4 51.8 53.3 54.8
4: 4 52 1 50.4039 0.02924 1.4738 46.0 47.5 48.9 50.4 51.9 53.4 54.8
4: 5 53 1 50.4488 0.02927 1.4766 46.0 47.5 49.0 50.4 51.9 53.4 54.9
4: 6 54 1 50.4926 0.02929 1.4789 46.1 47.5 49.0 50.5 52.0 53.5 54.9
4: 7 55 1 50.5354 0.02932 1.4817 46.1 47.6 49.1 50.5 52.0 53.5 55.0
4: 8 56 1 50.5772 0.02935 1.4844 46.1 47.6 49.1 50.6 52.1 53.5 55.0
4: 9 57 1 50.6183 0.02938 1.4872 46.2 47.6 49.1 50.6 52.1 53.6 55.1
4:10 58 1 50.6587 0.02940 1.4894 46.2 47.7 49.2 50.7 52.1 53.6 55.1
4:11 59 1 50.6984 0.02943 1.4921 46.2 47.7 49.2 50.7 52.2 53.7 55.2
5: 0 60 1 50.7375 0.02946 1.4947 46.3 47.7 49.2 50.7 52.2 53.7 55.2
3
0
H
ea
d
c
ir
cu
m
fe
re
n
ce
-f
o
r-ag
e,
b
o
y