Department of Nutrition for
Health and Development
W
W
H
H
O
O
C
C
h
h
i
i
l
l
d
d
G
G
r
r
o
o
w
w
t
t
h
h
S
S
t
t
a
a
n
n
d
d
a
a
r
r
d
d
s
s
Growth velocity based on weight, length
and head circumference
WHO Library Cataloguing-in-Publication Data
WHO child growth standards : growth velocity based on weight, length and head circumference : methods and development.
Coordinating team: Mercedes de Onis ... [et al.].
1.Anthropometry - methods. 2.Body size - standards. 3.Child development. 4.Growth. 5.Reference standards. 6.Nutrition assessment. I.de Onis, Mercedes. II.World Health Organization. Dept. of Nutrition for Health and Development.
ISBN 978 92 4 154763 5 (NLM classification: WS 103)
© World Health Organization 2009
All rights reserved. Publications of the World Health Organization can be obtained from WHO Press, World Health Organization, 20 Avenue Appia, 1211 Geneva 27, Switzerland (tel.: +41 22 791 3264; fax: +41 22 791 4857; e-mail: [email protected]). Requests for permission to reproduce or translate WHO publications – whether for sale or for noncommercial distribution – should be addressed to WHO Press, at the above address (fax: +41 22 791 4806; e-mail:
The designations employed and the presentation of the material in this publication do not imply the expression of any opinion whatsoever on the part of the World Health Organization
concerning the legal status of any country, territory, city or area or of its authorities, or concerning the delimitation of its frontiers or boundaries. Dotted lines on maps represent approximate border lines for which there may not yet be full agreement.
The mention of specific companies or of certain manufacturers’ products does not imply that they are endorsed or recommended by the World Health Organization in preference to others of a similar nature that are not mentioned. Errors and omissions excepted, the names of
proprietary products are distinguished by initial capital letters.
All reasonable precautions have been taken by the World Health Organization to verify the information contained in this publication. However, the published material is being distributed without warranty of any kind, either expressed or implied. The responsibility for the
interpretation and use of the material lies with the reader. In no event shall the World Health Organization be liable for damages arising from its use.
- iii -
Members of the WHO Multicentre Growth Reference Study Group
Coordinating Team
Mercedes de Onis [Study Coordinator], Adelheid Onyango, Elaine Borghi, Amani Siyam, Alain Pinol (Department of Nutrition for Health and Development, World Health Organization).
Executive Committee
Cutberto Garza [Chair], Mercedes de Onis, Jose Martines, Reynaldo Martorell, Cesar G. Victora (up to October 2002), Maharaj K. Bhan (from November 2002).
Steering Committee
Coordinating Centre (WHO, Geneva): Mercedes de Onis, Jose Martines, Adelheid Onyango, Alain
Pinol.
Investigators (by country): Cesar G. Victora and Cora Luiza Araújo (Brazil), Anna Lartey and
William B. Owusu (Ghana), Maharaj K. Bhan and Nita Bhandari (India), Kaare R. Norum and Gunn-Elin Aa. Bjoerneboe (Norway), Ali Jaffer Mohamed (Oman), Kathryn G. Dewey (USA).
United Nations Agency Representatives: Cutberto Garza (UNU), Krishna Belbase (UNICEF).
Advisory Group
Maureen Black, Wm. Cameron Chumlea, Tim Cole, Edward Frongillo, Laurence Grummer-Strawn, Reynaldo Martorell, Roger Shrimpton, Jan van den Broeck. For the work presented in this document, Charlotte M Wright, John Himes, Huiqi Pan, Robert Rigby, Mikis Stasinopoulos and Stef van Buuren, participated in an advisory capacity.
Participating countries and investigators
Brazil:Cora Luiza Araújo, Cesar G. Victora, Elaine Albernaz, Elaine Tomasi, Rita de Cássia Fossati
da Silveira, Gisele Nader (Departamento de Nutrição and Departamento de Medicina Social, Universidade Federal de Pelotas; and Núcleo de Pediatria and Escola de Psicologia, Universidade Católica de Pelotas).
Ghana: Anna Lartey, William B. Owusu, Isabella Moses, Veronica Gomez, Charles
Sagoe-Moses (Department of Nutrition and Food Science, University of Ghana; and Ghana Health Service).
India: Nita Bhandari, Maharaj K. Bhan, Sunita Taneja, Temsunaro Rongsen, Jyotsna Chetia, Pooja
Sharma, Rajiv Bahl (All India Institute of Medical Sciences).
Norway: Gunn-Elin Aa. Bjoerneboe, Anne Baerug, Elisabeth Tufte, Kaare R. Norum, Karin Rudvin,
Hilde Nysaether (Directorate of Health and Social Affairs; National Breastfeeding Centre, Rikshospitalet University Hospital; and Institute for Nutrition Research, University of Oslo).
Oman: Ali Jaffer Mohamed, Deena Alasfoor, Nitya S. Prakash, Ruth M. Mabry, Hanadi Jamaan Al
Rajab, Sahar Abdou Helmi (Ministry of Health).
iv
Acknowledgements
The WHO Child Growth Standards were constructed by the Coordinating Team in the Department of Nutrition for Health and Development of the World Health Organization.
The Study Group is indebted to the parents, children and more than 200 field staff that participated in the WHO Multicentre Growth Reference Study. The generous contribution of many individuals that provided expertise and advice was also crucial to the development of the growth standards.
- v -
Contents
Executive summary... xvii
1. Introduction...1
2. Methodology ...5
2.1 Design of the WHO Multicentre Growth Reference Study ...5
2.2 Anthropometry methods ...5
2.3 Sample description ...6
2.4 Data cleaning procedures and correction to target age ...7
2.4.1 Data cleaning...7
2.4.2 Correction to target age ...7
2.5 Statistical methods for constructing the growth velocity standards...8
3. Construction of the weight velocity standards ...11
3.1 Weight velocities conditional on age...11
3.1.1 1-month intervals...11
3.1.2 2-month intervals...12
3.1.3 3-month intervals...13
3.1.4 4-month intervals...14
3.1.5 6-month intervals...15
Appendix A3 Diagnostics...34
A3.1a 1-month intervals for boys...34
A3.1b 1-month intervals for girls ...40
A3.2a 2-month intervals for boys...46
A3.2b 2-month intervals for girls ...52
A3.3a 3-month intervals for boys...58
A3.3b 3-month intervals for girls ...61
A3.4a 4-month intervals for boys...64
A3.4b 4-month intervals for girls ...70
A3.5a 6-month intervals for boys...76
A3.5b 6-month intervals for girls ...82
3.2 Centile tables of weight velocity by birth weight category from birth to 60 days...88
4. Construction of the length velocity standards...93
4.1 2-month intervals ...93
4.2 3-month intervals ...94
4.3 4-month intervals ...95
4.4 6-month intervals ...96
Appendix A4 Diagnostics ...114
A4.1a 2-month intervals for boys...114
A4.1b 2-month intervals for girls ...120
A4.2a 3-month intervals for boys...126
A4.2b 3-month intervals for girls ...129
A4.3a 4-month intervals for boys...132
A4.3b 4-month intervals for girls ...138
A4.4a 6-month intervals for boys...144
A4.4b 6-month intervals for girls ...150
5. Construction of the head circumference velocity standards ...157
5.1 2-month intervals ...157
5.2 3-month intervals ...158
5.3 4-month intervals ...159
5.4 6-month intervals ...160
Appendix A5 Diagnostics ...174
vi
A5.1b 2-month intervals for girls ... 180
A5.2a 3-month intervals for boys ... 186
A5.2b 3-month intervals for girls ... 192
A5.3a 4-month intervals for boys ... 198
A5.3b 4-month intervals for girls ... 204
A5.4a 6-month intervals for boys ... 210
A5.4b 6-month intervals for girls ... 216
6. Computation of centiles and z-scores for velocities based on weight, length and head circumference ... 223
7. Discussion ... 229
8. Bibliography... 235
Appendix B Model specifications of the WHO child growth velocity standards ... 239
- vii -
Figures
Appendix A3
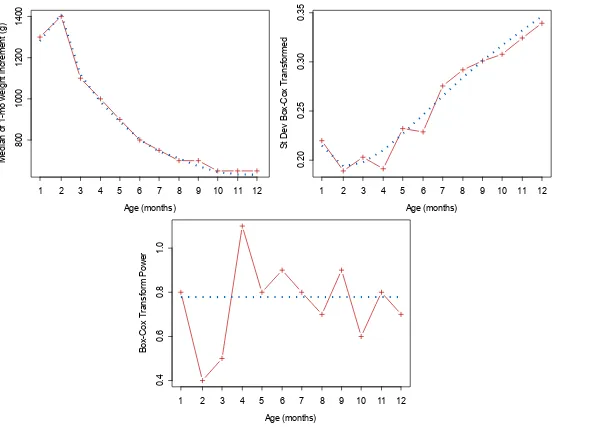
Figure A3.1 Worm plots from selected model [BCPE(x=age0.05, df(µ)=9, df(σ)=4, df(ν)=4, τ=2)] for 1-month weight velocity for boys ...35 Figure A3.2 Fitting of the µ, σ, and ν curves of selected model for 1-month weight velocity
for boys...36
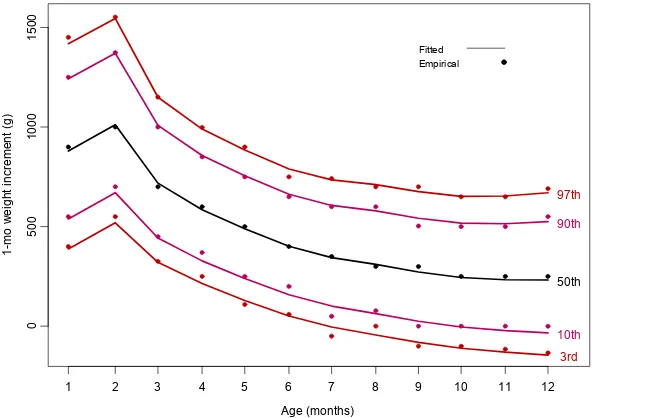
Figure A3.3 3rd, 10th, 50th, 90th, 97th smoothed centile curves and empirical values:
1-month weight velocity for boys...37
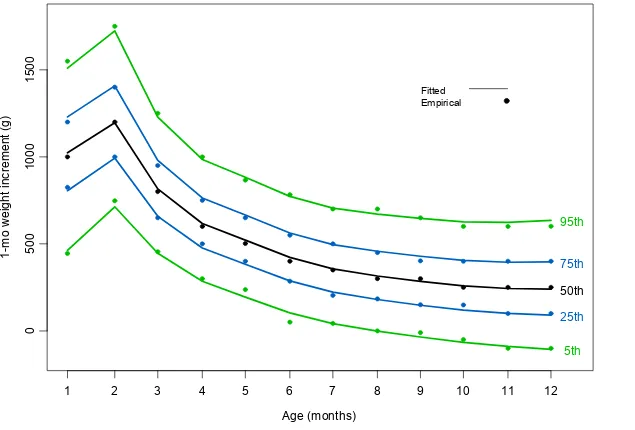
Figure A3.4 5th, 25th, 50th, 75th, 95th smoothed centile curves and empirical values:
1-month weight velocity for boys...38
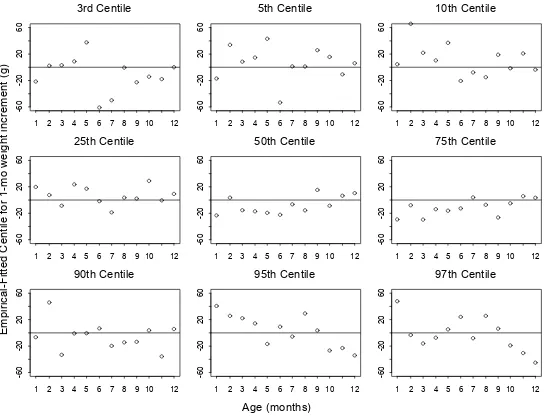
Figure A3.5 Centile residuals from fitting selected model for 1-month weight velocity
for boys...39
Figure A3.6 Worm plots from selected model [BCPE(x=age0.05, df(µ)=9, df(σ)=4, df(ν)=1, τ=2)] for 1-month weight velocity for girls ...41 Figure A3.7 Fitting of the µ, σ, and ν curves of selected model for 1-month weight velocity
for girls ...42
Figure A3.8 3rd, 10th, 50th, 90th, 97th smoothed centile curves and empirical values:
1-month weight velocity for girls ...43
Figure A3.9 5th, 25th, 50th, 75th, 95th smoothed centile curves and empirical values:
1-month weight velocity for girls ...44
Figure A3.10 Centile residuals from fitting selected model for 1-month weight velocity
for girls ...45
Figure A3.11 Worm plots from selected model [BCPE(x=age0.05, df(µ)=12, df(σ)=6, df(ν)=3, τ=2)] for 2-month weight velocity for boys ...47 Figure A3.12 Fitting of the µ, σ, and ν curves of selected model for 2-month weight velocity
for boys...48
Figure A3.13 3rd, 10th, 50th, 90th, 97th smoothed centile curves and empirical values:
2-month weight velocity for boys...49
Figure A3.14 5th, 25th, 50th, 75th, 95th smoothed centile curves and empirical values:
2-month weight velocity for boys...50
Figure A3.15 Centile residuals from fitting selected model for 2-month weight velocity
for boys...51
Figure A3.16 Worm plots from selected model [BCPE(x=age0.05, df(µ)=12, df(σ)=5, df(ν)=4, τ=2)] for 2-month weight velocity for girls ...53 Figure A3.17 Fitting of the µ, σ, and ν curves of selected model for 2-month weight velocity
for girls ...54
Figure A3.18 3rd, 10th, 50th, 90th, 97th smoothed centile curves and empirical values:
2-month weight velocity for girls ...55
Figure A3.19 5th, 25th, 50th, 75th, 95th smoothed centile curves and empirical values:
2-month weight velocity for girls ...56
Figure A3.20 Centile residuals from fitting selected model for 2-month weight velocity
viii
Figure A3.21 3rd, 10th, 50th, 90th, 97th smoothed centile curves and empirical values:
3-month weight velocity for boys... 58
Figure A3.22 5th, 25th, 50th, 75th, 95th smoothed centile curves and empirical values:
3-month weight velocity for boys... 59
Figure A3.23 Centile residuals from fitting selected model for 3-month weight velocity
for boys ... 60
Figure A3.24 3rd, 10th, 50th, 90th, 97th smoothed centile curves and empirical values:
3-month weight velocity for girls ... 61
Figure A3.25 5th, 25th, 50th, 75th, 95th smoothed centile curves and empirical values:
3-month weight velocity for girls ... 62
Figure A3.26 Centile residuals from fitting selected model for 3-month weight velocity
for girls ... 63
Figure A3.27 Worm plots from selected model [BCPE(x=age0.05, df(µ)=11, df(σ)=5, df(ν)=5, τ=2)] for 4-month weight velocity for boys... 65 Figure A3.28 Fitting of the µ, σ, and ν curves of selected model for 4-month weight velocity
for boys ... 66
Figure A3.29 3rd, 10th, 50th, 90th, 97th smoothed centile curves and empirical values:
4-month weight velocity for boys... 67
Figure A3.30 5th, 25th, 50th, 75th, 95th smoothed centile curves and empirical values:
4-month weight velocity for boys... 68
Figure A3.31 Centile residuals from fitting selected model for 4-month weight velocity
for boys ... 69
Figure A3.32 Worm plots from selected model [BCPE(x=age0.05, df(µ)=9, df(σ)=5, df(ν)=5, τ=2)] for 4-month weight velocity for girls ... 71 Figure A3.33 Fitting of the µ, σ, and ν curves of selected model for 4-month weight velocity
for girls ... 72
Figure A3.34 3rd, 10th, 50th, 90th, 97th smoothed centile curves and empirical values:
4-month weight velocity for girls ... 73
Figure A3.35 5th, 25th, 50th, 75th, 95th smoothed centile curves and empirical values:
4-month weight velocity for girls ... 74
Figure A3.36 Centile residuals from fitting selected model for 4-month weight velocity
for girls ... 75
Figure A3.37 Worm plots from selected model [BCPE(x=age0.05, df(µ)=10, df(σ)=5, df(ν)=3, τ=2)] for 6-month weight velocity for boys... 77 Figure A3.38 Fitting of the µ, σ, and ν curves of selected model for 6-month weight velocity
for boys ... 78
Figure A3.39 3rd, 10th, 50th, 90th, 97th smoothed centile curves and empirical values:
6-month weight velocity for boys... 79
Figure A3.40 5th, 25th, 50th, 75th, 95th smoothed centile curves and empirical values:
6-month weight velocity for boys... 80
Figure A3.41 Centile residuals from fitting selected model for 6-month weight velocity
for boys ... 81
- ix -
Figure A3.43 Fitting of the µ, σ, and ν curves of selected model for 6-month weight velocity for girls ...84
Figure A3.44 3rd, 10th, 50th, 90th, 97th smoothed centile curves and empirical values:
6-month weight velocity for girls ...85
Figure A3.45 5th, 25th, 50th, 75th, 95th smoothed centile curves and empirical values:
6-month weight velocity for girls ...86
Figure A3.46 Centile residuals from fitting selected model for 6-month weight velocity
for girls ...87
Appendix A4
Figure A4.1 Worm plots from selected model [BCPE(x=age0.05, df(µ)=9, df(σ)=7, df(ν)=1, τ=2)] for 2-month length velocity for boys ...115 Figure A4.2 Fitting of the µ, σ, and ν curves of selected model for 2-month length velocity
for boys...116
Figure A4.3 3rd, 10th, 50th, 90th, 97th smoothed centile curves and empirical values:
2-month length velocity for boys ...117
Figure A4.4 5th, 25th, 50th, 75th, 95th smoothed centile curves and empirical values:
2-month length velocity for boys ...118
Figure A4.5 Centile residuals from fitting selected model for 2-month length velocity
for boys...119
Figure A4.6 Worm plots from selected model [BCPE(x=age0.05, df(µ)=10, df(σ)=7, df(ν)=1, τ=2)] for 2-month length velocity for girls...121 Figure A4.7 Fitting of the µ, σ, and ν curves of selected model for 2-month length velocity
for girls ...122
Figure A4.8 3rd, 10th, 50th, 90th, 97th smoothed centile curves and empirical values:
2-month length velocity for girls ...123
Figure A4.9 5th, 25th, 50th, 75th, 95th smoothed centile curves and empirical values:
2-month length velocity for girls ...124
Figure A4.10 Centile residuals from fitting selected model for 2-month length velocity
for girls ...125
Figure A4.11 3rd, 10th, 50th, 90th, 97th smoothed centile curves and empirical values:
3-month length velocity for boys ...126
Figure A4.12 5th, 25th, 50th, 75th, 95th smoothed centile curves and empirical values:
3-month length velocity for boys ...127
Figure A4.13 Centile residuals from fitting selected model for 3-month length velocity
for boys...128
Figure A4.14 3rd, 10th, 50th, 90th, 97th smoothed centile curves and empirical values:
3-month length velocity for girls ...129
Figure A4.15 5th, 25th, 50th, 75th, 95th smoothed centile curves and empirical values:
3-month length velocity for girls ...130
Figure A4.16 Centile residuals from fitting selected model for 3-month length velocity
for girls ...131
x
Figure A4.18 Fitting of the µ, σ, and ν curves of selected model for 4-month length velocity for boys ... 134
Figure A4.19 3rd, 10th, 50th, 90th, 97th smoothed centile curves and empirical values:
4-month length velocity for boys... 135
Figure A4.20 5th, 25th, 50th, 75th, 95th smoothed centile curves and empirical values:
4-month length velocity for boys... 136
Figure A4.21 Centile residuals from fitting selected model for 4-month length velocity
for boys ... 137
Figure A4.22 Worm plots from selected model [BCPE(x=age0.05, df(µ)=8, df(σ)=5, df(ν)=1, τ=2)] for 4-month length velocity for girls ... 139 Figure A4.23 Fitting of the µ, σ, and ν curves of selected model for 4-month length velocity
for girls ... 140
Figure A4.24 3rd, 10th, 50th, 90th, 97th smoothed centile curves and empirical values:
4-month length velocity for girls ... 141
Figure A4.25 5th, 25th, 50th, 75th, 95th smoothed centile curves and empirical values:
4-month length velocity for girls ... 142
Figure A4.26 Centile residuals from fitting selected model for 4-month length velocity
for girls ... 143
Figure A4.27 Worm plots from selected model [BCPE(x=age0.05, df(µ)=7, df(σ)=5, df(ν)=1, τ=2)] for 6-month length velocity for boys... 145 Figure A4.28 Fitting of the µ, σ, and ν curves of selected model for 6-month length velocity
for boys ... 146
Figure A4.29 3rd, 10th, 50th, 90th, 97th smoothed centile curves and empirical values:
6-month length velocity for boys... 147
Figure A4.30 5th, 25th, 50th, 75th, 95th smoothed centile curves and empirical values:
6-month length velocity for boys... 148
Figure A4.31 Centile residuals from fitting selected model for 6-month length velocity
for boys ... 149
Figure A4.32 Worm plots from selected model [BCPE(x=age0.05, df(µ)=7, df(σ)=4, df(ν)=1, τ=2)] for 6-month length velocity for girls ... 151 Figure A4.33 Fitting of the µ, σ, and ν curves of selected model for 6-month length velocity
for girls ... 152
Figure A4.34 3rd, 10th, 50th, 90th, 97th smoothed centile curves and empirical values:
6-month length velocity for girls ... 153
Figure A4.35 5th, 25th, 50th, 75th, 95th smoothed centile curves and empirical values:
6-month length velocity for girls ... 154
Figure A4.36 Centile residuals from fitting selected model for 6-month length velocity
for girls ... 155
Appendix A5
Figure A5.1 Worm plots from selected model [BCPE(x=age0.05, df(µ)=8, df(σ)=4, df(ν)=4, τ=2)] for 2-month head circumference velocity for boys ... 175 Figure A5.2 Fitting of the µ, σ, and ν curves of selected model for 2-month head
- xi -
Figure A5.3 3rd, 10th, 50th, 90th, 97th smoothed centile curves and empirical values:
2-month head circumference velocity for boys ...177
Figure A5.4 5th, 25th, 50th, 75th, 95th smoothed centile curves and empirical values:
2-month head circumference velocity for boys ...178
Figure A5.5 Centile residuals from fitting selected model for 2-month head circumference
velocity for boys ...179
Figure A5.6 Worm plots from selected model [BCPE(x=age0.05, df(µ)=8, df(σ)=4, df(ν)=1, τ=2)] for 2-month head circumference velocity for girls ...181 Figure A5.7 Fitting of the µ, σ, and ν curves of selected model for 2-month head
circumference velocity for girls...182
Figure A5.8 3rd, 10th, 50th, 90th, 97th smoothed centile curves and empirical values:
2-month head circumference velocity for girls...183
Figure A5.9 5th, 25th, 50th, 75th, 95th smoothed centile curves and empirical values:
2-month head circumference velocity for girls...184
Figure A5.10 Centile residuals from fitting selected model for 2-month head circumference
velocity for girls ...185
Figure A5.11 Worm plots from selected model [BCPE(x=age0.05, df(µ)=7, df(σ)=4, df(ν)=4, τ=2)] for 3-month head circumference velocity for boys ...187 Figure A5.12 Fitting of the µ, σ, and ν curves of selected model for 3-month head
circumference velocity for boys ...188
Figure A5.13 3rd, 10th, 50th, 90th, 97th smoothed centile curves and empirical values:
3-month head circumference velocity for boys ...189
Figure A5.14 5th, 25th, 50th, 75th, 95th smoothed centile curves and empirical values:
3-month head circumference velocity for boys ...190
Figure A5.15 Centile residuals from fitting selected model for 3-month head circumference
velocity for boys ...191
Figure A5.16 Worm plots from selected model [BCPE(x=age0.05, df(µ)=7, df(σ)=4, df(ν)=2, τ=2)] for 3-month head circumference velocity for girls ...193 Figure A5.17 Fitting of the µ, σ, and ν curves of selected model for 3-month head
circumference velocity for girls...194
Figure A5.18 3rd, 10th, 50th, 90th, 97th smoothed centile curves and empirical values:
3-month head circumference velocity for girls...195
Figure A5.19 5th, 25th, 50th, 75th, 95th smoothed centile curves and empirical values:
3-month head circumference velocity for girls...196
Figure A5.20 Centile residuals from fitting selected model for 3-month head circumference
velocity for girls ...197
Figure A5.21 Worm plots from selected model [BCPE(x=age0.05, df(µ)=10, df(σ)=5, df(ν)=3, τ=2)] for 4-month head circumference velocity for boys ...199 Figure A5.22 Fitting of the µ, σ, and ν curves of selected model for 4-month head
circumference velocity for boys ...200
Figure A5.23 3rd, 10th, 50th, 90th, 97th smoothed centile curves and empirical values:
4-month head circumference velocity for boys ...201
Figure A5.24 5th, 25th, 50th, 75th, 95th smoothed centile curves and empirical values:
xii
Figure A5.25 Centile residuals from fitting selected model for 4-month head circumference
velocity for boys ... 203
Figure A5.26 Worm plots from selected model [BCPE(x=age0.05, df(µ)=10, df(σ)=5, df(ν)=2, τ=2)] for 4-month head circumference velocity for girls... 205
Figure A5.27 Fitting of the µ, σ, and ν curves of selected model for 4-month head circumference velocity for girls ... 206
Figure A5.28 3rd, 10th, 50th, 90th, 97th smoothed centile curves and empirical values: 4-month head circumference velocity for girls... 207
Figure A5.29 5th, 25th, 50th, 75th, 95th smoothed centile curves and empirical values: 4-month head circumference velocity for girls... 208
Figure A5.30 Centile residuals from fitting selected model for 4-month head circumference velocity for girls... 209
Figure A5.31 Worm plots from selected model [BCPE(x=age0.05, df(µ)=9, df(σ)=4, df(ν)=2, τ=2)] for 6-month head circumference velocity for boys ... 211
Figure A5.32 Fitting of the µ, σ, and ν curves of selected model for 6-month head circumference velocity for boys ... 212
Figure A5.33 3rd, 10th, 50th, 90th, 97th smoothed centile curves and empirical values: 6-month head circumference velocity for boys ... 213
Figure A5.34 5th, 25th, 50th, 75th, 95th smoothed centile curves and empirical values: 6-month head circumference velocity for boys ... 214
Figure A5.35 Centile residuals from fitting selected model for 6-month head circumference velocity for boys ... 215
Figure A5.36 Worm plots from selected model [BCPE(x=age0.05, df(µ)=9, df(σ)=5, df(ν)=2, τ=2)] for 6-month head circumference velocity for girls... 217
Figure A5.37 Fitting of the µ, σ, and ν curves of selected model for 6-month head circumference velocity for girls ... 218
Figure A5.38 3rd, 10th, 50th, 90th, 97th smoothed centile curves and empirical values: 6-month head circumference velocity for girls... 219
Figure A5.39 5th, 25th, 50th, 75th, 95th smoothed centile curves and empirical values: 6-month head circumference velocity for girls... 220
Figure A5.40 Centile residuals from fitting selected model for 6-month head circumference velocity for girls... 221
Appendix C Figure C1 Comparison between 1-month WHO weight increment z-scores and SDgain... 241
Figure C2 Comparison between 2-month WHO weight increment z-scores and SDgain... 241
Figure C3 Differences between 1-month WHO weight increment z-scores and SDgain... 242
- xiii -
Tables
Table 1 Total sample and number of compliant children in the longitudinal
component ...6
Table 2 Maximum tolerable differences in days between planned and actual measurement ages...7
Table 3 Number of increments available for the construction of the WHO child growth velocity standards by sex and anthropometric indicator ...8
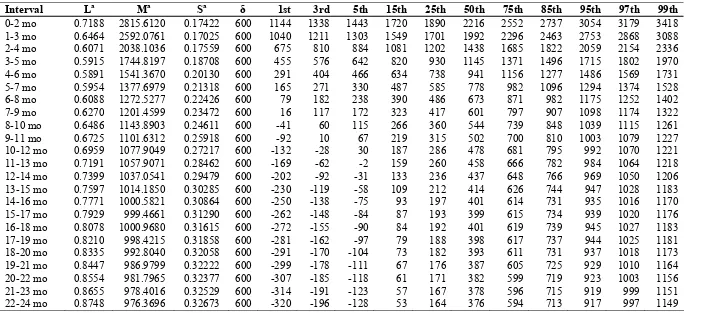
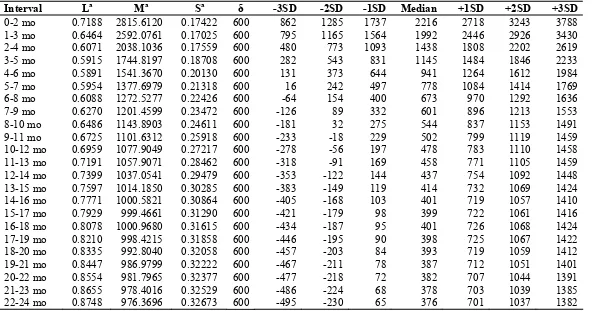
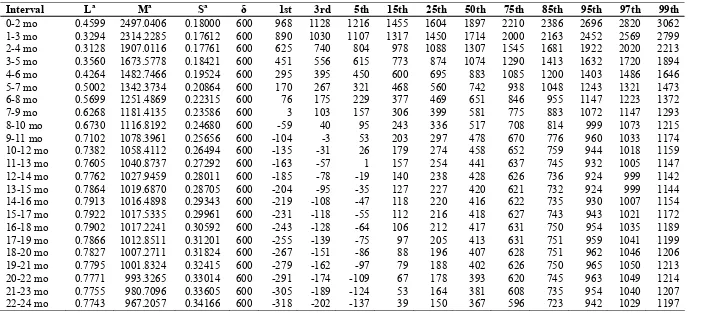
Table 4 Boys 1-month weight increments (g) ...16
Table 5 Girls 1-month weight increments (g)...17
Table 6 Boys 2-month weight increments (g) ...18
Table 7 Girls 2-month weight increments (g)...20
Table 8 Boys 3-month weight increments (g) ...22
Table 9 Girls 3-month weight increments (g)...24
Table 10 Boys 4-month weight increments (g) ...26
Table 11 Girls 4-month weight increments (g)...28
Table 12 Boys 6-month weight increments (g) ...30
Table 13 Girls 6-month weight increments (g)...32
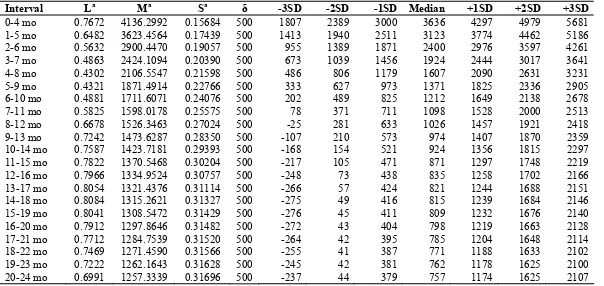
Table 14 Boys weight increments (g) by birth-weight groups ...89
Table 15 Boys weight velocity (g/d) by birth-weight groups ...90
Table 16 Girls weight increments (g) by birth-weight groups...91
Table 17 Girls weight velocity (g/d) by birth-weight groups ...92
Table 18 Boys 2-month length increments (cm) ...98
Table 19 Girls 2-month length increments (cm)...100
Table 20 Boys 3-month length increments (cm) ...102
Table 21 Girls 3-month length increments (cm)...104
Table 22 Boys 4-month length increments (cm) ...106
Table 23 Girls 4-month length increments (cm)...108
Table 24 Boys 6-month length increments (cm) ...110
Table 25 Girls 6-month length increments (cm)...112
Table 26 Boys 2-month head circumference increments (cm) ...162
Table 27 Girls 2-month head circumference increments (cm) ...163
Table 28 Boys 3-month head circumference increments (cm) ...164
Table 29 Girls 3-month head circumference increments (cm) ...165
Table 30 Boys 4-month head circumference increments (cm) ...166
Table 31 Girls 4-month head circumference increments (cm) ...168
Table 32 Boys 6-month head circumference increments (cm) ...170
xiv
Appendix A3
Table A3.1 Q-test for z-scores from selected model [BCPE(x=age0.05, df(µ)=9, df(σ)=4,
df(ν)=4, τ=2)] for 1-month weight velocity for boys ... 34 Table A3.2 Q-test for z-scores from selected model [BCPE(x=age0.05, df(µ)=9, df(σ)=4,
df(ν)=1, τ=2)] for 1-month weight velocity for girls... 40 Table A3.3 Q-test for z-scores from selected model [BCPE(x=age0.05, df(µ)=12, df(σ)=6,
df(ν)=3, τ=2)] for 2-month weight velocity for boys ... 46
Table A3.4 Q-test for z-scores from selected model [BCPE(x=age0.05, df(µ)=12, df(σ)=5,
df(ν)=4, τ=2)] for 2-month weight velocity for girls... 52
Table A3.5 Q-test for z-scores from selected model [BCPE(x=age0.05, df(µ)=11, df(σ)=5,
df(ν)=5, τ=2)] for 4-month weight velocity for boys ... 64
Table A3.6 Q-test for z-scores from selected model [BCPE(x=age0.05, df(µ)=9, df(σ)=5,
df(ν)=5, τ=2)] for 4-month weight velocity for girls... 70
Table A3.7 Q-test for z-scores from selected model [BCPE(x=age0.05, df(µ)=10, df(σ)=5,
df(ν)=3, τ=2)] for 6-month weight velocity for boys ... 76
Table A3.8 Q-test for z-scores from selected model [BCPE(x=age0.05, df(µ)=7, df(σ)=5,
df(ν)=4, τ=2)] for 6-month weight velocity for girls... 82
Appendix A4
Table A4.1 Q-test for z-scores from selected model [BCPE(x=age0.05, df(µ)=9, df(σ)=7,
df(ν)=1, τ=2)] for 2-month length velocity for boys ... 114
Table A4.2 Q-test for z-scores from selected model [BCPE(x=age0.05, df(µ)=10, df(σ)=7,
df(ν)=1, τ=2)] for 2-month length velocity for girls ... 120
Table A4.3 Q-test for z-scores from selected model [BCPE(x=age0.05, df(µ)=8, df(σ)=5,
df(ν)=1, τ=2)] for 4-month length velocity for boys ... 132
Table A4.4 Q-test for z-scores from selected model [BCPE(x=age0.05, df(µ)=8, df(σ)=5,
df(ν)=1, τ=2)] for 4-month length velocity for girls ... 138
Table A4.5 Q-test for z-scores from selected model [BCPE(x=age0.05, df(µ)=7, df(σ)=5,
df(ν)=1, τ=2)] for 6-month length velocity for boys ... 144
Table A4.6 Q-test for z-scores from selected model [BCPE(x=age0.05, df(µ)=7, df(σ)=4,
df(ν)=1, τ=2)] for 6-month length velocity for girls ... 150
Appendix A5
Table A5.1 Q-test for z-scores from selected model [BCPE(x=age0.05, df(µ)=8, df(σ)=4,
df(ν)=4, τ=2)] for 2-month head circumference velocity for boys... 174
Table A5.2 Q-test for z-scores from selected model [BCPE(x=age0.05, df(µ)=8, df(σ)=4,
df(ν)=1, τ=2)] for 2-month head circumference velocity for girls ... 180
Table A5.3 Q-test for z-scores from selected model [BCPE(x=age0.05, df(µ)=7, df(σ)=4,
df(ν)=4, τ=2)] for 3-month head circumference velocity for boys... 186
Table A5.4 Q-test for z-scores from selected model [BCPE(x=age0.05, df(µ)=7, df(σ)=4,
df(ν)=2, τ=2)] for 3-month head circumference velocity for girls ... 192 Table A5.5 Q-test for z-scores from selected model [BCPE(x=age0.05, df(µ)=10, df(σ)=5,
- xv -
Table A5.6 Q-test for z-scores from selected model [BCPE(x=age0.05, df(µ)=10, df(σ)=5,
df(ν)=2, τ=2)] for 4-month head circumference velocity for girls...204 Table A5.7 Q-test for z-scores from selected model [BCPE(x=age0.05, df(µ)=9, df(σ)=4,
df(ν)=2, τ=2)] for 6-month head circumference velocity for boys ...210
Table A5.8 Q-test for z-scores from selected model [BCPE(x=age0.05, df(µ)=9, df(σ)=5,
df(ν)=2, τ=2)] for 6-month head circumference velocity for girls...216
Appendix B
Table B1 Degrees of freedom for fitting the parameters of the Box-Cox-power exponential (BCPE) distribution for the models with the best fit to generate standards based on age, weight, length, and head circumference in children 0-24 months of age ...239
Appendix C
- xvi -
Glossary
BCPE The Box-Cox power exponential distribution.
µ The median of the Box-Cox power exponential distribution.
σ The approximate coefficient of variation of the Box-Cox power exponential distribution — related to the variance.
ν The power of the Box-Cox transformation (to the normal
distribution) of the Box-Cox power exponential distribution - related to the skewness.
τ The power exponential parameter of the Box-Cox power
exponential distribution — related to the kurtosis.
λ The power of the age (or starting weight) transformation.
δ A constant value (delta) added to weight increments.
Box-Cox transformation A power transformation to the normal distribution.
Coefficient of variation The ratio of the standard deviation to the mean.
Cubic spline A piecewise third-order polynomial function that passes through
a set of m (or degrees of freedom) control points; it can have a very simple form locally, yet be globally flexible and smooth.
Cut-off A designated limit beyond which a subject or observation is
classified according to a pre-set condition.
Degrees of freedom (df) The number of control points used to fit the cubic splines.
Kurtosis An attribute of a distribution describing "peakedness". A high
kurtosis portrays a distribution with fat tails in contrast to a low kurtosis, which portrays a distribution with skinny tails.
P-value The probability of falsely rejecting the hypothesis being tested.
In this report all p-values were compared to a level of significance set to 0.05.
Q-test A statistical test which combines overall and local tests
assessing departures from the normal distribution with respect to median, variance, skewness and kurtosis.
Skewness A statistical term used to describe a distribution's asymmetry in
relation to a normal distribution.
Standard deviation score (SD) See z-score.
Worm plots A set of detrended Q-Q plots — plots that compare the
distribution of a given set of observations to the normal distribution.
Z-score The deviation of an individual's value from the median value of
- xvii -
Executive summary
In 1993, the World Health Organization (WHO) undertook a comprehensive review of the uses and interpretation of anthropometric references. The review concluded that the National Center for Health Statistics (NCHS)/WHO growth reference, which had been recommended for international use since the late 1970s, did not adequately represent early childhood growth and that new growth curves were necessary. The World Health Assembly endorsed this recommendation in 1994. In response, the WHO Multicentre Growth Reference Study (MGRS) was implemented between 1997 and 2003 to develop international growth standards for children below 5 years of age. The MGRS is unique in that it was purposely designed to produce a standard by selecting healthy children from diverse ethnic backgrounds living under conditions likely to favour the achievement of their full genetic growth potential. Furthermore, the mothers of the children selected for the construction of the standards engaged in fundamental health-promoting practices, namely breastfeeding and not smoking. The first set of the WHO Child Growth Standards for attained growth based on length/height, weight and age was released in April 2006. The second complementary set, based on head and arm circumference and subscapular and triceps skinfolds, followed a year later.
A key component in the MGRS design was a longitudinal cohort of children who were examined in a sequence of 21 visits starting at birth and ending at 24 months of age. Such frequently collected and well-controlled data are highly unusual. A principal rationale for the MGRS longitudinal component was to allow for the development of growth velocity standards. The increments on which the velocity standards are based were calculated using the longitudinal sample of 882 children (428 boys and 454 girls) whose mothers complied fully with the MGRS infant-feeding and no-smoking criteria and completed the follow-up period of 24 months. The children were measured at birth; at weeks 1, 2, 4 and 6; monthly from 2–12 months; and bimonthly in the second year.
On the recommendation of a consultative expert group it was decided to develop velocity standards for the following anthropometric variables: weight (the most commonly used measurement and the most responsive to short-term influences), head circumference (the next most-used measurement in clinical settings), and length (potentially useful since stunting originates in the first two years of life, and early detection of changes in velocity may be beneficial for prevention). It was hypothesized that body mass index (BMI) velocity might be useful in predicting changes leading to extremes of adiposity. However, unreliability in BMI increments is a composite of measurement error from various sources. Moreover, BMI peaks during infancy and then drops through the second year. These characteristics make BMI velocity difficult to interpret, and there is little knowledge of its prognostic utility. Therefore, BMI velocity standards were not developed.
Another recommendation by the consultative expert group on the construction of the velocity curves was to explore other distributions in addition to the one used to construct the attained growth standards (the Box-Cox-power-exponential — BCPE). This investigation was carried out in an effort to identify the most appropriate methodology for handling anticipated negative increments specifically in relation to weight. The findings favoured the application of the BCPE distribution with some methodological adjustments only in the case of weight conditional on age. The steps followed to select the best models to fit the data for each indicator were comparable to those used to construct the attained growth standards.
xviii
centiles, it was decided not to fit kurtosis (i.e. models were restricted to the LMS class). The diagnostic tools used iteratively to detect possible model misfits and biases in the fitted curves included tests of local and global goodness of fit, such as Q-tests and worm plots. Patterns of differences between empirical and fitted centiles were also examined.
Following wide consultation with different potential users of these standards (e.g. paediatric endocrinologists, neonatologists, lactation counsellors, managers of child health programmes, and researchers), the increments presented in this report are those considered to be most useful clinically. The WHO velocity standards for weight are presented as 1-mo increments from birth to 12 months, and as 2- to 6-month incements from birth to 24 months. In addition, weight increments are presented from birth to 60 days in 1-week and 2-week intervals that coincide with the measurement schedule in the MGRS. The velocity standards for length are presented in 2- to 6-month increments from birth to 24 months. For head circumference, 2- and 3-month increments are presented from birth to 12 months, and 4- and 6-month increments from birth to 24 months. One-month increments for length and head circumference were not considered clinically useful as the measurement error over such a short period exceeds the 5th centile as early as 6 months of age. For similar reasons, the 2- and 3-month increments for head circumference go up to 12 months of age only. The overall choice of intervals is in line with those proposed by other authors. Electronic copies of the full set of velocity standards are available on the Web: www.who.int/childgrowth/en.
The intrinsic biological complexity of the dynamics of human growth makes the use and interpretation of the standards presented in this report more challenging than that of the attained growth standards. Growth progresses at a rapidly decelerating rate from birth, reaching a near-plateau by the end of the first year, and continues to taper off gently through the second year. This is the expected overall pattern of growth under conditions of adequate nutrition and psychosocial care. However, growth velocities of individual children are characterized by very high variability in consecutive growth intervals. It is not unusual for a child to grow at the 95th velocity centile one month and at the 20th the next while continuing to track on the attained weight-for-age chart. Correlations between subsequent increments are typically low; this reflects both a natural pattern of saltatory growth and possible catch-up or catch-down growth that contributes to overall narrowly canalized patterns in the attained growth trajectories of individual children.
The 1-, 2-, 3-, 4- and 6-month increment tables are independent of each other and the clinician should use the one that most closely approximates the interval over which the child is seen. For example, the centile corresponding to an increment between age 2 and 3 months is not associated with the centile corresponding to half of the increment in the 2-month interval between ages 1 and 3 months. This is because one cannot expect the growth rate in a given 2-month period, except perhaps at the median, to be the sum of the two corresponding 1-month intervals. With specific reference to weight, negative increments, which generally occur after 6 months of age, are captured in the lowest centiles. They coincide with the weaning period, when children are more exposed to food contamination, and when they become more active and start to explore their environment.
- xix -
breastfeeding difficulties in the early postpartum period, lactation performance and weight gain are monitored every few days, hence increments per day are likely to be handier to use than weekly or fortnightly increments. However, even in the absence of such difficulties, visits to the clinic take place at random ages, and these daily increments offer a flexible option for evaluating growth over fractions of the tabulated time blocks.
Measurements of growth are subject to error from multiple sources. Faulty measurements can lead to grossly erroneous judgements regarding a child's growth. The accuracy of growth assessment is improved greatly if measurements are replicated independently and the values averaged. Although the high level of reliability achieved in the MGRS is unlikely to be reached in routine clinical measurement in primary health care settings, measurements need to be taken with reasonable care and accuracy as the calculation of increments involves two measurement errors.
Ideally, velocity assessment should be done at scheduled visits that coincide with the ages and intervals (1, 2, 3, 4 and 6 months) for which the centiles are presented. In practice, however, the timing of clinic visits is dictated by uncontrollable factors, and ingenuity will be called for in applying the standards. The discussion section of the report provides overall guidance on interpreting increments that are beyond the allowable range of variation around the intervals, or observed intervals that are on target (say exactly 2 months) but with starting and ending ages that do not coincide with those tabulated in the standards.
There are some fundamental differences between velocity and attained (distance) growth that affect how the increment standards should be used and interpreted. Chief among them is the lack of correlation between successive increments in healthy, normally growing children. For individual attained growth curves, the variability in successive z-scores tends to be minimal over short periods (there are high correlations between successive attained values). This "tracking" is not usually seen for successive individual growth velocities. In the WHO standards, the probability of two consecutive 1-month or 2-month weight increments falling below the 5th centile is 0.3%. If the 15th centile is chosen, this probability increases to only 2% and 1.8%, respectively. Normally growing children can have a very high z-score one month and a very low one the following month, or vice versa, without any underlying reason for concern. Thus, a single low value is not informative; only when velocities are repeatedly low should they cause concern. Nevertheless, very low z-score values, even if observed only once, should raise the question of whether there is underlying morbidity within the holistic clinical assessment of the child.
During periods of severe illness (e.g. prolonged diarrhoea) one would expect very low velocity followed by compensatory high velocity (catch-up). During catch-up growth, one would expect successive increments to be repeatedly in the higher ranges. An important difference with attained growth is that single extreme values of increments are comparatively less worrisome. Ultimately, growth velocity must always be interpreted in conjunction with attained growth, since the position on the attained growth chart is essential to interpreting the growth rate.
- 1 -
1.
INTRODUCTION
The WHO Multicentre Growth Reference Study (MGRS) was implemented between 1997 and 2003 to develop growth standards for children below 5 years of age. The MGRS collected primary growth data and related information from 8440 healthy breastfed infants and young children from diverse ethnic backgrounds and cultural settings (de Onis et al., 2004a). The first set of the WHO Child Growth Standards based on length/height, weight and age that describe the attained growth of healthy children was released in April 2006. The second complementary set, based on head and arm circumference and subscapular and triceps skinfolds, followed a year later (WHO Multicentre Growth Reference Study Group, 2006a; 2007). The standards are based on a prescriptive approach using well-defined criteria, rigorous data-collection methods, sound data-management procedures, and state-of-the art statistical methods (de Onis et al., 2004b; Borghi et al., 2006).
A key component in the MGRS design was a longitudinal cohort of children who were examined in a sequence of 21 visits starting at birth and ending at 24 months of age. Such frequently collected and well-controlled data are highly unusual, especially given the study's rigorous inclusion criteria (de Onis et al., 2004b). A principal rationale for the MGRS longitudinal component was to allow for development of velocity growth standards.
Proponents of the use of growth velocity consider it a superior quantitative measure of growth compared to attained size for age (Tanner, 1952; Roche and Himes, 1980; Baumgartner et al., 1986; Guo et al., 1991). They point out that, whereas pathogenic factors affect growth velocity directly, their impact on attained size becomes evident only after the altered rate of growth has had time to produce its result (Tanner, 1952). In other words, examining velocity should lead to earlier identification of growth problems than would the examination of attained growth only. Despite their hypothesized advantage, there are far fewer velocity references than there are for attained growth, in part due to scarcity of appropriate longitudinal datasets.
This report presents the WHO growth velocity standards and describes the methods used to construct the standards for weight conditional on age, weight conditional on age and birth weight, length conditional on age, and head circumference conditional on age. Strictly speaking, velocity is a change in value expressed in units per time period (e.g. g/time), while an increment is a change in value expressed in units (e.g. grams). Nevertheless, since the increments presented in this report refer to specific time periods (i.e. 1- to 6-month intervals), the terms velocity and increment will be used interchangeably.
As part of the preparatory work for the construction of the standards presented in this report, an advisory group met in March 2007 to review uses of growth velocity standards in clinical practice, public health programmes, and research settings and to discuss available strategies and related methods for the construction of the velocity standards. Two background documents were prepared to guide the advisory group's discussions, one on technical and statistical issues (Himes and Frongillo, 2007) and another on the presentation and application of such standards (Wright, 2007).
Among technical issues discussed, the first was whether to model increments (i.e. using measurements) or changes in z-scores. The complexity in applying growth velocity using available presentation formats associated with the z-score scale was recognized.
2 Introduction
variables and intervals, and whether data should be displayed as tables or curves. The need for guidance on the use and interpretation of velocity standards was also recognized. It was decided to develop velocity standards for the following anthropometric variables: weight (the most commonly used measurement and the most responsive to short-term influences); head circumference (the next most-used measurement in clinical settings, mainly by neonatologists and others caring for infants); and length (potentially useful since stunting originates in the first two years of life, and detecting changes in velocity during this period may be beneficial in terms of prevention). It was hypothesized that BMI velocity might be useful in predicting changes leading to extremes of adiposity. However, unreliability in BMI increments is a composite of measurement error from various sources. Moreover, BMI peaks during infancy and then drops through the second year. These characteristics make BMI velocity difficult to interpret, and there is little knowledge of its prognostic utility. Therefore, BMI velocity standards were not developed. The final choice of variables (weight, length and head circumference) is similar to other published velocity references (Falkner, 1958; Tanner et al., 1966a, 1966b; Roche and Himes, 1980; Tanner and Davies, 1985; Baumgartner et al., 1986; Roche et al., 1989; Guo et al., 1991; van't Hof et al., 2000).
When selecting measurement intervals, account should be taken of the fact that the calculation of increments involves two measurement errors; hence data are usable only if the measurements are taken with reasonable care and accuracy. Measurement intervals should be wide enough that expected growth exceeds measurement error (Tanner, 1952; Cole, 1995; Himes, 1999). In some cases, velocity reference data (conditional on age) have been presented in yearly intervals (Tanner et al., 1966a; 1966b; Prader et al., 1989), usually from early childhood to early adulthood. However, such intervals cannot be used to detect nascent growth problems with a view to initiating timely corrective action. Falkner (1958) presented reference data for length, weight and head circumference in intervals ranging from three months in the first year to six months in the second year, and one interval from age 2 to 3 years. Baumgartner et al. (1986) published data for 6-month increments from birth to 18 years. Roche et al. (1989) presented centiles of monthly weight and length increments from the Fels Longitudinal sample (birth to 12 months). Two years later, Guo et al. (1991) published reference values of g/d or mm/d in variable (1- to 3-month) intervals. Following wide consultation with potential users of these standards (e.g. paediatric endocrinologists, neonatologists, lactation counsellors, managers of child health programmes, and researchers), the increments presented in this report are those considered to be the most useful clinically.
The WHO velocity standards for weight are presented in two output types. The main output concerns increments conditional on age, presented as 1-month intervals from birth to 12 months, and in 2- to 6-month intervals from birth to 24 6-months. The second output presents empirical centiles of increments from birth to 60 days in 1-week and 2-week intervals that coincide with the measurement schedule in the MGRS: birth to 7 days, and 7-14, 14-28, 28-42 and 42-60 days. These data are presented both as net increments in grams and as g/day velocities over each index period. It is expected that they will be especially useful for lactation management purposes during this critical period for establishing breastfeeding.
Introduction 3
An important consideration regarding the presentation of standards relates to whether centiles are presented as curves or tabulated values. Curves for attained growth are commonly used to track individual growth patterns, but they cannot serve an equivalent purpose for growth velocity. High levels of intra-individual variation in velocity are normal, and it is not unusual for an infant whose increment at one interval was on the 5th centile to gain at the 75th centile during the next interval. Correlations between subsequent increments are typically low, reflecting a natural pattern of saltatory growth (Lampl et al., 1992) as well as possible catch-up or catch-down growth that contribute to overall narrowly canalized patterns in attained growth trajectories of individual children. For users habituated to attained growth curves, the interpretation of velocity curves presents a counter-intuitive logic: children are not expected to track on a fixed velocity curve (Healy et al., 1988) except perhaps in the median range (Tanner et al., 1966b). For example, a child whose weight velocity tracks on the 3rd centile from 5 to 16 years of age would be lighter at 16 years than a 5 year-old (Baumgartner et al., 1986). On the other hand, a child following the 97th centile from pre-school age would, by maturity, be pathologically enormous (Tanner et al., 1966b).
The lack of correlation between increments makes it difficult to define what constitutes a normal or abnormal sequence of increments, leading to the recommendation that velocity be examined always in conjunction with related measures of attained growth (Tanner, 1952). Different variants of charts combining the concepts of attained size and velocity have been developed and proposed for clinical use, particularly in the United Kingdom (Wright et al., 1994; Cole, 1997; Cole, 1998; Wright et al., 1998). However, those tools do not appear to have gained currency even when incorporated into computerized applications.
- 5 -
2.
METHODOLOGY
2.1
Design of the WHO Multicentre Growth Reference Study
The MGRS (July 1997–December 2003) was a population-based study undertaken in Davis, California, USA; Muscat, Oman; Oslo, Norway; and Pelotas, Brazil; and in selected affluent neighbourhoods of Accra, Ghana and South Delhi, India. The MGRS protocol and its implementation in the six sites are described in detail elsewhere (de Onis et al., 2004a). Briefly, the MGRS combined a longitudinal component from birth to 24 months with a cross-sectional component of children aged 18–71 months. The longitudinal sample with visits planned at target ages allowed for the construction of growth velocity standards, which are the focus of this report. Mothers and newborns were screened and enrolled at birth and visited at home a total of 21 times on weeks 1, 2, 4 and 6; monthly from 2–12 months; and bimonthly in the second year. Data were collected on anthropometry, motor development, feeding practices, child morbidity, perinatal factors, and socioeconomic, demographic and environmental characteristics (de Onis et al., 2004b).
The study populations lived in socioeconomic conditions favourable to growth where mobility was low, ≥20% of mothers followed WHO feeding recommendations and breastfeeding support was available(de Onis et al., 2004b). Individual inclusion criteria were: no known health or environmental constraints to growth; mothers willing to follow MGRS feeding recommendations (i.e. exclusive or predominant breastfeeding for at least 4 months, introduction of complementary foods by the age of 6 months, and continued partial breastfeeding up to at least 12 months); no maternal smoking before and after delivery; single term birth; and absence of significant morbidity (de Onis et al., 2004c).
As part of the site-selection process in Ghana, India and Oman, surveys were conducted to identify socioeconomic characteristics that could be used to select groups whose growth was not environmentally constrained (Owusu et al., 2004; Bhandari et al., 2002; Mohamed et al., 2004). Local criteria for screening newborns, based on parental education and/or income levels, were developed from those surveys. Pre-existing survey data for this purpose were available from Brazil, Norway and the USA. The enrolment and baseline characteristics of the WHO Multicentre Growth Reference Study are described in detail elsewhere (WHO Multicentre Growth Reference Study Group, 2006c).
Term low-birth-weight (<2500 g) infants (2.3%) were not excluded. Since it is likely that in well-off populations such infants represent small but normal children, their exclusion would have artificially distorted the standards’ lower centiles.
2.2
Anthropometry methods
Data collection teams were trained at each site during the study's preparatory phase, at which time measurement techniques were standardized against one of two MGRS anthropometry experts. During the study, bimonthly standardization sessions were conducted at each site. Once a year, the anthropometry expert visited each site to participate in these sessions (de Onis et al., 2004c). Results from the anthropometry standardization sessions have been reported elsewhere (WHO Multicentre Growth Reference Study Group, 2006b). For the longitudinal component of the study, screening teams measured newborns within 24 hours of delivery, and follow-up teams conducted home visits until 24 months of age (de Onis et al., 2004b).
6 Methodology
All study sites used identical measuring equipment. Instruments needed to be highly accurate and precise, yet sturdy and portable to enable them to be carried back and forth on home visits. Length was measured with the portable Harpenden Infantometer (range 30–110 cm, with digit counter readings precise to 1 mm). Portable electronic scales with a taring capability, calibrated to 0.1 kg (i.e. UNICEF Electronic Scale 890 or UNISCALE), were used to measure weight. A self-retracting, 0.7 cm-wide, flat metal tape with a blank lead-in strip (calibrated to 1 mm), was used to measure head circumference. Metal tapes were chosen because they are robust and accurate, and stay in a single plane around the head. They were replaced on a regular basis when the grading marks faded. Length and head circumference were recorded to the last completed unit rather than to the nearest unit. To correct for the systematic negative bias introduced by this practice, 0.05 cm (i.e. half of the smallest measurement unit) was added to each measurement before analysis. This correction did not apply to weight, which was rounded off to the nearest 100 g. Full details of the instruments used and how measurements were taken are provided elsewhere (de Onis et al., 2004c).
2.3
Sample description
A total of 1743 children were enrolled in the longitudinal sample, six of whom were excluded for morbidities affecting growth (4 cases of repeated episodes of diarrhoea, 1 case of repeated episodes of malaria, and 1 case of protein-energy malnutrition) leaving a sample of 1737 children (894 boys and 843 girls). Of these, the mothers of 882 children (428 boys and 454 girls) complied fully with the MGRS infant-feeding and no-smoking criteria and completed the follow-up period of 24 months (96% of compliant children completed the 24-month follow-up) (Table 1).
Table 1 Total sample and number of compliant children in the longitudinal component
Complianta
Compliant with infant-feeding and no-smoking criteria and completed the 24-month follow-up.
Methodology 7
2.4
Data cleaning procedures and correction to target age
2.4.1 Data cleaning
Weight
Distributions of 1- and 2-month weight increments, not surprisingly, included negative increments (about 4.1% for the 1-month and 3.4% for the 2-month increments). In most cases, these were associated with reported morbidity and occurred mainly towards the end of Year 1 and in Year 2. Over 99.5% of negative increments were retained, as they are part and parcel of normal growth. Of the 16 403 weight values available, 57 (0.35%) with reported morbidity that entailed losses greater than 250 g per month were set to missing. Four additional weights (0.02%) without reported morbidity but with losses greater than 350 g per month in Year 1 or 1 kg per month in Year 2 were also set to missing. The threshold was set at approximately 10% of the median birth weight for the first year, and at about 10% of the median weight of a child at 12 months for the second year. In routine paediatric care, large weight losses, even in the absence of reported morbidity, are a sign of underlying problems (sub-clinical illness or psychosocial problems) that normally trigger diagnostic investigations. It is important to note that weights and not increments were excluded, which means that the large negative increments and the usually large positive increments immediately following them were both excluded.
Length and head circumference
In the case of length and head circumference no values were set to missing.
2.4.2 Correction to target age
The actual ages at which the measurements were made were at times delayed (or advanced on a few occasions) compared to the target ages. This resulted in some measurement intervals being either longer or shorter than planned by the MGRS design (e.g. 61 days for a 2-month interval). The data were corrected to target age as shown in Table 2.
Table 2 Maximum tolerable differences in days between planned and actual measurement
ages.
Age range (months)
Maximum tolerable difference
(Diff = Actual measurement age - target agea)
0-6 ± 3 days
6-12 ± 5 days
12-24 ± 7 days
a
Target ages of the MGRS schedule were 0, 28, 61, 91, 122, 152, 183, 213, 244, 274, 304, 335, 365, 426, 487, 548, 609, 670, 731 days
The correction method was applied as follows:
• when the Diff was positive and greater than the tolerable difference indicated in Table 2, the measurement (i.e. weight, length or head circumference) corresponding to the target age was estimated by linear interpolation using measurements at the immediate previous visit and at the actual measurement age corresponding to the interval of interest. For example, if a visit was done at day 100 the weight measurement for the target visit age (91 days) was derived by interpolating between the weights at age 61 days and age 100 days.
8 Methodology
target age was estimated by linear interpolation using measurements at the actual age corresponding to the interval of interest and the immediate subsequent age that corresponded to the next planned visit. For example, for a visit at age 80 days, the estimated weight for age 91 days was based on weights at ages 80 and 122 days.
The correction to target age was applied to less than 10% of all measurements. The final numbers of observed increments used in the construction of the WHO child growth velocity standards are shown in Table 3.
Table 3 Number of increments available for the construction of the WHO child growth velocity standards by sex and anthropometric indicator
Indicator Interval Girls Boys Total
1-month 5242 4869 10 111
Number of available head circumference 2-month increments up to 14 months (see Chapter 5).
The fact that visits in the second year took place at 2-month intervals was a limitation when it came to constructing the 3-month velocity standards. The latest 3-month increment that could be calculated based on observed measurements was from age 11 to 14 months. The approach proposed to construct 3-month velocities for the full age range (birth to 24 months) was to use the parameter curves estimated for the 2-month (birth to 24 months), the 3-month (birth to 14 months) and the 4-month (birth to 24 months) intervals jointly in a cubic spline surface (described in section 2.5). In the case of head circumference, it was not necessary to apply this approach because the 3-month interval centiles were presented only up to age 12 months.
2.5
Statistical methods for constructing the growth velocity standards
The underlying methodology used for constructing the weight, length and head circumference velocity standards was the same used to construct the attained growth standards, i.e. the Box-Cox-power-exponential distribution (BCPE — Rigby and Stasinopoulos, 2004) with a cubic spline smoothing function. The growth curve fitting method and diagnostic tools used to select the best models for each of the indicators are described in detail in the report on the WHO child growth standards (WHO Multicentre Growth Reference Study Group, 2006a; 2007). In sum, the diagnostics included the Q-tests (Royston and Wright, 2000) and worm plots (van Buuren and Fredriks, 2001) for local and global goodness of fit. Patterns of differences between empirical and fitted centiles also were examined.
Methodology 9
(SHASH) distribution (Jones and Pewsey, 2008) and the skew exponential power (SEP) distribution (DiCiccio and Monti, 2004). Both distributions are recent methodologies that have not been extensively applied and tested on empirical data. However, both are available for application with the GAMLSS package (Stasinopoulos et al., 2004).
A few trials with the SHASH distribution were carried out using the 2-month weight increments sample. The modelling proved to be unstable. For example, in using the same approach as applied for the attained growth curves to select the best model, many of the models considered either failed to converge or did so only after 100 or more iterations. For the SEP distribution, also investigated using the 2-month weight increments sample, models would converge only for low degrees of freedom producing over-smoothed curves that fitted the data badly. Moreover, the SEP distribution requires numerical integration for the calculation of z-scores, which cannot be obtained without a computer. This would be a major drawback for the application of the growth velocity standards. Given the operational uncertainties around the application of these distributions and the poor results obtained when they were applied to the MGRS data, the decision was made to revert to the BCPE (which readily simplifies to the LMS method (Cole and Green, 1992) if no adjustment for kurtosis is necessary).
In some cases, there was residual kurtosis after adjusting for the skewness parameter. Conducted comparisons demonstrated that adjusting for kurtosis resulted in very slight shifts in the predicted centiles. In order to avoid having to apply the necessarily complicated resulting z-score calculation formula, the decision was made not to model kurtosis. The velocity data were thus fitted using the LMS method.
Before the BCPE could be applied to these data, it was necessary to add a constant value (termed delta, δ) to all weight increments to shift their distribution above zero. The BCPE was swift in fitting the data to predict centiles, which were then shifted downward by the pre-added delta. A similar procedure was applied in constructing the attained growth standards for length/height-for-age (WHO Multicentre Growth Reference Study Group, 2006a). To calculate z-scores, the delta value needs to be incorporated into the LMS formula. Delta should first be added to the child's increment and then the L, M and S values derived from the model fitted on the shifted observations should be used. When a child's increment is less than (-)delta (i.e. the increment is negative and its absolute value is greater than delta), the correction applied for the skewed attained growth standards beyond -3SD or +3SD applies (such an increment will always lie below -3SD). It was verified that, whereas the modelling process for each of these velocity standards was sensitive to the choice of delta, the final centile curves were practically unaffected and followed the empirical data closely.
For each interval for which the weight increment was modelled, a constant delta value was added at all ages, but it varied by sex for some of the intervals. The delta values were near the absolute value of the minimum observed increment at each interval. In the case of the 1-month interval, delta was 400 g for both sexes; for the 2-month interval, it was 600 g for both sexes; for the 4-month interval, it was 500 g for boys and 800 g for girls; and in the case of the 6-month interval, it was 350 g for boys and 450 g for girls. Exceptionally, three observed losses in the 4-month interval data for girls were between 600 g and 700 g. These were the result of smaller losses accumulated in two consecutive 2-month measurement intervals. Despite their magnitude, these negative increments were not excluded and in each case they were followed by compensatory large increments.
10 Methodology
The following steps were undertaken:
1. For weight, it was necessary to unify the delta across intervals for each sex (650 g for boys and 800 g for girls). The final BCPE model specifications for the 2- and 4-month intervals were re-applied to the data but using the unified delta values. For length, the final BCPE parameter estimates for the 2- and 4-month intervals were used.
2. For both length and weight 3-month intervals, the search for the best BCPE model was carried out using only observed increments (i.e. 1-4mo, 2-5mo,…,11-14mo). To minimize the right edge effect, parameter estimates up to 12 months only were used in the analyses described below.
3. L, M and S parameter estimates obtained in steps 1 and 2 were fed into a cubic spline fitting exercise (a surface fitting of the parameter as a function of age and interval) that was done for each of the parameters separately. The exception was the L values for length, which were estimated as constant values for both boys and girls. In this exercise, the ages corresponding to the intervals were shifted to their mid-point. The three parameters were each fitted on transformed age to the power 0.05 and, in addition, the natural logarithm transformation was applied to the S estimates (similar to GAMLSS modelling).
4. The estimation obtained from the cubic splines for each of the L, M and S parameters allowed the prediction of the 3-month velocity from birth to 24 months.
5. Finally, the predicted L, M and S values were used to construct the centile curves using the usual LMS formulae (including delta in the case of weight).
The Q-test results were interpreted and considered simultaneously with results of worm plots (van Buuren and Fredriks, 2001). On a few occasions, the two diagnostic tools indicated significant residual skewness for the selected models (e.g. girls' 2-month length velocity conditional on age). Worm plots were examined to detect any misfit of the median or the variance, or remaining skewness. Given that adjustment for kurtosis was never considered, there were some cases where the plots remained depicting non-flat worms (as S-shaped worms). It is worth mentioning that in all cases with significant residual skewness, increasing the number of degrees of freedom used to fit the parameter ν did not improve model adequacy. The selection of the model in those cases relied more on the goodness of fit when comparing fitted with predicted 3rd to 97th centiles. In sum, difficulties experienced in finding models of best fit, especially in adjusting for skewness, likely indicate that the smoothing curves cannot fully capture the inherent fluctuations across ages, rather than that the BCPE inadequately fits the increments at each age.
![Table A3.2 Q-test for z-scores from selected model [BCPE(x=age0.05, df(µ)=9, df(σ)=4, df(ν)=1, τ=2)] for 1-month weight velocity for girls](https://thumb-ap.123doks.com/thumbv2/123dok/2290072.1630354/60.595.104.462.167.375/table-scores-selected-model-bcpe-weight-velocity-girls.webp)
![Figure A3.6 Worm plots from selected model [BCPE(x=age0.05, df(µ)=9, df(σ)=4, df(ν)=1, τ=2)] for 1-month weight velocity for girls](https://thumb-ap.123doks.com/thumbv2/123dok/2290072.1630354/61.595.89.536.141.441/figure-worm-plots-selected-model-bcpe-weight-velocity.webp)