SEMINAR NASIONAL
METODE KUANTITATIF
PROSIDING
Seminar Nasional
Metode Kuantitatif 2017
ISBN No. 978-602-98559-3-7
Editor :
Prof. Mustofa Usman, Ph.D
Dra. Wamiliana, M.A., Ph.D.
Layout & Design :
Shela Malinda Tampubolon
Alamat :
Fakultas Matematika dan Ilmu Pengetahuan Alam
Universitas Lampung, Bandar Lampung
Jl. Prof. Dr. Sumantri Brojonegoro No. 1 Bandar Lampung
Telp. 0721-701609/Fax. 0721-702767
KATA SAMBUTAN
KETUA PELAKSANA
SEMINAR NASIONAL METODE KUANTITATIF 2017
Seminar Nasional Metode Kuantitatif 2017 diselenggarakan oleh Jurusan Matematika Fakultas Matematika dan Ilmu Pengetahuan Alam (FMIPA) Universitas Lampung yang dilaksanakan pada tanggal 24 – 25 November 2017. Seminar terselenggara atas kerja sama Jurusan Matematika FMIPA, Lembaga Penelitian dan Pengabdian Masyarakat (LPPM) Unila, dan Badan Pusat Statistik (BPS).
Peserta dari Seminar dihadiri lebih dari 160 peserta dari 11 institusi di Indonesia, diantaranya : Kementrian Pendidikan dan Kebudayaan, Badan Pusat Statistik, Universitas Indonesia, Institut Teknologi Bandung, Universitas Sriwijaya, Universitas Jember, Universitas Islam Negeri Sunan Gunung Djati, Universitas Cendrawasih, Universitas Teknokrat Indonesia, Universitas Malahayati, dan Universitas Lampung. Dengan jumlah artikel yang disajikan ada sebanyak 48 artikel hal ini merefleksikan pentingnya seminar nasional metode kuantitatif dengan tema “pengunaan matematika, statistika dan computer dalam berbagai disiplin
ilmu untuk mewujudkan kemakmuran bangsa”.
Kami berharap seminar ini menjadi tempat untuk para dosen dan mahasiswa untuk berbagi pengalaman dan membangun kerjasama antar ilmuan. Seminar semacam ini tentu mempunyai pengaruh yang positif pada iklim akademik khususnya di Unila.
Atas nama panitia, kami mengucapkan banyak terima kasih kepada Rektor, ketua LPPM Unila, dan Dekan FMIPA Unila serta ketua jurusan matematika FMIPA Unila dan semua panitia yang telah bekerja keras untuk suksesnya penyelenggaraan seminar ini.
Dan semoga seminar ini dapat menjadi agenda tahunan bagi jurusan matematika FMIPA Unila`
Bandar Lampung, Desember 2017
Prof. Mustofa Usman,Ph.D
DAFTAR ISI
KATA SAMBUTAN .
...
iii
KEPANITIAAN .
...
iv
DAFTAR ISI .
...
vi
Aplikasi Metode Analisis Homotopi (HAM) pada Sistem Persamaan Diferensial Parsial
Homogen (Fauzia Anisatul
F, Suharsono S, dan Dorrah Aziz
) .
...
1
Simulasi
Interaksi
Angin
Laut
dan
Bukit
Barisan
dalam
Pembentukan
Pola
Cuaca
di
Wilayah
Sumatera
Barat
Menggunakan
Model
Wrf-Arw
(Achmad Raflie Pahlevi) .
...
7
Penerapan Mekanisme Pertahanan Diri (Self-Defense) sebagai Upaya Strategi Pengurangan
Rasa Takut Terhadap Kejahatan (Studi Pada Kabupaten/Kota di Provinsi Lampung yang
Menduduki Peringkat Crime Rate Tertinggi) (Teuku Fahmi) .
...
18
Tingkat Ketahanan Individu Mahasiswa Unila pada Aspek Soft Skill
(Pitojo Budiono
, Feni Rosalia, dan Lilih Muflihah
) .
...
33
Metode Analisis Homotopi pada Sistem Persamaan Diferensial Parsial Linear Non Homogen
Orde Satu (Atika Faradilla
dan Suharsono S
) .
...
44
Penerapan Neural Machine Translation Untuk Eksperimen Penerjemahan Secara Otomatis
pada Bahasa Lampung
–
Indonesia (Zaenal Abidin) .
...
53
Ukuran Risiko Cre-Var (Insani Putri
dan Khreshna I.A.Syuhada
) .
...
69
Penentuan Risiko Investasi dengan Momen Orde Tinggi V@R-Cv@R
(Marianik
dan Khreshna I.A.Syuhada
) .
...
77
Simulasi Komputasi Aliran Panas pada Model Pengering Kabinet dengan Metode Beda
Hingga (Vivi Nur Utami
, Tiryono Ruby, Subian Saidi, dan Amanto
) .
...
83
Segmentasi Wilayah Berdasarkan Derajat Kesehatan dengan Menggunakan
Finite Mixture
Partial Least Square (Fimix-Pls) (Agustina Riyanti) .
...
90
Representasi Operator Linier Dari Ruang Barisan Ke Ruang Barisan L 3/2
(Risky Aulia Ulfa
, Muslim Ansori, Suharsono S, dan Agus Sutrisno
) .
...
99
Analisis Rangkaian Resistor, Induktor dan Kapasitor (RLC) dengan Metode Runge-Kutta Dan
Adams Bashforth Moulton (Yudandi K
.A., Agus Sutrisno, Amanto, dan Dorrah Aziz
) .
...
110
Edited with the trial version of Foxit Advanced PDF Editor To remove this notice, visit:
Representasi Operator Linier dari Ruang Barisan Ke Ruang Barisan L 13/12
(Amanda Yona Ningtyas
, Muslim Ansori, Subian Saidi, dan Amanto
) .
...
116
Desain Kontrol Model Suhu Ruangan (Zulfikar Fakhri Bismar
dan Aang Nuryaman
) .
...
126
Penerapan Logika Fuzzy pada Suara Tv Sebagai Alternative Menghemat Daya Listrik
(Agus Wantoro) .
...
135
Clustering Wilayah Lampung Berdasarkan Tingkat Kesejahteraan (Henida Widyatama) .
...
149
Pemanfaatan Sistem Informasi Geografis Untuk Valuasi Jasa Lingkungan Mangrove dalam
Penyakit Malaria di Provinsi Lampung (Imawan A
.Q., Samsul Bakri, dan Dyah W.S.R.W.
) .
....
156
Analisis Pengendalian Persediaan Dalam Mencapai Tingkat Produksi
Crude Palm Oil (CPO)
yang
Optimal
di
PT.
Kresna
Duta
Agroindo
Langling
Merangin-Jambi
(Marcelly Widya W.
, Hery Wibowo, dan Estika Devi Erinda
) .
...
171
Analisis Cluster Data Longitudinal pada Pengelompokan Daerah Berdasarkan Indikator IPM
di Jawa Barat (A.S Awalluddin
dan I. Taufik
) .
...
187
Indek Pembangunan Manusia dan Faktor Yang Mempengaruhinya di Daerah Perkotaan
Provinsi Lampung (Ahmad Rifa'i
dan Hartono
) .
...
195
Parameter Estimation Of Bernoulli Distribution Using Maximum Likelihood and Bayesian
Methods (Nurmaita Hamsyiah
, Khoirin Nisa, dan Warsono
) .
...
214
Proses Pengamanan Data Menggunakan Kombinasi Metode Kriptografi
Data Encryption
Standard dan Steganografi End Of File(Dedi Darwis
, Wamiliana, dan Akmal Junaidi
) .
...
228
Bayesian
Inference
of
Poisson
Distribution
Using
Conjugate
A
and Non-Informative Prior (Misgiyati
, Khoirin Nisa, dan Warsono
) .
...
241
Analisis Klasifikasi Menggunakan Metode Regresi Logistik Or
dinal dan Klasifikasi Naϊve
Bayes pada Data Alumni Unila Tahun 2016 (Shintia F
., Rudi Ruswandi, dan Subian Saidi
) .
...
251
Analisis Model
Markov Switching Autoregressive (MSAR) pada Data
Time Series
(Aulianda Prasyanti
, Mustofa Usman, dan Dorrah Aziz
) .
...
263
Perbandingan Metode Adams Bashforth-Moulton dan Metode Milne-Simpson dalam
Penyelesaian Persamaan Diferensial Euler Orde-8
(Faranika L
atip., Dorrah Aziz, dan Suharsono S
) .
...
278
Pengembangan Ekowisata dengan Memanfaatkan Media Sosial untuk Mengukur Selera Calon
Konsumen (Gustafika Maulana
, Gunardi Djoko Winarso, dan Samsul Bakri
) .
...
293
Diagonalisasi Secara Uniter Matriks Hermite dan Aplikasinya pada Pengamanan Pesan
Rahasia (Abdurrois
, Dorrah Aziz, dan Aang Nuryaman
) .
...
308
Edited with the trial version of Foxit Advanced PDF Editor To remove this notice, visit:
Pembandingan Metode Runge-Kutta Orde 4 dan Metode Adam-Bashfort Moulton dalam
Penyelesaian Model Pertumbuhan Uang yang Diinvestasikan
(Intan Puspitasari
, Agus Sutrisno, Tiryono Ruby, dan Muslim Ansori
) .
...
328
Menyelesaikan
Persamaan
Diferensial
Linear
Orde-N
Non
Homogen dengan Fungsi Green
(Fathurrohman Al Ayubi
, Dorrah Aziz, dan Muslim Ansori
) .
...
341
Penyelesaian Kata Ambigu pada Proses Pos Tagging Menggunakan Algoritma
Hidden
Markov Model ( HMM ) (Agus Mulyanto
, Yeni Agus Nurhuda, dan Nova Wiyanto
) .
...
347
Sistem Temu Kembali Citra Daun Tumbuhan Menggunakan Metode Eigenface
(Supiyanto
dan Samuel A. Mandowen
) .
...
359
Efektivitas Model
Problem Solving dalam Meningkatkan Kemampuan Berfikir Lancar
Mahasiswa pada Materi Ph Larutan (Ratu Betta Rudibyani) .
...
368
The Optim
al
Bandwidth for Kernel Density Estimation of Skewed Distribution: A Case Study
on Survival Data of Cancer Patients
(Netti Herawati
, Khoirin Nisa, dan Eri Setiawan
) .
...
380
Karakteristik
Larutan
Kimia
Di
Dalam
Air
Dengan
Menggunakan
Sistem Persamaan Linear (Titik Suparwati) .
...
389
Bentuk Solusi Gelombang Berjalan Persamaan
mKdV Yang Diperumum
(Notiragayu
, Rudi Ruswandi, dan La Zakaria
) .
...
398
Pendugaan Blup Dan Eblup(Suatu Pendekatan Simulasi) (Nusyirwan) .
...
403
Edited with the trial version of Foxit Advanced PDF Editor To remove this notice, visit:
Prosiding Seminar Nasional Metode Kuantitatif 2017 ISBN No. 978-602-98559-3-7
380
THE OPTIMAL BANDWIDTH FOR KERNEL DENSITY ESTIMATION OF
SKEWED
DISTRIBUTION: A CASE STUDY ON SURVIVAL TIME DATA OF CANCER
PATIENTS
Netti Herawati, Khoirin Nisa, Eri Setiawan Department of Mathematics University of Lampung
Jl. Prof. Dr. Soemantri Brodjonegoro No. 1 Gedung Meneng Bandar Lampung
e-mail: [email protected], [email protected], [email protected] .
ABSTRACT
In this paper, optimal bandwidth selection for skewed distribution is studied through data simulation. The data are generated from Exponential (1), Exponential (5), Gamma (1,6), Gamma (1,9), Weibull (1,5), and Weibull (1,10) distributions having parameter(s) that produces a skewed density function with n = 100. The Gaussian kernel density functions of the generated distributions are estimated using Scott (Nrd), Silverman’s rule of thumb (Nrd0), Silverman’s Long-Tailed distribution (Silverman-LT), Biased Cross validation (BCV) and Sheater-Jones (SJ) bandwidth methods. The kernel density estimates are compared to the corresponding probability density functions. The selected optimal bandwidth then is applied to kernel density estimation of survival time data of cancer patients. Result indicates that, overall, Silverman’s Rule of Thumb (Nrd0) method outperformed the other methods.
Keywords:kernel density estimation,optimal bandwidth, survival timedata
1. INTRODUCTION
Information about data distribution and its probability density function (PDF) is important in various statistical
analysis. However, in some cases the information about the probability density function is unknown. One
approach to density estimation is parametric. Another approach is non parametricinthat less rigid assumptions
will be made about the distribution of the observed data. The objective of density estimation in nonparametric
approach is to obtain the density function curve which is a smooth curve with minimum sampling variance and
has importantinformation of the data. The simplest way to estimate the density estimationis using histogram. But
it has a weakness in its shape which is influenced by the selection of the starting point and the width of the class
interval. Different starting points will produce different histograms, as well as different interval classes will
result in different histogram shapes.
In this study, we use nonparametric kernel density estimation to estimate the probability density function of
skewed distributions. The most important part of kernel density estimation is the selection of kernel functions
and the selection of bandwidth [1,3]. Bandwidth is a scale factor that controls how large the probability of
spreading point on the curve. Selection of bandwidth will determine whether the obtained density function curve
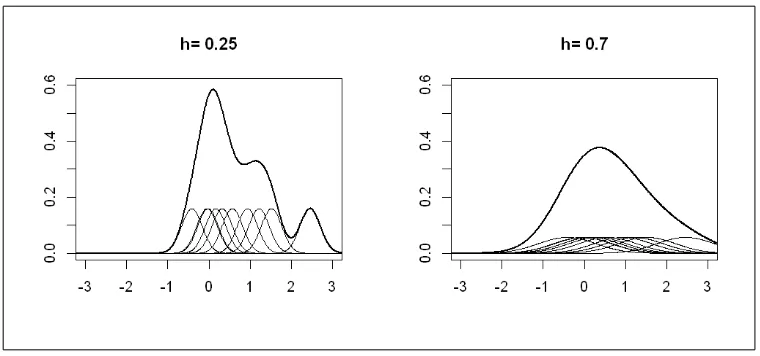
will be undersmoothing or oversmoothing. The value of the bandwidth that is too small will produce an
undersmoothing density function curve, and vice versa, the value of the bandwidth that is too large will produce
an oversmoothing density function curve. Therefore an optimal bandwidth is required to obtain a density
function curve corresponding to the actual data distribution. To illustrate this issue, we provide an example of
Prosiding Seminar Nasional Metode Kuantitatif 2017 ISBN No. 978-602-98559-3-7
381
Figure 1.Undersmoothing (left) and Oversmoothing (right).
There are various well known methods available for obtaining optimal bandwidth, for example the Asymptotically first-order optimal (AFO) bandwidths[5], Unbiased Cross Validation (UCV) method, the Biased Cross Validation (BCV) method, Silverman’s rule of thumb (Nrd0) method, Silverman’s Long-Tailed distribution (Silverman-LT), Scott (Nrd) method, and Sheater-Jones (SJ) method. Each of these methods is
known as the optimal bandwidth but produces different bandwidth values. The bandwidth selection in kernel
density estimation becomes an interesting topic to study and has been investigated by many authors.
Studies on the optimal bandwidth selection have been done by many authors, one can see e.g. [2]-[6] for various
techniques and issues related to bandwidth selections. In this paper we empirically study the optimal bandwidth
estimations for skewed distribution by data simulation. We consider several optimal bandwidths mentioned
above. The selected one then is applied to real data on survival time of lung cancer patients. The rest of the paper
is organized as follow, in Section 2 we review the kernel method for density estimation and present the available
optimal bandwidths. In Section 3 we describe our research methodology. The simulation results are presented in
Section 4 and the application on survival data is given in Section 5.
2. KERNEL DENSITY ESTIMATION
Kernel Density Estimation is a method to estimate the frequency or probability function of a given value given a
random sample. Given a set of observations (xi) with 1 ≤ i ≤ n, it isassumed that the observations are a random sampling of a probability distribution f. The kernel estimator of f is given as follow:
-
X
iis an identical independently distributed random variableProsiding Seminar Nasional Metode Kuantitatif 2017 ISBN No. 978-602-98559-3-7
382
- n is the number of observations
- h is the bandwidth, a positive valued smoothing parameter that would typically tend to 0 when the number of samples tend to ∞
The kernel estimator depends on two parameters, i.e. the kernel function K and the bandwidth h. There are several kernel functions K(.) which can be used for density estimation, some of the most used kernel functions are Epanechikov, biweight, triangular, Gaussian and rectangular kernels. For more details on the kernel function
one can see e.g. [1] and [9]. However, the selection of kernel function K(.) used for the estimation does not really effect the accuracy of the estimation, furthermore the bias of density estimation using kernel estimator does not
rely on the sample size but it depends only on the bandwidth h choice. [1]
Selecting an appropriate bandwidth for a kernel density estimator is of crucial importance, and the purpose of the
estimation may be an influential factor in the selection method. In many situations, it is sufficient to subjectively
choose the smoothing parameter by looking at the density estimates produced by a range of bandwidths. One can
start with a large bandwidth, and decrease the amount of smoothing until reaching a ”reasonable” density
estimate. However, there are situations where several estimations are needed, and such an approach is
impractical. An automatic procedure is essential when a large number of estimations are required as part of a
more global analysis.
The problem with using the optimal bandwidth is that it depends on the unknown quantity f′′ which measures the
speed of fluctuations in the density f, i.e., the roughness of f. Many methods have been proposed to select a bandwidth that leads to good performance in the estimation. The followings methods are some optimal
bandwidths selection methods available in R software for kernel density estimation:
A. Scott (Nrd) bandwith method
Where is population standard deviation (estimated by the sample standard deviation) and nis thesample size. The Scott bandwidth isusually used for normal symmetric and unimodal data [7].
B. Silverman’s rule of thumb (Nrd0) bandwith method
If the data is unimodal but not symmetric, then the following Silverman’s rule of thumb bandwidth will
Prosiding Seminar Nasional Metode Kuantitatif 2017 ISBN No. 978-602-98559-3-7
383 C. Silverman’s Long-Tailed distribution (Silverman-LT)
Silverman [1] introduced a bandwidth estimator for skewed and long-tailed distribution given in the following
formula:
5 / 1
(IQR)
79
.
0
n
h
.
D. Unbiased Cross Validation(UCV)bandwith method
The UCV bandwidth (hUCV) is the bandwidth h that minimize the following function
The hUCV valueis obtained iteratively [8].
E. Biased Cross validation (BCV )bandwith method
The BCV bandwidth (hBCV) is the bandwidth h that minimize the following function
The hBCVvalue is also obtained iteratively [8].
F. Sheater-Jones(SJ)bandwith method
Sheater-Jones bandwidth methodis given as follow
where
a
2
c
ˆ
1h
5/7 with cis an appropriate constant [4].3. RESEARCH METHOD
A simulation study using R program was conducted to compare the several optimal bandwith selection methods: Scott (Nrd), Silverman’s rule of thumb (Nrd0), Silverman’s Long-Tailed distribution (Silverman-LT), Unbiased Cross Validation(UCV), Biased Cross validation (BCV) and Sheater-Jones (SJ) of n= 100 which were artificially
repeated from skewed distributions: Exponential (1), Exponential (5), Gamma (1,6), Gamma (1,9), Weibull
(1,5), and Weibull (1,10). Gaussian kernel with selected optimal bandwidth selection method is applied to
Prosiding Seminar Nasional Metode Kuantitatif 2017 ISBN No. 978-602-98559-3-7
384
days, ie patient duration ranging from 100 days before treatment until the patient died. This data is part of the
research data of Veteran Administration USA [10].
4. RESULTS AND DISCUSSION
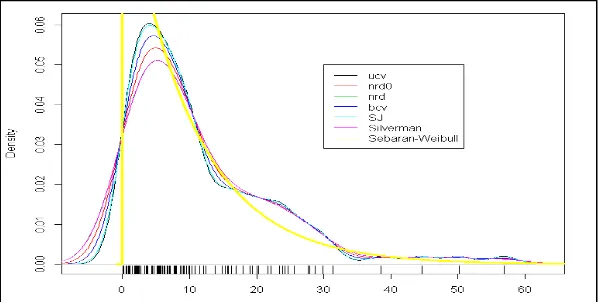
In this section we present and discuss the result from our data simulation. The simulation results of the generated
skewed distributions (Exponential (1), Exponential (5), Gamma (1,6), Gamma (1,9), Weibull (1,5), and Weibull
(1,10)) using Nrd0, Nrd, UCV, BCV, SJ, and Silverman-LT bandwidth method scan been seen clearly in Figure
2-7.
Figure 2. Density estimation curves of Exponential(1) distribution with different bandwidth methods
Figure 3. Density estimationcurve of Exponential(5) distribution with different bandwidth methods
.
Prosiding Seminar Nasional Metode Kuantitatif 2017 ISBN No. 978-602-98559-3-7
385
Figure 5. Density estimationcurve of Gamma(1,9) distribution with different bandwidth methods.
Figure 6. Density estimationcurve of Weibull (1,5) distribution with different bandwidth selection methods.
Figure 7. Density estimation curve of Weibull (1,10) distribution with different bandwidth selection methods.
It is apparent from Figure 2-7 that UCV and SJ bandwidths provide unfavorable results for estimating the
density curve of the data since the curves are significantly distorted from the real distribution (PDF) curve (ie,
yellow curves), particularly in Fig. 3, Fig. 5 and Fig. 6. The kernel estimation using UCV bandwidth is the worst
Prosiding Seminar Nasional Metode Kuantitatif 2017 ISBN No. 978-602-98559-3-7
386
seen to meet the real PDF curve. The curve of Nrd0 method has a shape similar to the curve of Silverman-LT,
while the curve of the Nrd method has a shape similar to the BCV curve. From these two groups, it is obvious
that the Nrd0 andSilverman-LT curves approximate the actual data curve better than the Nrd and BCV curves.In
order to ensure the best bandwidth estimation methods, specifically we provide the curve of the density of the
two bandwidth selection methods (Nrd0 and Silverman-LT) for Exponential (1), Exponential (5), Gamma (1,6),
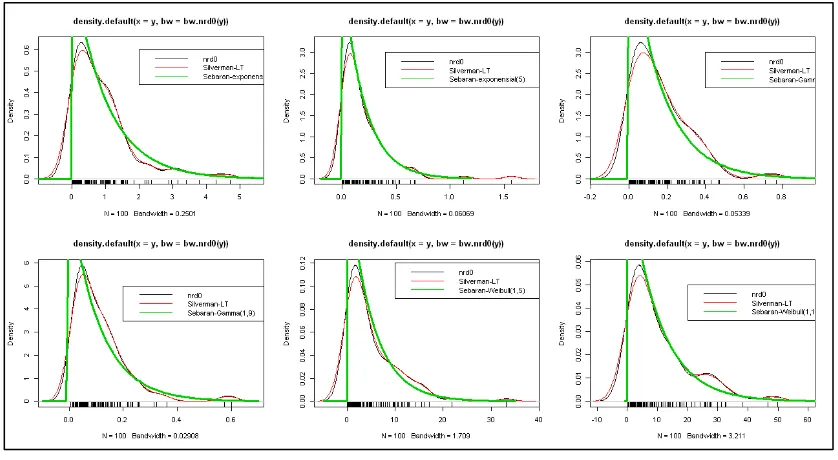
Gamma (1,9), Weibull (1,5), and Weibull (1,10) distributions as shown Fig. 8.
Figure 8. Comparison of Nrd0 and Silverman-LT bandwidth selection methods for Exponential (1), Exponential
(5), Gamma (1,6), Gamma (1,9), Weibull (1,5), and Weibull (1,10) distributions.
Figure 8 shows that the density curves of the Nrd0 and Silverman-LT methods are similar. However, at its peak,
the density curve of the Nrd0 bandwidth method approximates to the real data distribution (PDF) curve better
than the density curve of the Silverman-LT method. Based on the above description, it can be concluded that the
Nrd0 bandwidth estimation method gives the best density curve estimation among other methods.
5. APPLICATION ON SURVIVAL DATA OF CANCER PATIENTS
To see the performance of the selected bandwidth method resulting from the simulation study above, we apply it
to the survival time data of cancer patients. First, we predict the data distribution using histogram and polygon
Prosiding Seminar Nasional Metode Kuantitatif 2017 ISBN No. 978-602-98559-3-7
387
Figure 9. Histogram of survival time data of cancer patients
The histogram above shows that the data is skewed to the right. The values of all optimal bandwidths discussed
in previous section are presented in Table 1.
Table 1. Optimal bandwith values of all bandwith selection methods
Methods Bandwidth
Silverman's Rule of Thumb (Nrd0) 34.35
Scott (Nrd) 40.46
Unbiased Cross Validation (UCV ) 14.37
Biased Cross Validation (BCV) 44.85
Sheater – Jones (SJ) 20.39
Silverman Long-Tailed distributions (Silverman-LT) 36.72
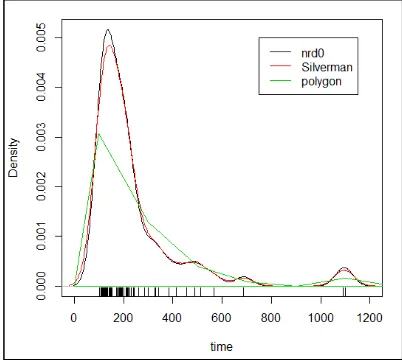
We obtained the bandwidth values of the two best methods (Nrd0 and Silverman-LT) are 34.35 and 36.72
respectively. We present the plot of the polygon curve and kernel density estimates using Nrd0 and Silverman-LT
bandwidths in Figure 10.
Figure 10. Comparison kernel density estimates using Nrd0 and Silverman-LT bandwidths and polygon of survival
Prosiding Seminar Nasional Metode Kuantitatif 2017 ISBN No. 978-602-98559-3-7
388
From Figure 10, it can be seen that Nrd0 and Silverman-LT bandwidth methods yields the density curves that
best suits the distribution of survival time data of cancer patients. The Nrd0 and Silverman-LT density curves
look similar. However, at the peak and tail of the densities are quite different. For final decision, we choose the
best bandwidth to fit the data in accordance to the result of data simulation, i.e. the Nrd0 bandwidth. This results
is similar to the skewed distributions simulation result as shown in Figure 8.
6. CONCLUSION
In this paper, we have shown that one can estimate the density curve using kernel density estimation method
using various bandwith selection methods. For skewed distribution considered in this paper, overall, Silverman’s Rule of Thumb (Nrd0) bandwith outperformed all other methods. It provides the best density estimates curvefor both skewed distribution and survival time data of cancer patients compared to others.
.
REFERENCES
[1] Silverman, B.W. 1986. Density Estimation for Statistics and Data Analysis. Chapman and Hall, London. [2] Samworth, R.J. & Wand M.P. 2010. Asymptotics and Optimal Bandwidth Selection for Highest Density
Region Estimation. The Annals of Statistics, 38(3), 1767–1792.
[3] Chen., S. 2015. Optimal Bandwidth Selection for Kernel Density Functional Estimation. Journal of Probability and Statistics, 2015:1-21.
[4] Sheather, S.J. &Jones,M.C. 1991. A Reliable Data-Based Bandwith Selection Method for Kernel Density
Estimation. Journal of the Royal Statistical Society, 53 (3), 683-690.
[5] Arai, Y. & Ichimura, H. 2013. Optimal Bandwidth Selection for Differences of Nonparametric Estimators
with an Application to Sharp Regression Discontinuity Design. GRIPS discussion paper. National
Graduate Institute for Policy Studies, Tokyo Japan.
[6] Hansen, B.E. 2004. Bandwidth Selection for Nonparametric Distribution Estimation. Research supported by the National Science Foundation. Department of Economics University of Wisconsin, Madison. [7] Rizzo, M.L. 2008. Statistical Computing with R. Chapman & Hall/CRC. Boca Raton.
[8] Vrahimis, A. 2010. Smoothing Methodology With Applications To Nonparametric Statistics. thesis
submitted to the University of Manchester, School of Mathematics.
[9] Sheather, S.J. 2004. Density Estimation. Statistical Science, 19(4), 588-597.