INTRODUCING ”HEALTH” PERSPECTIVE IN
OPEN SOURCE WEB-ENGINEERING SOFTWARE
PROJECTS, BASED ON PROJECT DATA
ANALYSIS
1)Dindin Wahyudin, Alexander Schatten, Khabib Mustofa,
Stefan Biffl, A Min Tjoa
Institute for Software Technology and Interactive Systems
Vienna University of Technology, Austria
{dindin, schatten, khabib, biffl, tjoa}@ifs.tuwien.ac.at
Abstract:
There are many initiatives of open-source software which have success stories for web engi-neering such as Apache Tomcat, Apache HTTP Server and Python. Many of these projects have enjoyed wide industry adoption for web-based applications. For the Open Source Soft-ware (OSS) community and observer, it is important to determine whether a (new) project initiative is worthwhile, i.e., warrants a closer look and/or sustained support.
This paper proposes an evaluation process and concept for ”health” indicators that can help getting an overview on a large number of OSS projects. For initial empirical evaluation of the concept, we apply the indicators to well-known OSS projects and discuss the results with OSS experts to investigate the external validity of the indicators.
Keywords: Open Source Project Health, Open Source Project Management, Web Engineering, Data Mining.
1
Introduction
Open Source Software (OSS) has caught our attention due to the success and quality of its projects on the market, despite the fact, that development does not necessarily follow by tra-ditional, ”proven” software development principles. Many OSS projects provide comparable, if not more affluent, results compare to closed source and commercial software. This makes
OSS a tremendous alternative in many software engineering domains, reaching from operating systems to web frameworks and from databases to office applications. However, many of these projects are still in initial phases, in immature states [6], or have reached the end of their life cycles, which means their survival is heavily uncertain.
Our study begins with the question how to improve the chances, that an OSS project can reach success and stay ”healthy”. A great number of OSS projects exists but it is hard to quickly judge for the individual, whether it is worthwhile to take the effort of a closer look as a process. This is particularly problematic for prospective customers, the hosting project (e.g. Apache, Eclipse) as well as the project steering board. For this reason, Apache Software Foundation (ASF) has to decide whether or not to accept a new project and set up the ”Apache Incubator”.
OSS project’s survival is a result of many underlying (connected) processes and cannot be easily determined. Just to give an example: developers are typically not paid but contribute voluntarily. Hence, the dynamic of the development process is much more difficult to under-stand compared to a typical industrial project. Thus, developers in the open source commu-nity, in particular project leading teams and release managers, need pertinent data from the dynamics of open source project consecutively to know the ”health” status of the work.
We address this need by proposing a concept and evaluation of ”health indicators” in open source projects. Basic argument for the strategy of our approach is derived from the analysis of literatures and published studies. For initial empirical evaluation of the concept we apply the indicators to well-known OSS web-engineering projects. We perform project data analysis using certain data retrieved from several successful OSS projects and the challenged ones. We discuss the results with OSS experts to investigate the external validity of the indicators.
2
Related Work on Health Concepts in Web Engineering Based on
Data Mining
This section briefly introduces recent practices and related works that support the implemen-tation of health monitoring in OSS web-engineering projects.
2.1 System Health Monitoring
2.2 Open Source Software Project as a Form of Web Engineering
Web engineering is recent discipline in software development with major growth rate to the business opportunities coming from harnessing. Murugesan et. al.,[9] and Ginige et.al., [4] observe ”web-based systems development is not a one-time event, as practiced by many; its a process with a long life cycle”. However, web-development brings several issues which are inherited by OSS web-engineering project such as less formal design, semi-formal distributed development, heavily relying on knowledge and contribution of the developers[2]. This makes project monitoring even more difficult. Schatten et.al [11] suggest a web-based OSS tools for project monitoring particularly for dislocated / distributed development such as OSS projects.
2.3 Open Source Software Data Analysis
Several prominent studies observed the OSS projects by mining repositories such as mailing lists, SVN/CVS and bug databases. Mockus et.al. [7, 8] provided extensive case studies on Apache Server and Mozilla. The study clearly portrayed the development process and community in OSS projects. However, the study does not provide comparison with challenged projects to distinguish good and bad practices in OSS projects.
2.4 The Need and Precondition of Data Mining
Open source software projects, consists of large sets of data residing in some project’s repos-itories. To extract useful information from such data repositories we need data mining as suggested by Hard et.al.,[5]. As the precondition, data mining usually starts with data prepa-ration which may involve data cleaning, data transformations, selecting subsets of records and - in case of data sets with large numbers of variables - performing some preliminary feature selection operations to bring the number of variables to a manageable range.
3
The ”Health” Concept and Indicators As Part of An Evaluation
Process
3.1 Open Source Community Health
Current practises in OSS show that a prominent success factor in OSS project is the partic-ipants’ motivation as reported by Boston Consulting Group 1). The project evolves, so does the motivation. Expert from Apache suggests that only a healthy community can produce good quality software.
ASF defined that a healthy community2) is indicated by an active collaborative works and
consists of diverse core developers. To measure the developers’ participation, we can observe data from developers’ mailing list archives. We propose the hypothesis that a good project should reveal active developers’ participation. For the second health indicator, diversity of core developers, we can observe by quantifying the number of independent core developers (working in different field). The diversity is important because: (a) it guarantees a sustainable development, as the project will be less dependent on a single developer, (b) it brings variety of competencies to enrich the quality.
3.2 Software Quality
Most of successful OSS projects were developed using bazaar style development [10], in which the code is developed over the Internet in view of the public. As a consequence, the main issues are maintenance of the configuration management and the code-versioning system. Hence a project leader needs information of common notable quality practises in OSS that reflect software healthiness. For assuring the quality of code, a potential method that can be adopted is bad smells detection from Agile Software Development [3]. By detecting bad smells developers can recognize a flaw in code design, and its severity. Yet we consider code maintainability as another health indicator in further work. We assumed though (from observation of many projects) that OSS project with healthy community typically produce high-quality software.
Additionaly a healthy project should employ proven bug management practices, and offer fast bug response. In traditional project, bug tracking is similar to inspection which is effective but also expensive quality assurance [1]. However in OSS project, the community voluntarily plays significant role in bug tracking, and resolve the financial barrier as in traditional project.
Thus we address 3 questions for assessing bug management in a project: 1. Is there any appropriate bug reporting and monitoring in place? 2. Is there any appropriate rating of bugs (severity)? and 3. What is the average response time and closure of bug reports?.
1)http://www.osdl.com/bcg/
4
Evaluation process
We apply the proposed health indicators to four cases of Apache projects. The set consists of two well-known Apache projects (Tomcat and HTTP Server/ HTTPD), and two challenged projects (Xindice and Slide).
We focused our evaluation process on two health indicators: the dynamics of developers’ participation and the performance of bug tracking. These indicators are very while noting by a project leader: (a) the indicators to assure that a project is still actively running and (b) both indicators are simple to be evaluated. In evaluating the activeness of developers’ participation, we retrieve data from developer mailing list repositories. The data period extends through project life time and grouped into monthly archives. To have an outlook of developer activity, we quantify the emails in each archive and depict the fluctuation of emails conversation. We employ polynomial regression because we need to analyze gains and losses over retrieved data set in order to better illustrate the trend of developer email conversations over the whole project life cycle.
Apache Project has centralized it bugs tracking within repositories managed by GNATS and later moved to Bugzilla. Bugzilla offers more features like transaction logs (history) and search facility either simple or advanced search on descriptive information of bugs. This makes the dynamics of bugs are relatively easy to trace. It is not surprising that Bugzilla became very popular and widely used by 550 projects or companies3). This indicates that each Apache
Project being evaluated implement appropriate bug tracking tools. In order to evaluate the performance of projects based on bug’s statistics, we retrieve each projects’ bug reports and measure quantitative data items4). Unfortunately, some data needs pre-processing due to
inappropriate or illegal values. The pre-processing steps involve: removing records indicated as ”duplicated” in resolution field and excluding records containing invalid date (either for
opendate orchangedate).
Furthermore, in measuring the averageresponse time andclosure time of bug reports, we for-mulate the calculation using the criteria: response time is the length of time interval between open date and last change date for the bugs having status field set to ”assigned” or ”new”, and closure time is length of time interval between open date and last change for bugs having status ”resolved”, ”closed” or ”verified” and with resolution status ”fixed”. While, to see the severity rating of the projects under investigation, we do a percentage comparison of each severity level for all projects.
5
Initial Empirical Data Collection and Analysis
In this section, we describe empirical data collection and analysis of health indicators proposed in section 3.
5.1 Measuring Developers’ Activity
In OSS projects, the developer mailing list is the main collaborative communication tool, where everyone who wants to participate in project development can observe or join in. The number of emails submitted over time can be considered as representation of a direct measure of developers’ participation.
The mailing list is archived, and most of the contents are development-related short messages i.e. technical discussions, problem reports, automatic notifications etc.
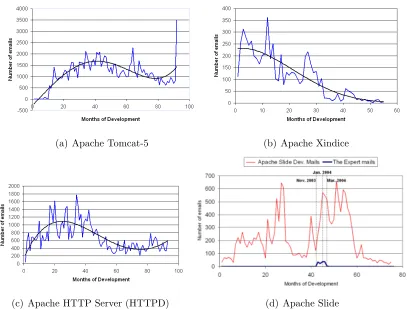
To have an outlook of the dynamics in developer mailing list, we draw polynomial trend-line for each projects’ life cycles as shown in Figure 1 (1(a) - 1(d)). From the data5), Tomcat
has an average of 1131.27 emails/month, HTTPD of 686.73 emails/month, Xindice of 108.44 emails/month and Slide of 224.9 emails/month.The pattern shows that Tomcat and HTTPD have more lively developers’ communities. Although both projects had exhibited negative slope after the first half life time, the latest status shows a positive trend in both projects.
On the contrary are the trend-lines of the ”challenged” OSS projects. Xindice, which seem promising in the beginning life time, undergoes a slow dying for the last 43 months, while Slide’s shows ”V-shaped” fluctuation, thus a polynomial regression will be misleading. How-ever we can observe that Slide is suddenly collapsed from the highest peak (658 mails/month, in the 53rd month) to a very sharp valley6).
Derived from mails fluctuation in evaluated projects, certainly there is a lower limit for mail activity. We argue that if the volume of developer mails goes under 70 messages per month, the project has gone belly up.
5.2 Performance of Bug Tracking and Management
Based on the measurement scheme on bugs mentioned in section 4, we present the quantitative result.
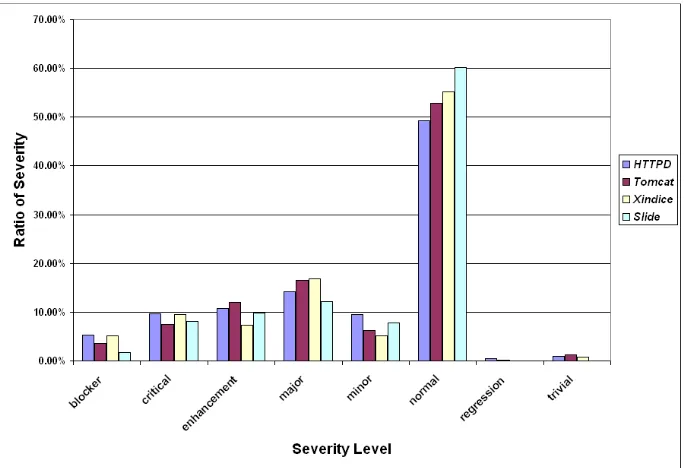
The first measurement is on the bugs’ severity on each projects. The severity measurement is
5)last retrieval is 05-08-2006
6)The analysis is based on the Developers’ mailing list until August 2006. This result depends tightly on
(a) Apache Tomcat-5 (b) Apache Xindice
(c) Apache HTTP Server (HTTPD) (d) Apache Slide
Figure 1: Developers’ Mailinglist of some Apache projects
expressed as percentage, portrayed as a diagram shown in Fig 2. If we grouped the severity levels into three categories: severities related to security (critical) and fault (blocker), those related to feature (major, minor, enhancement, normal) and those cosmetics work (regression and trivial), we can see that for each project exists similar patterns of bugs severity distrib-ution, i.e. : number of severity of third category is the smallest, followed by first and then second categories. When we combine all bugs of the four projects and do the above catego-rization, the patterns still holds and we get 13.02% for first , 85.74% for the second and 1.24% for the third categories.
Table 1 shows the response time and closure time for four Apache Projects. From the table, it can be argued that the more severe bug does not always mean to have shorter response times. It is likely that response time is affected also by priority set by developer due to some consideration, for example, a blocker might be given lower priority when it occurs very rarely.
Table 1: Response Time and Closure Time for Four Apache Projects
Severity Average Response Time (days) Average Closure Time (days) HTTPD Tomcat Xindice Slide HTTPD Tomcat Xindice Slide blocker 204.71 69.00 9 178.50 21.74 362.10 427.80 215.25 critical 309.47 9.50 448 96.06 33.06 371.16 651.80 325.75 enhancement 322.67 98.50 469 136.92 33.32 229.77 668.22 163.06 major 227.93 26.00 - 173.32 30.81 443.52 510.69 145.00 minor 316.30 63.00 - 213.50 36.98 273.40 476.00 214.18 normal 217.09 39.95 3049 197.13 33.65 226.39 474.76 296.66 regression 8.50 293.00 - - 81.80 2.00 -
-trivial 22.86 - - - 27.00 65.00 -
-Grand Average 249.82 53.11 283.93 179.98 33.07 276.47 512.49 266.62 Grand StDev 319.77 108.25 244.82 269.94 40.48 273.35 235.08 327.24
6
Discussion
For many OSS developers, the challenge is what really motivates them and it makes the project more active [10]. Once they are drawn to a problem, they feel that they could create a better solution themselves, rather than using existing ones. Over the time, projects may evolve and so does motivation of the developer.
Our study in OSS project community health revealed two extreme trend lines in developer
participation: (1) lively developers’ activity as shown by Tomcat and HTTPD (Fig 1(a),1(c)). (2) dying developers’ community, which is recognized in Xindice, 1(b).
Xindice, obviously reveals a ”dying” period. We asked experts about the reason behind, the fact are: (a) Xindice has been abandoned by its key developer, which also proves that diversity of core developers is important (b) the developers’ community recognized that proposed plan and the results not to evolve expected. While Slide does not belong to either extreme trend line. On the beginning Slide was very promising, but since October 2004, the project was hit by catastrophic illness shown by the sharp negative pitch. Experts involved in Slide mentioned that Slide was once in a dormant state. The project woke up after a talented expert got involved in November 2003, and significantly contributed for the peak performance of Slide. However after several months, he decided to leave the project leading to the collapse of Slide. We validate this statement by measuring this expert’s mail conversation (”The Expert” Mail). In Figure 1(d), it is obvious that the fluctuation in developers’ mail follows the dynamics in ”The Expert” mails. Around March 2004, as the expert decided to leave the project, Slide developers’ mails still showed notable activity for several months, before their number finally collapsed.
Our work also reveals that Tomcat has the shortest response time among the evaluated projects, which can be interpreted that the community is very responsive to bug reporting as shown in Table 1. HTTPD is positioned as the fastest in bug resolving project, termed as bug’s closure time. For a project, having shorter response time and closure time is considered. We assumed difference bug resolving policies in HTTPD and Tomcat is the reason of these patterns. Another intriguing fact is that the more severe bug does not always mean the higher priority.
We find that in most cases, the community will decide the priority based on some reason, i.e. probability of bug occurrence and/or experts’ opinion, which should be investigated in more depth.
7
Conclusion and Further Work
The investigation of important health indicators is just the beginning. The next step is the development of assessment methods that allow observers to get semi-quantitative measures of project health itself. This will help people to learn how these processes work in-depth, allow to enhance cooperation and give monitoring and ”early-warning” capabilities to projects stakeholder. Nevertheless more works should be done to define relevant dynamics indicators, empirical rules and measurement metrics for assessing an on going OSS project quality and project community.
References
[1] S. Biffl and M. Halling. Investigating the defect detection effectiveness and cost benefit of nominal inspection teams. IEEE Transactions on Software Engineering, 29 (5):385–397., May 2003.
[2] A. Capiluppi, P. Lago, and M. Morisio. Characteristics of open source projects. InProceeding of the 7th European Conf. Software Maintenance and Reengineering (CSMR 03),IEEE CS Press, p.317330, 2003. [3] M. Fowler. Refactoring: Improving the Design of Existing Code. Addison-Wesley Professional, 1999.
[4] A. Ginige and S. Murugesan. Web engineering: an introduction. Multimedia, IEEE, 8, 2001.
[5] D. Hand, H. Mannila, and P. Smyth. Principles of Data Mining. MIT Press, Cambridge, MA,. ISBN 0-262-08290-X, 2001.
[6] S. Krishnamurthy. Cave or community?: An empirical examination of 100 mature open source projects.
First Monday, 2002.
[7] A. Mockus, R. Fielding, and J. Herbsleb. A case study of open source software development: The apache server. InProceeding the 22nd International Conference on Software Engineering, 2000.
[8] A. Mockus, R. Fielding, and J. Herbsleb. Two case studies of open source software development: Apache and mozilla. ACM Transactions on Software Engineering and Methodology, Volume 11 , Issue 3, 2002. [9] S. Murugesan, S. Hansen, and A. Ginige. Web engineering: A new discipline for development of web-based
systems. Lecture Notes in Computer Science, Springer Berlin / Heidelberg, 2016, 2001.
[10] E. Raymond. The cathedral and the bazaar. http://www.catb.org/esr/writings/cathedral-bazaar/cathedral-bazaar/, 2003.
[11] A. Schatten, A. Tjoa, A. Andjomshoa, and M. Shafazand. Conference invited spech: Building a web-based open source tool to enhance project management, monitoring, and collaboration in scientific projects. InProceedings of the third International Conference on Information Integration, Web-Applications and Services, 2001.
[12] J. Thai, B. Pekilis, A. Lau, and R. Seviora. Aspect-oriented implementation of software health. In